Zip Codes with the Highest Percentage of Mexican Population in Independence, MO
RELATED REPORTS & OPTIONS
Mexican
Independence
Compare Zip Codes
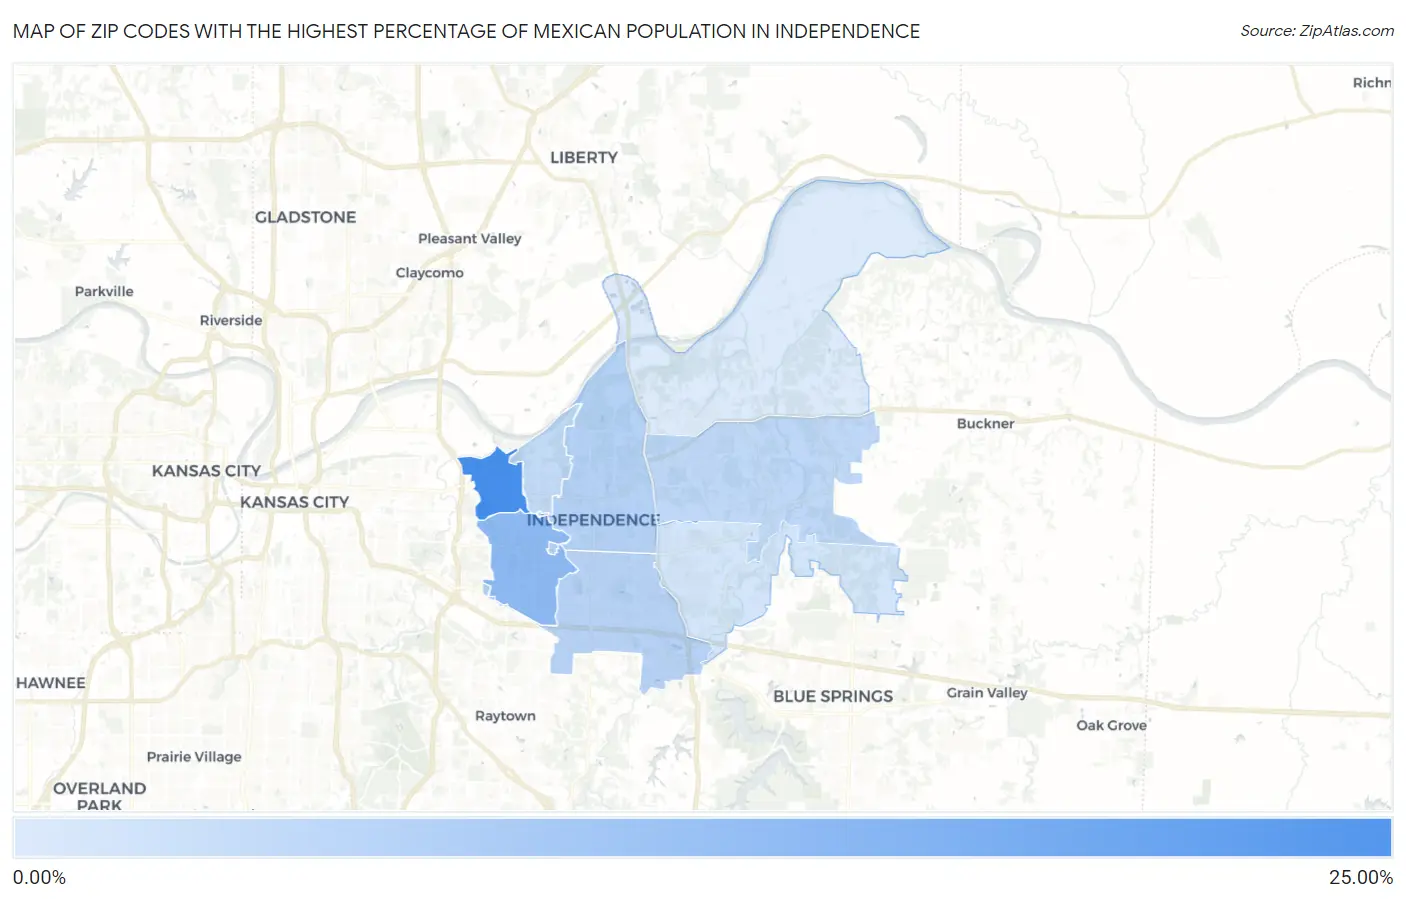
Map of Zip Codes with the Highest Percentage of Mexican Population in Independence
1.05%
20.48%
Zip Codes with the Highest Percentage of Mexican Population in Independence, MO
| Zip Code | Mexican | vs State | vs National | |
| 1. | 64053 | 20.48% | 2.91%(+17.6)#14 | 11.22%(+9.26)#2,810 |
| 2. | 64052 | 10.74% | 2.91%(+7.84)#32 | 11.22%(-0.475)#4,992 |
| 3. | 64050 | 5.77% | 2.91%(+2.86)#96 | 11.22%(-5.45)#7,780 |
| 4. | 64055 | 5.47% | 2.91%(+2.56)#104 | 11.22%(-5.75)#8,046 |
| 5. | 64056 | 4.80% | 2.91%(+1.89)#120 | 11.22%(-6.42)#8,707 |
| 6. | 64054 | 4.19% | 2.91%(+1.29)#141 | 11.22%(-7.03)#9,487 |
| 7. | 64057 | 2.25% | 2.91%(-0.661)#274 | 11.22%(-8.97)#13,398 |
| 8. | 64058 | 1.05% | 2.91%(-1.86)#451 | 11.22%(-10.2)#17,878 |
1
Common Questions
What are the Top 5 Zip Codes with the Highest Percentage of Mexican Population in Independence, MO?
Top 5 Zip Codes with the Highest Percentage of Mexican Population in Independence, MO are:
What zip code has the Highest Percentage of Mexican Population in Independence, MO?
64053 has the Highest Percentage of Mexican Population in Independence, MO with 20.48%.
What is the Percentage of Mexican Population in Independence, MO?
Percentage of Mexican Population in Independence is 6.72%.
What is the Percentage of Mexican Population in Missouri?
Percentage of Mexican Population in Missouri is 2.91%.
What is the Percentage of Mexican Population in the United States?
Percentage of Mexican Population in the United States is 11.22%.