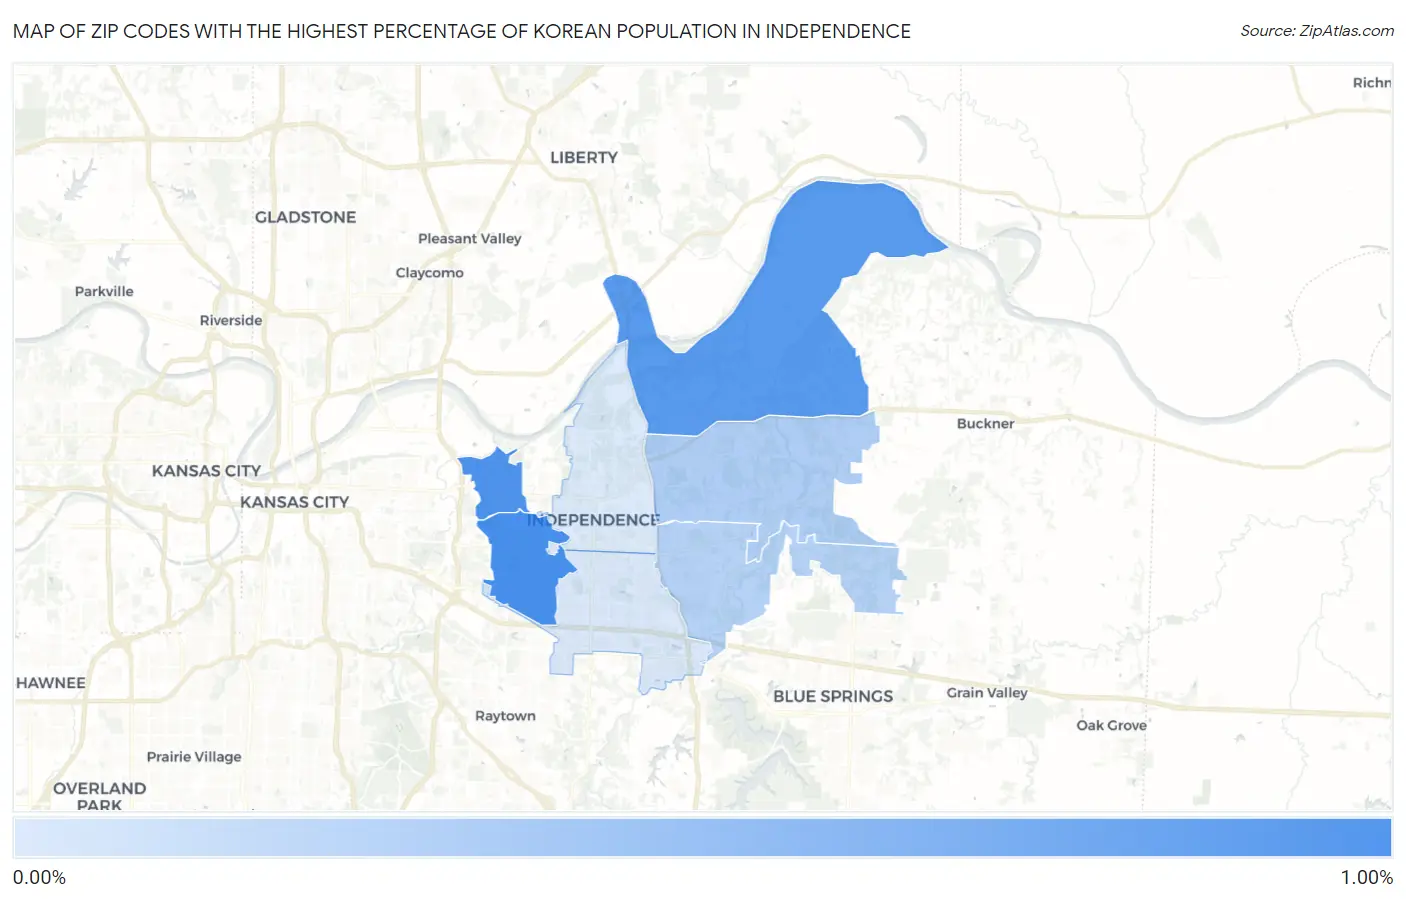
Zip Codes with the Highest Percentage of Korean Population in Independence, MO
RELATED REPORTS & OPTIONS
Korean
Independence
Compare Zip Codes
Map of Zip Codes with the Highest Percentage of Korean Population in Independence
0.10%
0.88%
Zip Codes with the Highest Percentage of Korean Population in Independence, MO
| Zip Code | Korean | vs State | vs National | |
| 1. | 64052 | 0.88% | 0.43%(+0.448)#68 | 1.31%(-0.433)#5,377 |
| 2. | 64053 | 0.83% | 0.43%(+0.401)#76 | 1.31%(-0.480)#5,626 |
| 3. | 64058 | 0.79% | 0.43%(+0.364)#83 | 1.31%(-0.517)#5,841 |
| 4. | 64056 | 0.34% | 0.43%(-0.086)#212 | 1.31%(-0.967)#9,957 |
| 5. | 64057 | 0.30% | 0.43%(-0.128)#227 | 1.31%(-1.01)#10,483 |
| 6. | 64055 | 0.11% | 0.43%(-0.318)#305 | 1.31%(-1.20)#13,409 |
| 7. | 64050 | 0.10% | 0.43%(-0.326)#308 | 1.31%(-1.21)#13,541 |
1
Common Questions
What are the Top 5 Zip Codes with the Highest Percentage of Korean Population in Independence, MO?
Top 5 Zip Codes with the Highest Percentage of Korean Population in Independence, MO are:
What zip code has the Highest Percentage of Korean Population in Independence, MO?
64052 has the Highest Percentage of Korean Population in Independence, MO with 0.88%.
What is the Percentage of Korean Population in Independence, MO?
Percentage of Korean Population in Independence is 0.40%.
What is the Percentage of Korean Population in Missouri?
Percentage of Korean Population in Missouri is 0.43%.
What is the Percentage of Korean Population in the United States?
Percentage of Korean Population in the United States is 1.31%.