Zip Codes with the Highest Percentage of Population Employed in Arts, Media & Entertainment in Independence, MO
RELATED REPORTS & OPTIONS
Arts, Media & Entertainment
Independence
Compare Zip Codes
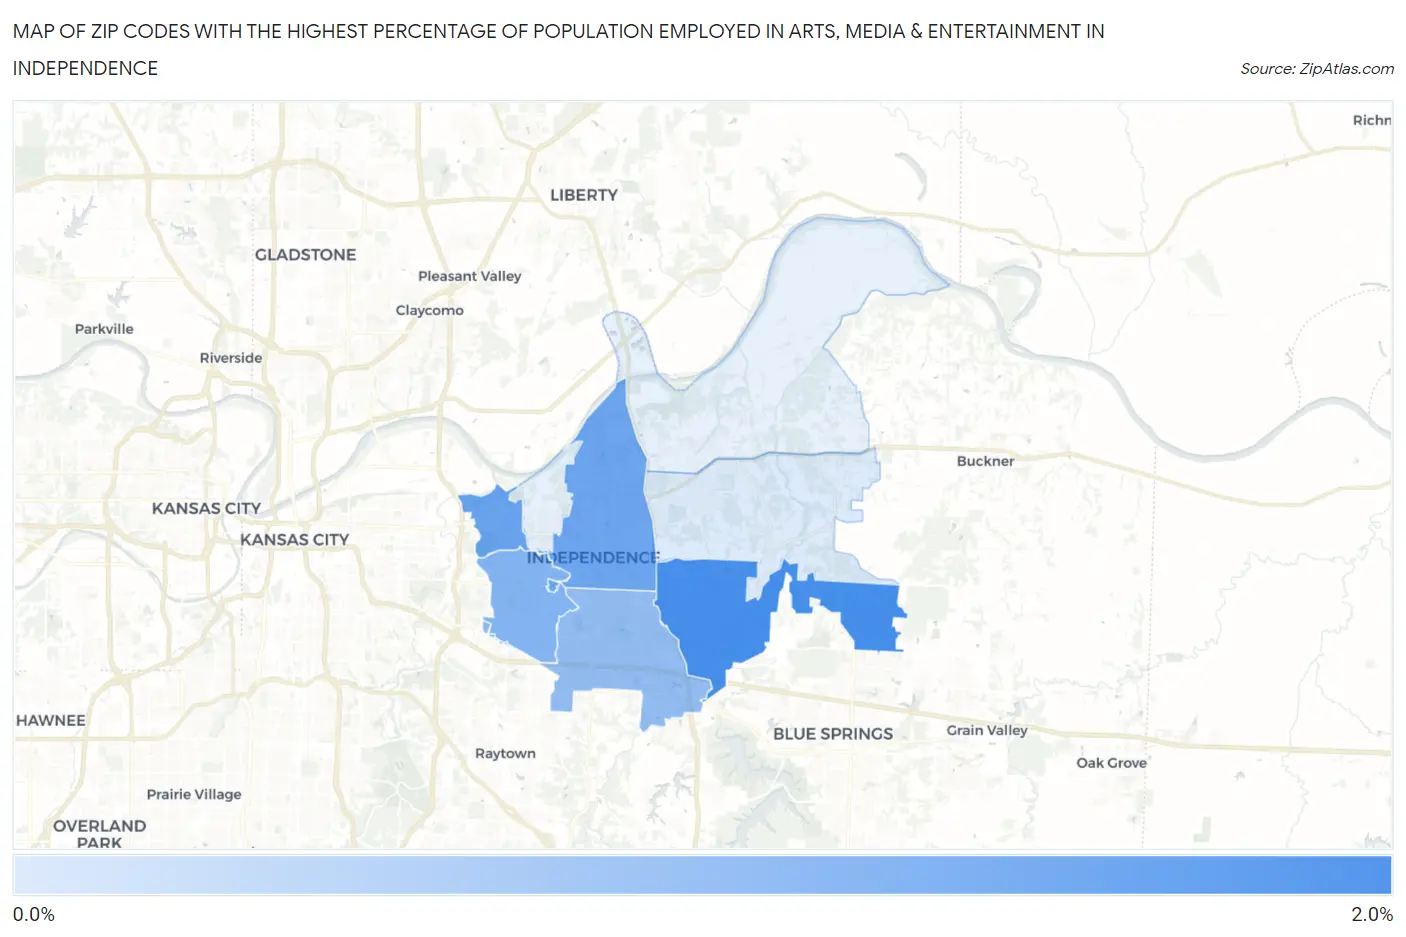
Map of Zip Codes with the Highest Percentage of Population Employed in Arts, Media & Entertainment in Independence
0.62%
2.0%
Zip Codes with the Highest Percentage of Population Employed in Arts, Media & Entertainment in Independence, MO
| Zip Code | % Employed | vs State | vs National | |
| 1. | 64057 | 2.0% | 1.7%(+0.300)#171 | 2.1%(-0.104)#8,044 |
| 2. | 64053 | 1.6% | 1.7%(-0.015)#217 | 2.1%(-0.419)#10,049 |
| 3. | 64050 | 1.6% | 1.7%(-0.051)#224 | 2.1%(-0.455)#10,299 |
| 4. | 64052 | 1.4% | 1.7%(-0.255)#258 | 2.1%(-0.659)#11,705 |
| 5. | 64055 | 1.3% | 1.7%(-0.387)#278 | 2.1%(-0.792)#12,685 |
| 6. | 64056 | 0.62% | 1.7%(-1.04)#421 | 2.1%(-1.44)#17,920 |
1
Common Questions
What are the Top 5 Zip Codes with the Highest Percentage of Population Employed in Arts, Media & Entertainment in Independence, MO?
Top 5 Zip Codes with the Highest Percentage of Population Employed in Arts, Media & Entertainment in Independence, MO are:
What zip code has the Highest Percentage of Population Employed in Arts, Media & Entertainment in Independence, MO?
64057 has the Highest Percentage of Population Employed in Arts, Media & Entertainment in Independence, MO with 2.0%.
What is the Percentage of Population Employed in Arts, Media & Entertainment in Independence, MO?
Percentage of Population Employed in Arts, Media & Entertainment in Independence is 1.3%.
What is the Percentage of Population Employed in Arts, Media & Entertainment in Missouri?
Percentage of Population Employed in Arts, Media & Entertainment in Missouri is 1.7%.
What is the Percentage of Population Employed in Arts, Media & Entertainment in the United States?
Percentage of Population Employed in Arts, Media & Entertainment in the United States is 2.1%.