Zip Codes with the Highest Percentage of Welsh Population in Independence, MO
RELATED REPORTS & OPTIONS
Welsh
Independence
Compare Zip Codes
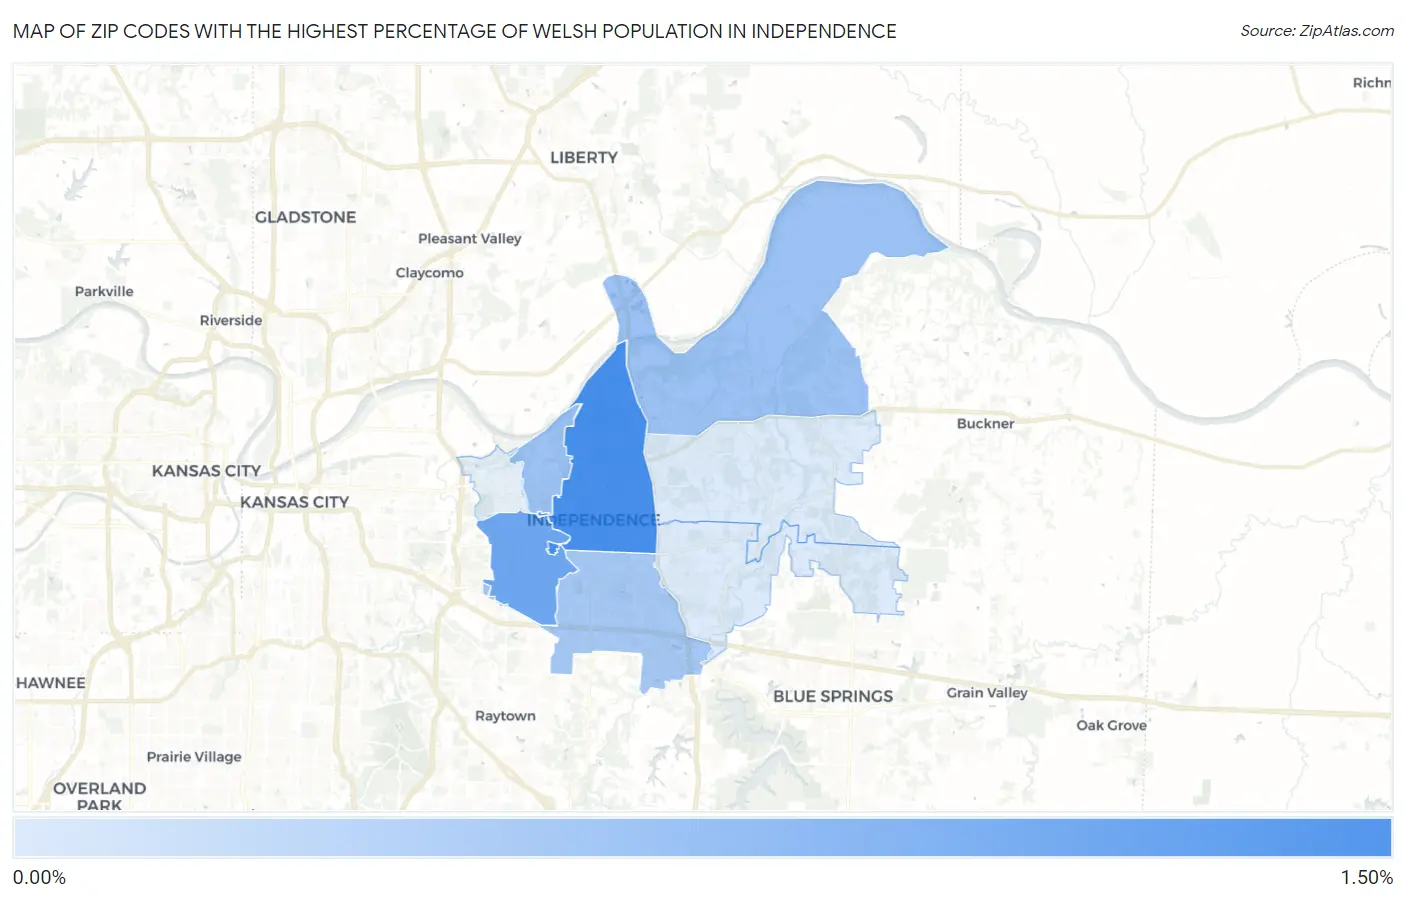
Map of Zip Codes with the Highest Percentage of Welsh Population in Independence
0.39%
1.32%
Zip Codes with the Highest Percentage of Welsh Population in Independence, MO
| Zip Code | Welsh | vs State | vs National | |
| 1. | 64050 | 1.32% | 0.57%(+0.753)#91 | 0.52%(+0.796)#3,551 |
| 2. | 64052 | 1.07% | 0.57%(+0.507)#122 | 0.52%(+0.550)#4,803 |
| 3. | 64054 | 0.81% | 0.57%(+0.239)#182 | 0.52%(+0.282)#6,966 |
| 4. | 64058 | 0.79% | 0.57%(+0.225)#184 | 0.52%(+0.268)#7,102 |
| 5. | 64055 | 0.73% | 0.57%(+0.159)#207 | 0.52%(+0.203)#7,865 |
| 6. | 64056 | 0.39% | 0.57%(-0.181)#380 | 0.52%(-0.138)#13,228 |
| 7. | 64057 | 0.39% | 0.57%(-0.183)#383 | 0.52%(-0.139)#13,266 |
1
Common Questions
What are the Top 5 Zip Codes with the Highest Percentage of Welsh Population in Independence, MO?
Top 5 Zip Codes with the Highest Percentage of Welsh Population in Independence, MO are:
What zip code has the Highest Percentage of Welsh Population in Independence, MO?
64050 has the Highest Percentage of Welsh Population in Independence, MO with 1.32%.
What is the Percentage of Welsh Population in Independence, MO?
Percentage of Welsh Population in Independence is 0.78%.
What is the Percentage of Welsh Population in Missouri?
Percentage of Welsh Population in Missouri is 0.57%.
What is the Percentage of Welsh Population in the United States?
Percentage of Welsh Population in the United States is 0.52%.