Zip Codes with the Highest Percentage of Population Employed in Health Diagnosing & Treating in Inver Grove Heights, MN
RELATED REPORTS & OPTIONS
Health Diagnosing & Treating
Inver Grove Heights
Compare Zip Codes
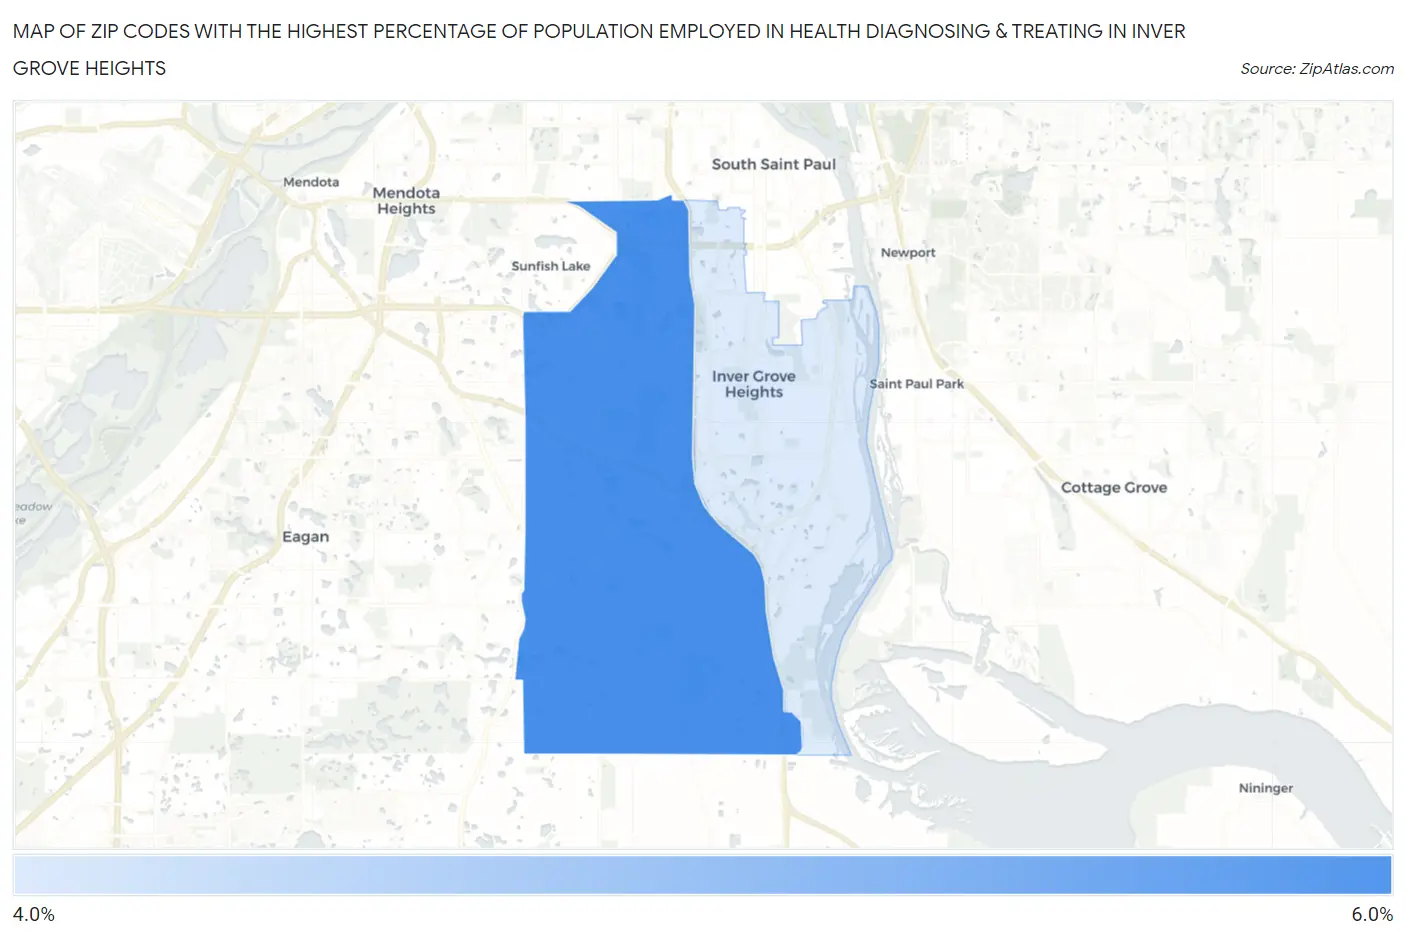
Map of Zip Codes with the Highest Percentage of Population Employed in Health Diagnosing & Treating in Inver Grove Heights
4.6%
5.7%
Zip Codes with the Highest Percentage of Population Employed in Health Diagnosing & Treating in Inver Grove Heights, MN
| Zip Code | % Employed | vs State | vs National | |
| 1. | 55077 | 5.7% | 6.8%(-1.05)#443 | 6.2%(-0.534)#14,957 |
| 2. | 55076 | 4.6% | 6.8%(-2.17)#591 | 6.2%(-1.66)#19,301 |
1
Common Questions
What are the Top Zip Codes with the Highest Percentage of Population Employed in Health Diagnosing & Treating in Inver Grove Heights, MN?
Top Zip Codes with the Highest Percentage of Population Employed in Health Diagnosing & Treating in Inver Grove Heights, MN are:
What zip code has the Highest Percentage of Population Employed in Health Diagnosing & Treating in Inver Grove Heights, MN?
55077 has the Highest Percentage of Population Employed in Health Diagnosing & Treating in Inver Grove Heights, MN with 5.7%.
What is the Percentage of Population Employed in Health Diagnosing & Treating in Inver Grove Heights, MN?
Percentage of Population Employed in Health Diagnosing & Treating in Inver Grove Heights is 5.0%.
What is the Percentage of Population Employed in Health Diagnosing & Treating in Minnesota?
Percentage of Population Employed in Health Diagnosing & Treating in Minnesota is 6.8%.
What is the Percentage of Population Employed in Health Diagnosing & Treating in the United States?
Percentage of Population Employed in Health Diagnosing & Treating in the United States is 6.2%.