Pikeville, KY Map & Demographics
Pikeville Map
Pikeville Overview
$31,614
PER CAPITA INCOME
$73,475
AVG FAMILY INCOME
$41,324
AVG HOUSEHOLD INCOME
8.6%
WAGE / INCOME GAP [ % ]
91.4¢/ $1
WAGE / INCOME GAP [ $ ]
0.61
INEQUALITY / GINI INDEX
7,563
TOTAL POPULATION
3,726
MALE POPULATION
3,837
FEMALE POPULATION
97.11
MALES / 100 FEMALES
102.98
FEMALES / 100 MALES
35.8
MEDIAN AGE
2.8
AVG FAMILY SIZE
2.2
AVG HOUSEHOLD SIZE
3,017
LABOR FORCE [ PEOPLE ]
46.8%
PERCENT IN LABOR FORCE
4.1%
UNEMPLOYMENT RATE
Pikeville Zip Codes
Pikeville Area Codes
Income in Pikeville
Income Overview in Pikeville
Per Capita Income in Pikeville is $31,614, while median incomes of families and households are $73,475 and $41,324 respectively.
| Characteristic | Number | Measure |
| Per Capita Income | 7,563 | $31,614 |
| Median Family Income | 1,857 | $73,475 |
| Mean Family Income | 1,857 | $105,502 |
| Median Household Income | 3,078 | $41,324 |
| Mean Household Income | 3,078 | $75,169 |
| Income Deficit | 1,857 | $0 |
| Wage / Income Gap (%) | 7,563 | 8.64% |
| Wage / Income Gap ($) | 7,563 | 91.36¢ per $1 |
| Gini / Inequality Index | 7,563 | 0.61 |
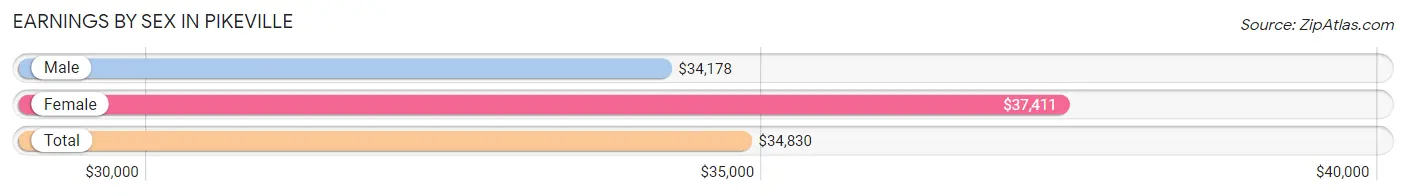
Earnings by Sex in Pikeville
Average Earnings in Pikeville are $34,830, $34,178 for men and $37,411 for women, a difference of 8.6%.
| Sex | Number | Average Earnings |
| Male | 1,751 (52.6%) | $34,178 |
| Female | 1,576 (47.4%) | $37,411 |
| Total | 3,327 (100.0%) | $34,830 |
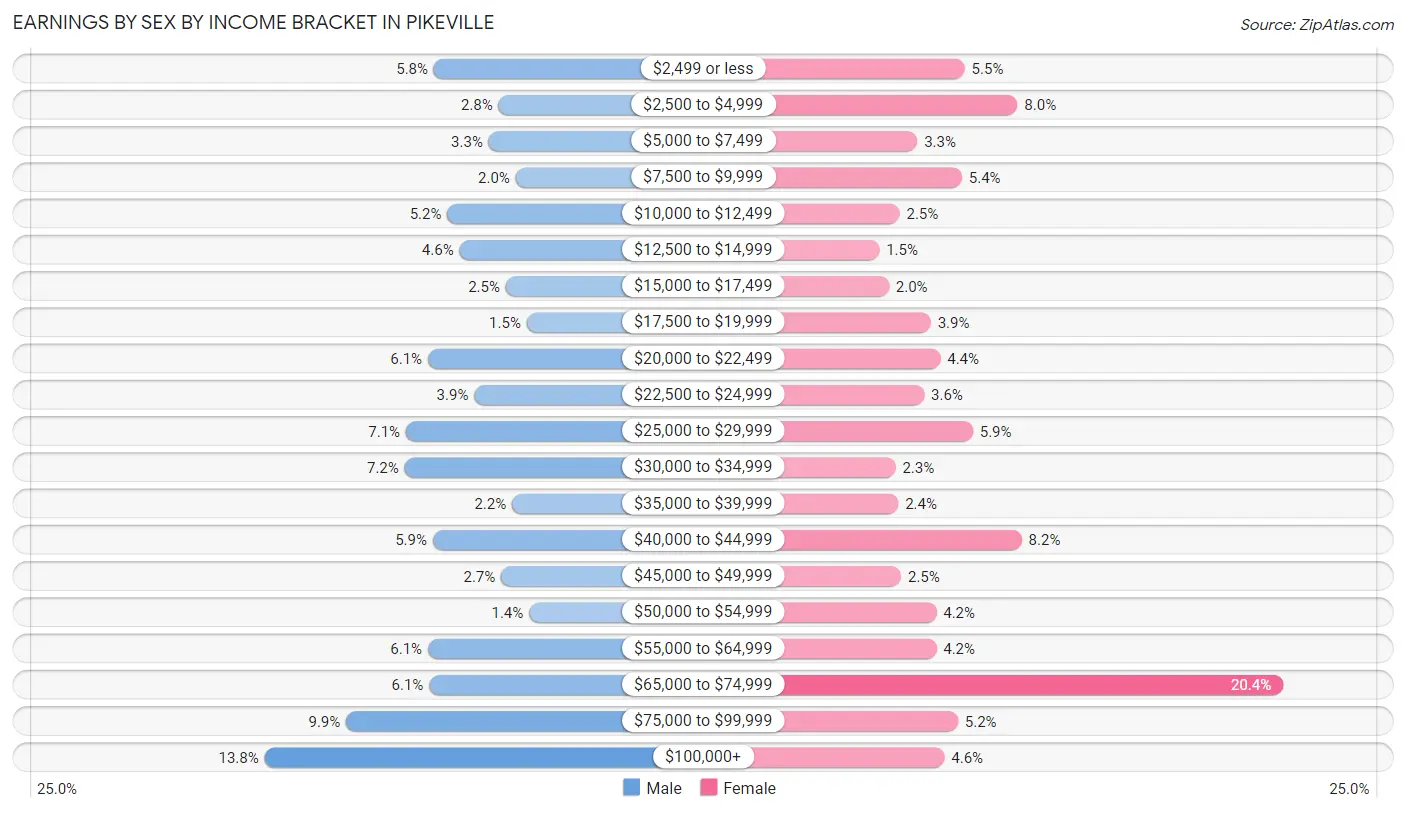
Earnings by Sex by Income Bracket in Pikeville
The most common earnings brackets in Pikeville are $100,000+ for men (241 | 13.8%) and $65,000 to $74,999 for women (322 | 20.4%).
| Income | Male | Female |
| $2,499 or less | 102 (5.8%) | 87 (5.5%) |
| $2,500 to $4,999 | 49 (2.8%) | 126 (8.0%) |
| $5,000 to $7,499 | 57 (3.3%) | 52 (3.3%) |
| $7,500 to $9,999 | 35 (2.0%) | 85 (5.4%) |
| $10,000 to $12,499 | 91 (5.2%) | 39 (2.5%) |
| $12,500 to $14,999 | 81 (4.6%) | 24 (1.5%) |
| $15,000 to $17,499 | 43 (2.5%) | 31 (2.0%) |
| $17,500 to $19,999 | 26 (1.5%) | 62 (3.9%) |
| $20,000 to $22,499 | 107 (6.1%) | 69 (4.4%) |
| $22,500 to $24,999 | 69 (3.9%) | 57 (3.6%) |
| $25,000 to $29,999 | 125 (7.1%) | 93 (5.9%) |
| $30,000 to $34,999 | 126 (7.2%) | 36 (2.3%) |
| $35,000 to $39,999 | 38 (2.2%) | 38 (2.4%) |
| $40,000 to $44,999 | 103 (5.9%) | 129 (8.2%) |
| $45,000 to $49,999 | 47 (2.7%) | 40 (2.5%) |
| $50,000 to $54,999 | 24 (1.4%) | 66 (4.2%) |
| $55,000 to $64,999 | 107 (6.1%) | 66 (4.2%) |
| $65,000 to $74,999 | 106 (6.0%) | 322 (20.4%) |
| $75,000 to $99,999 | 174 (9.9%) | 82 (5.2%) |
| $100,000+ | 241 (13.8%) | 72 (4.6%) |
| Total | 1,751 (100.0%) | 1,576 (100.0%) |
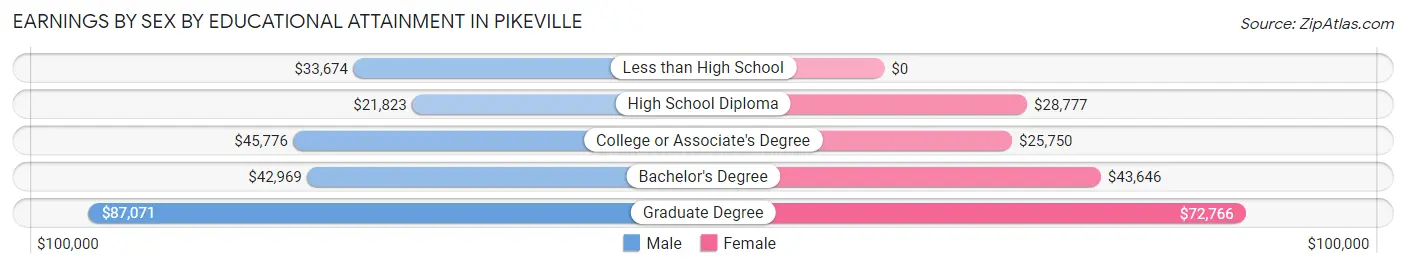
Earnings by Sex by Educational Attainment in Pikeville
Average earnings in Pikeville are $42,075 for men and $49,265 for women, a difference of 14.6%. Men with an educational attainment of graduate degree enjoy the highest average annual earnings of $87,071, while those with high school diploma education earn the least with $21,823. Women with an educational attainment of graduate degree earn the most with the average annual earnings of $72,766, while those with college or associate's degree education have the smallest earnings of $25,750.
| Educational Attainment | Male Income | Female Income |
| Less than High School | $33,674 | $0 |
| High School Diploma | $21,823 | $28,777 |
| College or Associate's Degree | $45,776 | $25,750 |
| Bachelor's Degree | $42,969 | $43,646 |
| Graduate Degree | $87,071 | $72,766 |
| Total | $42,075 | $49,265 |
Family Income in Pikeville
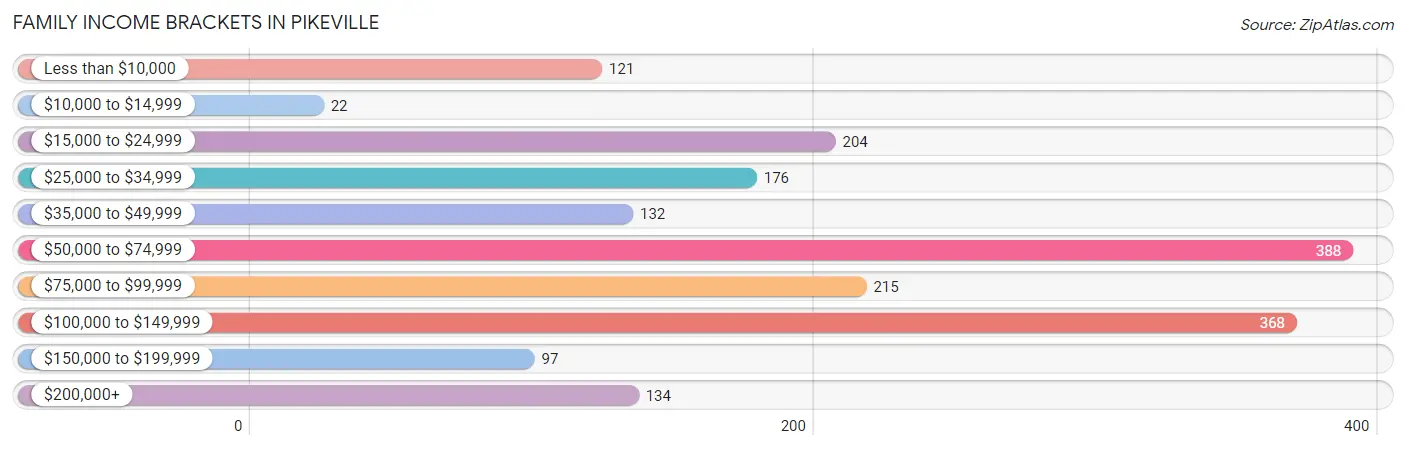
Family Income Brackets in Pikeville
According to the Pikeville family income data, there are 388 families falling into the $50,000 to $74,999 income range, which is the most common income bracket and makes up 20.9% of all families. Conversely, the $10,000 to $14,999 income bracket is the least frequent group with only 22 families (1.2%) belonging to this category.
| Income Bracket | # Families | % Families |
| Less than $10,000 | 121 | 6.5% |
| $10,000 to $14,999 | 22 | 1.2% |
| $15,000 to $24,999 | 204 | 11.0% |
| $25,000 to $34,999 | 176 | 9.5% |
| $35,000 to $49,999 | 132 | 7.1% |
| $50,000 to $74,999 | 388 | 20.9% |
| $75,000 to $99,999 | 215 | 11.6% |
| $100,000 to $149,999 | 368 | 19.8% |
| $150,000 to $199,999 | 97 | 5.2% |
| $200,000+ | 134 | 7.2% |
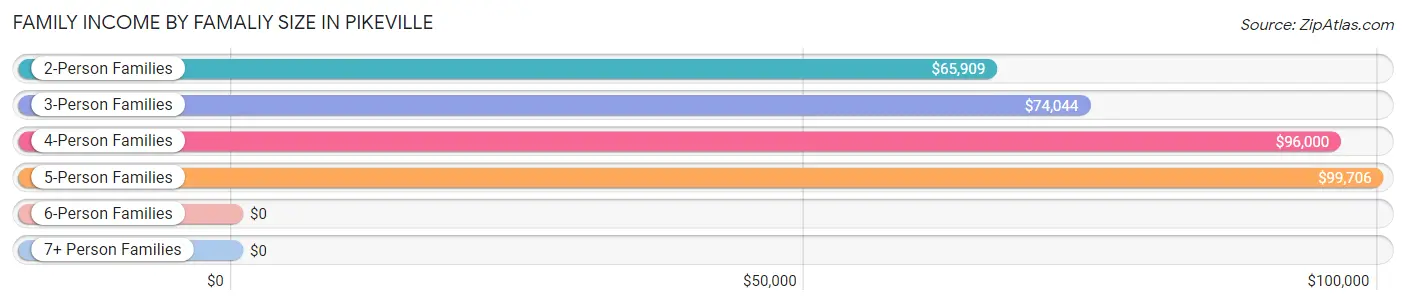
Family Income by Famaliy Size in Pikeville
5-person families (176 | 9.5%) account for the highest median family income in Pikeville with $99,706 per family, while 2-person families (1,134 | 61.1%) have the highest median income of $32,954 per family member.
| Income Bracket | # Families | Median Income |
| 2-Person Families | 1,134 (61.1%) | $65,909 |
| 3-Person Families | 361 (19.4%) | $74,044 |
| 4-Person Families | 166 (8.9%) | $96,000 |
| 5-Person Families | 176 (9.5%) | $99,706 |
| 6-Person Families | 15 (0.8%) | $0 |
| 7+ Person Families | 5 (0.3%) | $0 |
| Total | 1,857 (100.0%) | $73,475 |
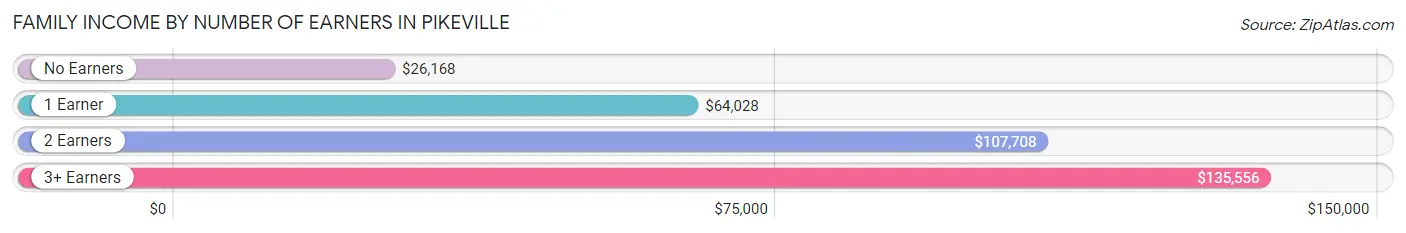
Family Income by Number of Earners in Pikeville
The median family income in Pikeville is $73,475, with families comprising 3+ earners (74) having the highest median family income of $135,556, while families with no earners (401) have the lowest median family income of $26,168, accounting for 4.0% and 21.6% of families, respectively.
| Number of Earners | # Families | Median Income |
| No Earners | 401 (21.6%) | $26,168 |
| 1 Earner | 713 (38.4%) | $64,028 |
| 2 Earners | 669 (36.0%) | $107,708 |
| 3+ Earners | 74 (4.0%) | $135,556 |
| Total | 1,857 (100.0%) | $73,475 |
Household Income in Pikeville
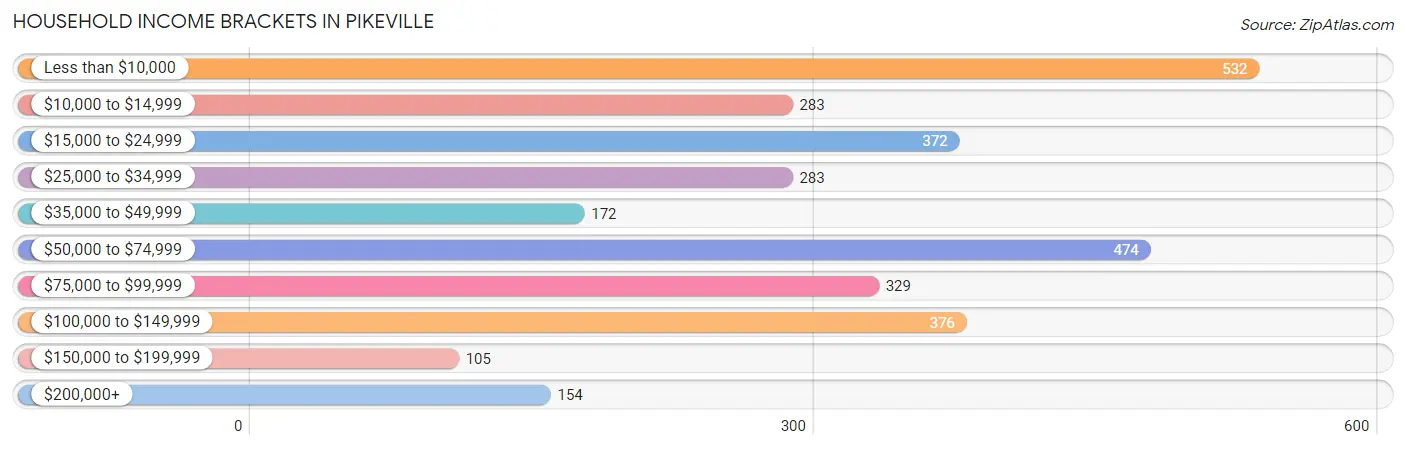
Household Income Brackets in Pikeville
With 532 households falling in the category, the less than $10,000 income range is the most frequent in Pikeville, accounting for 17.3% of all households. In contrast, only 105 households (3.4%) fall into the $150,000 to $199,999 income bracket, making it the least populous group.
| Income Bracket | # Households | % Households |
| Less than $10,000 | 532 | 17.3% |
| $10,000 to $14,999 | 283 | 9.2% |
| $15,000 to $24,999 | 372 | 12.1% |
| $25,000 to $34,999 | 283 | 9.2% |
| $35,000 to $49,999 | 172 | 5.6% |
| $50,000 to $74,999 | 474 | 15.4% |
| $75,000 to $99,999 | 329 | 10.7% |
| $100,000 to $149,999 | 376 | 12.2% |
| $150,000 to $199,999 | 105 | 3.4% |
| $200,000+ | 154 | 5.0% |
Household Income by Householder Age in Pikeville
The median household income in Pikeville is $41,324, with the highest median household income of $73,076 found in the 45 to 64 years age bracket for the primary householder. A total of 1,255 households (40.8%) fall into this category. Meanwhile, the 15 to 24 years age bracket for the primary householder has the lowest median household income of $0, with 329 households (10.7%) in this group.
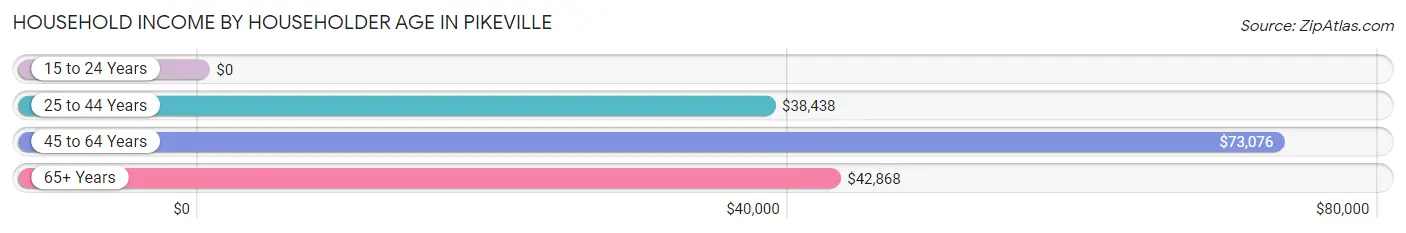
| Income Bracket | # Households | Median Income |
| 15 to 24 Years | 329 (10.7%) | $0 |
| 25 to 44 Years | 905 (29.4%) | $38,438 |
| 45 to 64 Years | 1,255 (40.8%) | $73,076 |
| 65+ Years | 589 (19.1%) | $42,868 |
| Total | 3,078 (100.0%) | $41,324 |
Poverty in Pikeville
Income Below Poverty by Sex and Age in Pikeville
With 23.2% poverty level for males and 26.7% for females among the residents of Pikeville, 18 to 24 year old males and 12 to 14 year old females are the most vulnerable to poverty, with 204 males (55.1%) and 130 females (51.4%) in their respective age groups living below the poverty level.
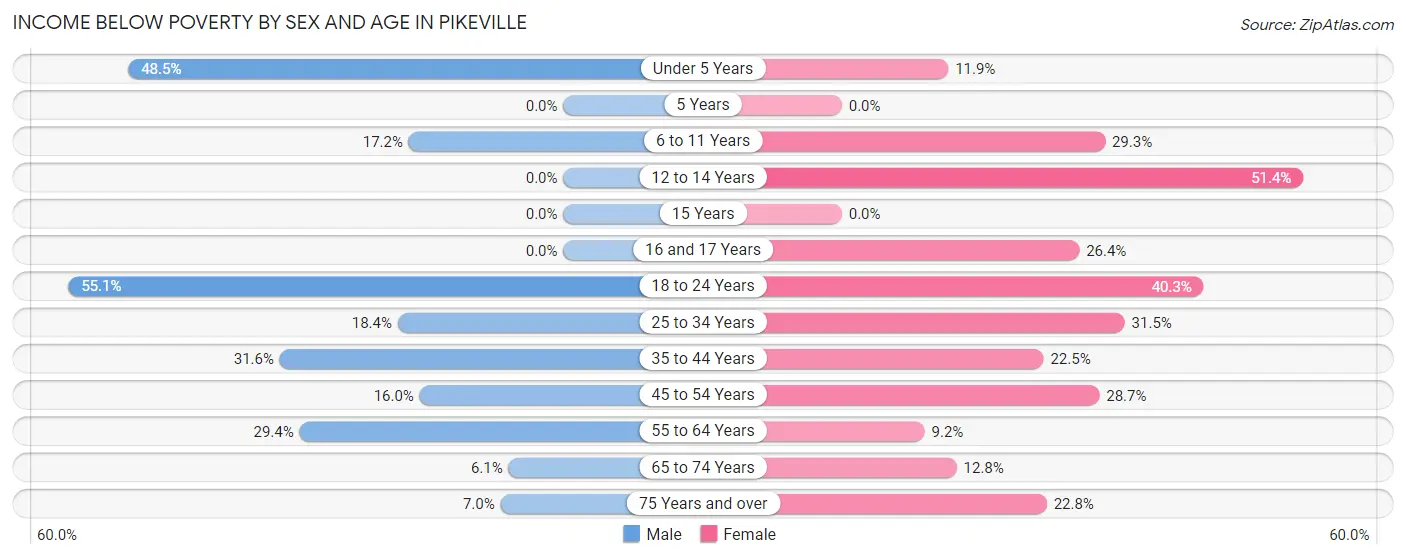
| Age Bracket | Male | Female |
| Under 5 Years | 63 (48.5%) | 16 (11.8%) |
| 5 Years | 0 (0.0%) | 0 (0.0%) |
| 6 to 11 Years | 37 (17.2%) | 34 (29.3%) |
| 12 to 14 Years | 0 (0.0%) | 130 (51.4%) |
| 15 Years | 0 (0.0%) | 0 (0.0%) |
| 16 and 17 Years | 0 (0.0%) | 23 (26.4%) |
| 18 to 24 Years | 204 (55.1%) | 187 (40.3%) |
| 25 to 34 Years | 104 (18.4%) | 143 (31.5%) |
| 35 to 44 Years | 84 (31.6%) | 115 (22.5%) |
| 45 to 54 Years | 92 (16.0%) | 181 (28.7%) |
| 55 to 64 Years | 114 (29.4%) | 27 (9.2%) |
| 65 to 74 Years | 13 (6.1%) | 38 (12.8%) |
| 75 Years and over | 13 (7.0%) | 68 (22.8%) |
| Total | 724 (23.2%) | 962 (26.7%) |
Income Above Poverty by Sex and Age in Pikeville
According to the poverty statistics in Pikeville, males aged 12 to 14 years and females aged 5 years are the age groups that are most secure financially, with 100.0% of males and 100.0% of females in these age groups living above the poverty line.
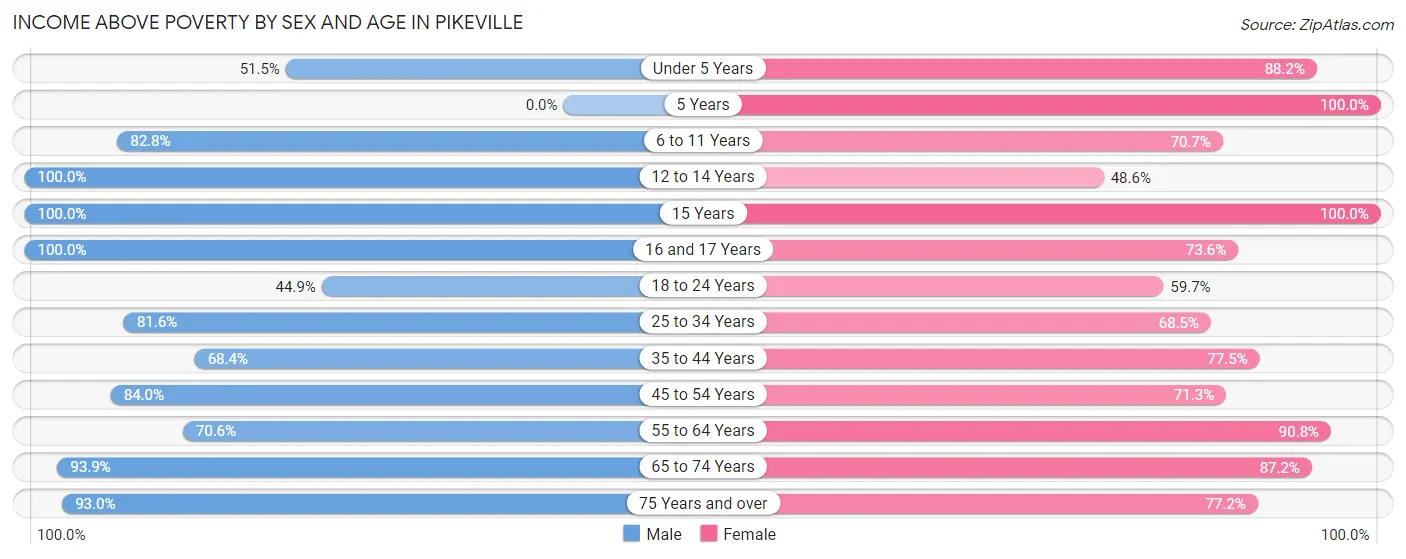
| Age Bracket | Male | Female |
| Under 5 Years | 67 (51.5%) | 119 (88.1%) |
| 5 Years | 0 (0.0%) | 25 (100.0%) |
| 6 to 11 Years | 178 (82.8%) | 82 (70.7%) |
| 12 to 14 Years | 134 (100.0%) | 123 (48.6%) |
| 15 Years | 58 (100.0%) | 34 (100.0%) |
| 16 and 17 Years | 28 (100.0%) | 64 (73.6%) |
| 18 to 24 Years | 166 (44.9%) | 277 (59.7%) |
| 25 to 34 Years | 460 (81.6%) | 311 (68.5%) |
| 35 to 44 Years | 182 (68.4%) | 397 (77.5%) |
| 45 to 54 Years | 483 (84.0%) | 450 (71.3%) |
| 55 to 64 Years | 274 (70.6%) | 266 (90.8%) |
| 65 to 74 Years | 200 (93.9%) | 259 (87.2%) |
| 75 Years and over | 173 (93.0%) | 230 (77.2%) |
| Total | 2,403 (76.8%) | 2,637 (73.3%) |
Income Below Poverty Among Married-Couple Families in Pikeville
The poverty statistics for married-couple families in Pikeville show that 8.9% or 108 of the total 1,216 families live below the poverty line. Families with 1 or 2 children have the highest poverty rate of 18.8%, comprising of 63 families. On the other hand, families with 3 or 4 children have the lowest poverty rate of 0.0%, which includes 0 families.
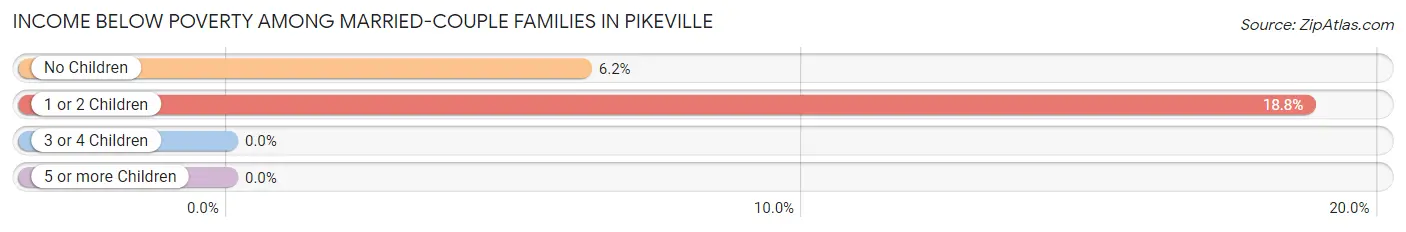
| Children | Above Poverty | Below Poverty |
| No Children | 686 (93.8%) | 45 (6.2%) |
| 1 or 2 Children | 273 (81.2%) | 63 (18.8%) |
| 3 or 4 Children | 149 (100.0%) | 0 (0.0%) |
| 5 or more Children | 0 (0.0%) | 0 (0.0%) |
| Total | 1,108 (91.1%) | 108 (8.9%) |
Income Below Poverty Among Single-Parent Households in Pikeville
According to the poverty data in Pikeville, 34.8% or 54 single-father households and 30.4% or 148 single-mother households are living below the poverty line. Among single-father households, those with 1 or 2 children have the highest poverty rate, with 54 households (87.1%) experiencing poverty. Likewise, among single-mother households, those with 1 or 2 children have the highest poverty rate, with 77 households (55.4%) falling below the poverty line.
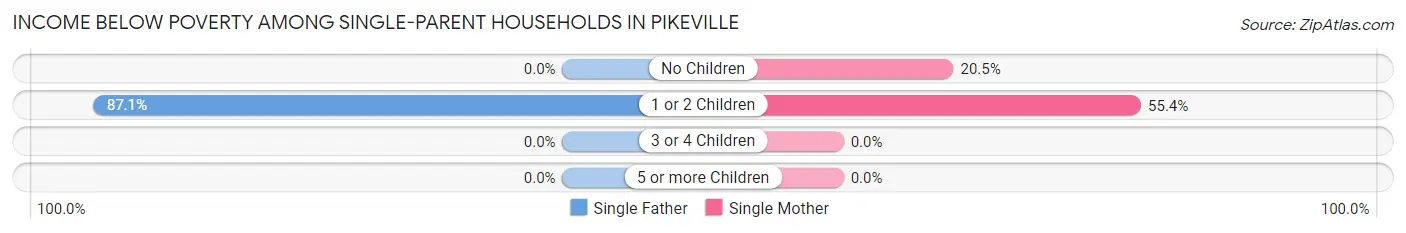
| Children | Single Father | Single Mother |
| No Children | 0 (0.0%) | 71 (20.5%) |
| 1 or 2 Children | 54 (87.1%) | 77 (55.4%) |
| 3 or 4 Children | 0 (0.0%) | 0 (0.0%) |
| 5 or more Children | 0 (0.0%) | 0 (0.0%) |
| Total | 54 (34.8%) | 148 (30.4%) |
Income Below Poverty Among Married-Couple vs Single-Parent Households in Pikeville
The poverty data for Pikeville shows that 108 of the married-couple family households (8.9%) and 202 of the single-parent households (31.5%) are living below the poverty level. Within the married-couple family households, those with 1 or 2 children have the highest poverty rate, with 63 households (18.8%) falling below the poverty line. Among the single-parent households, those with 1 or 2 children have the highest poverty rate, with 131 household (65.2%) living below poverty.
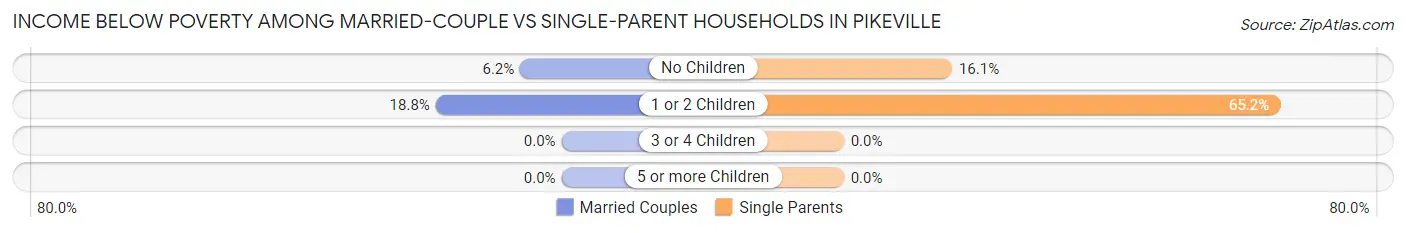
| Children | Married-Couple Families | Single-Parent Households |
| No Children | 45 (6.2%) | 71 (16.1%) |
| 1 or 2 Children | 63 (18.8%) | 131 (65.2%) |
| 3 or 4 Children | 0 (0.0%) | 0 (0.0%) |
| 5 or more Children | 0 (0.0%) | 0 (0.0%) |
| Total | 108 (8.9%) | 202 (31.5%) |
Race in Pikeville
The most populous races in Pikeville are White / Caucasian (6,980 | 92.3%), Black / African American (252 | 3.3%), and Two or more Races (161 | 2.1%).
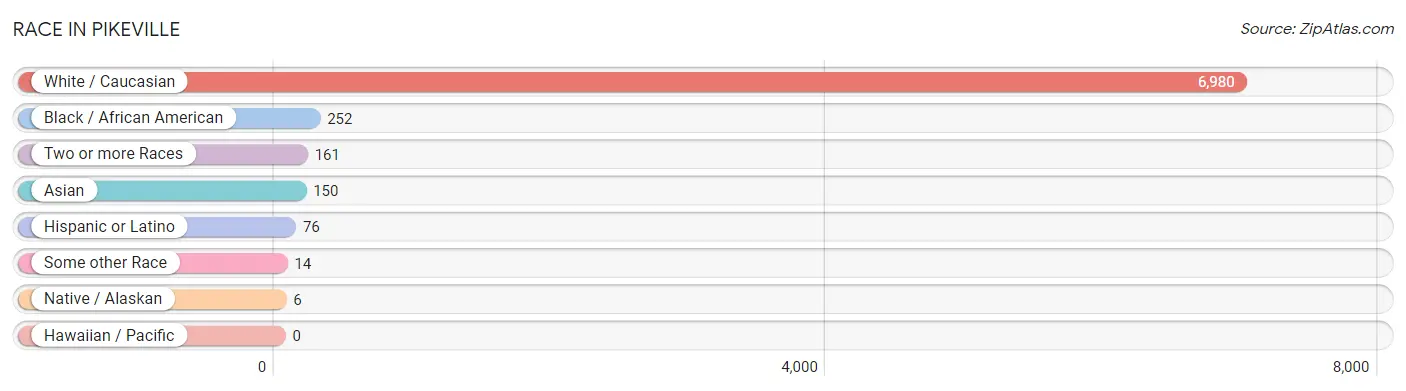
| Race | # Population | % Population |
| Asian | 150 | 2.0% |
| Black / African American | 252 | 3.3% |
| Hawaiian / Pacific | 0 | 0.0% |
| Hispanic or Latino | 76 | 1.0% |
| Native / Alaskan | 6 | 0.1% |
| White / Caucasian | 6,980 | 92.3% |
| Two or more Races | 161 | 2.1% |
| Some other Race | 14 | 0.2% |
| Total | 7,563 | 100.0% |
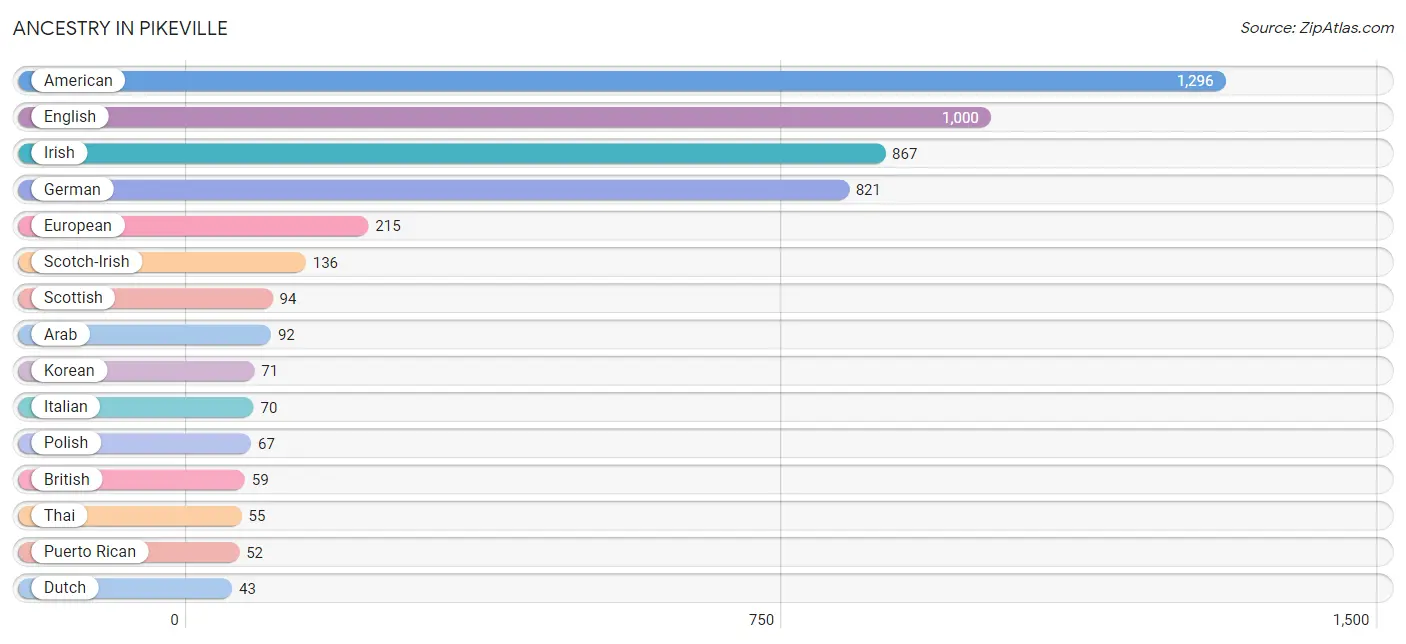
Ancestry in Pikeville
The most populous ancestries reported in Pikeville are American (1,296 | 17.1%), English (1,000 | 13.2%), Irish (867 | 11.5%), German (821 | 10.9%), and European (215 | 2.8%), together accounting for 55.5% of all Pikeville residents.
| Ancestry | # Population | % Population |
| African | 2 | 0.0% |
| American | 1,296 | 17.1% |
| Arab | 92 | 1.2% |
| Bangladeshi | 7 | 0.1% |
| Belgian | 8 | 0.1% |
| Bhutanese | 32 | 0.4% |
| Blackfeet | 6 | 0.1% |
| British | 59 | 0.8% |
| Cherokee | 26 | 0.3% |
| Cuban | 13 | 0.2% |
| Danish | 15 | 0.2% |
| Dutch | 43 | 0.6% |
| Ecuadorian | 11 | 0.2% |
| English | 1,000 | 13.2% |
| European | 215 | 2.8% |
| French | 12 | 0.2% |
| French Canadian | 11 | 0.2% |
| German | 821 | 10.9% |
| Greek | 17 | 0.2% |
| Hungarian | 10 | 0.1% |
| Indian (Asian) | 37 | 0.5% |
| Iranian | 3 | 0.0% |
| Irish | 867 | 11.5% |
| Italian | 70 | 0.9% |
| Jordanian | 11 | 0.2% |
| Korean | 71 | 0.9% |
| Latvian | 7 | 0.1% |
| Maltese | 12 | 0.2% |
| Northern European | 6 | 0.1% |
| Norwegian | 16 | 0.2% |
| Polish | 67 | 0.9% |
| Puerto Rican | 52 | 0.7% |
| Russian | 19 | 0.3% |
| Scotch-Irish | 136 | 1.8% |
| Scottish | 94 | 1.2% |
| South American | 11 | 0.2% |
| Subsaharan African | 2 | 0.0% |
| Swedish | 7 | 0.1% |
| Syrian | 13 | 0.2% |
| Thai | 55 | 0.7% |
| Welsh | 36 | 0.5% | View All 41 Rows |
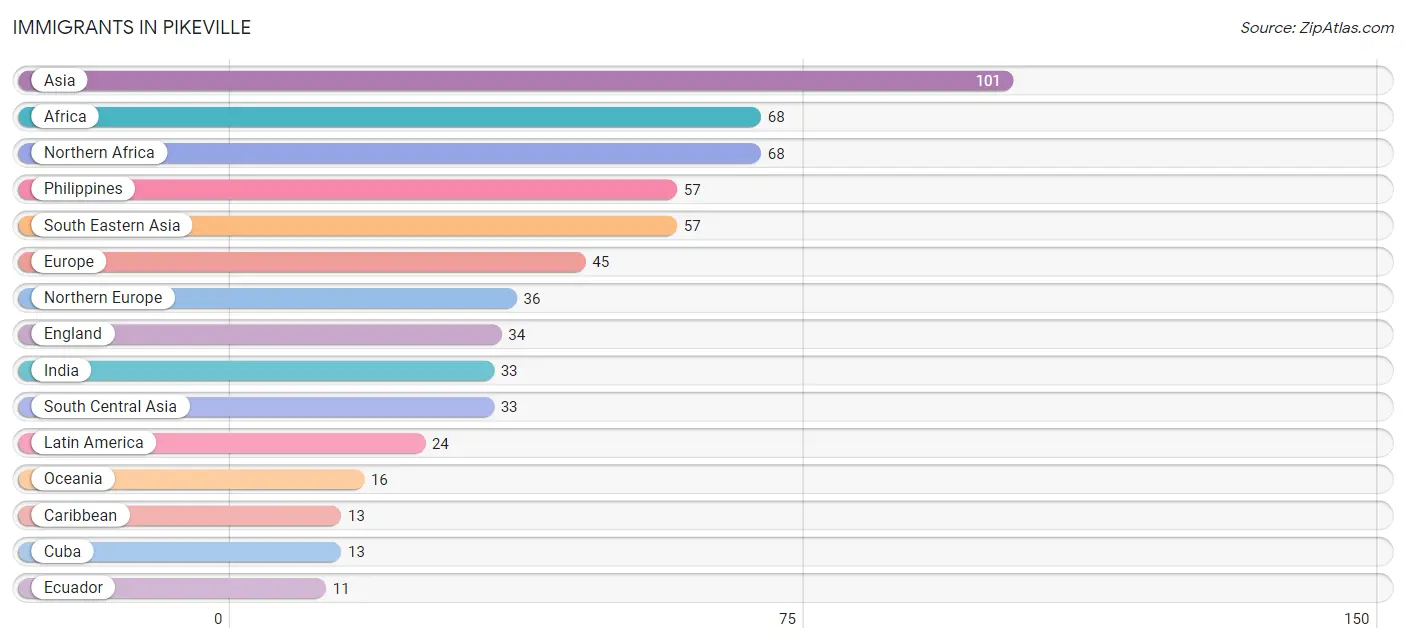
Immigrants in Pikeville
The most numerous immigrant groups reported in Pikeville came from Asia (101 | 1.3%), Africa (68 | 0.9%), Northern Africa (68 | 0.9%), Philippines (57 | 0.7%), and South Eastern Asia (57 | 0.7%), together accounting for 4.6% of all Pikeville residents.
| Immigration Origin | # Population | % Population |
| Africa | 68 | 0.9% |
| Asia | 101 | 1.3% |
| Caribbean | 13 | 0.2% |
| Cuba | 13 | 0.2% |
| Eastern Europe | 9 | 0.1% |
| Ecuador | 11 | 0.2% |
| England | 34 | 0.4% |
| Europe | 45 | 0.6% |
| India | 33 | 0.4% |
| Kuwait | 11 | 0.2% |
| Latin America | 24 | 0.3% |
| Northern Africa | 68 | 0.9% |
| Northern Europe | 36 | 0.5% |
| Oceania | 16 | 0.2% |
| Philippines | 57 | 0.7% |
| Poland | 9 | 0.1% |
| Scotland | 2 | 0.0% |
| South America | 11 | 0.2% |
| South Central Asia | 33 | 0.4% |
| South Eastern Asia | 57 | 0.7% |
| Western Asia | 11 | 0.2% | View All 21 Rows |
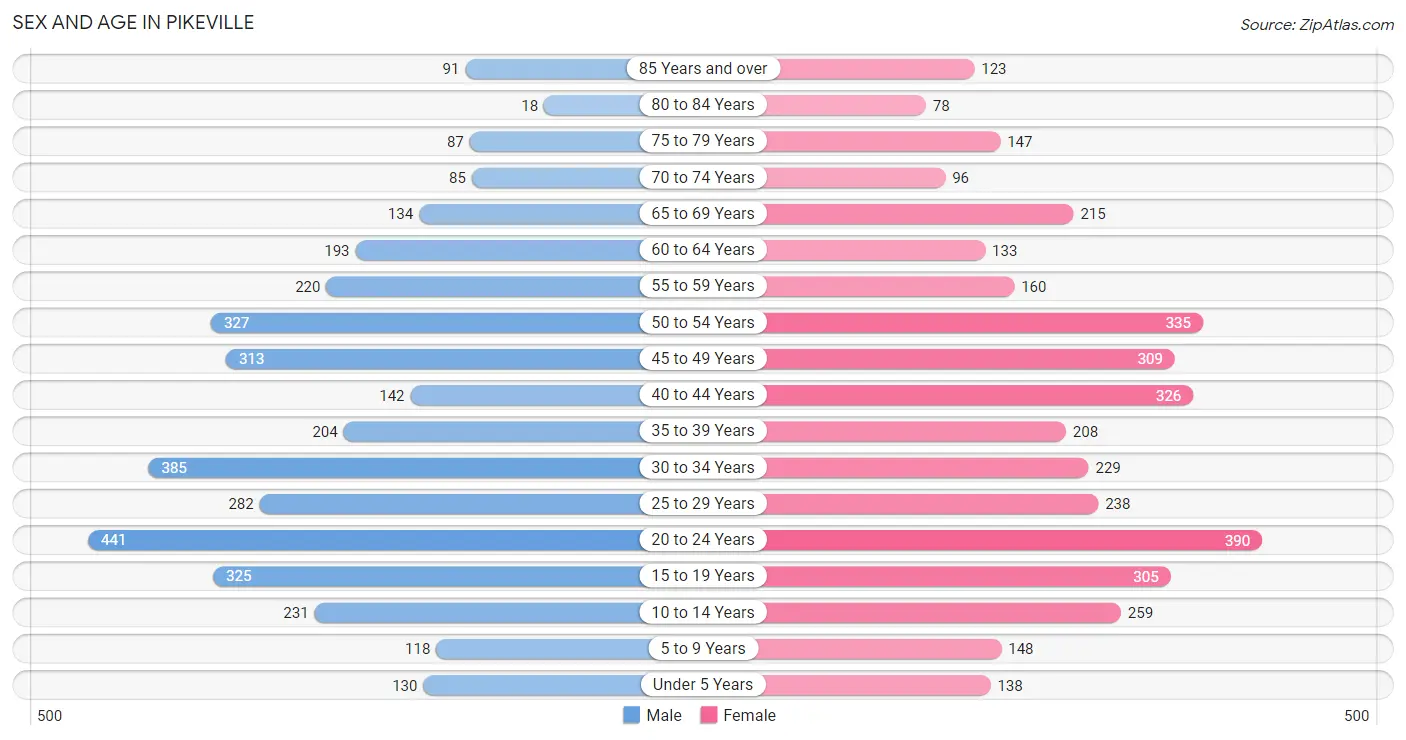
Sex and Age in Pikeville
Sex and Age in Pikeville
The most populous age groups in Pikeville are 20 to 24 Years (441 | 11.8%) for men and 20 to 24 Years (390 | 10.2%) for women.
| Age Bracket | Male | Female |
| Under 5 Years | 130 (3.5%) | 138 (3.6%) |
| 5 to 9 Years | 118 (3.2%) | 148 (3.9%) |
| 10 to 14 Years | 231 (6.2%) | 259 (6.8%) |
| 15 to 19 Years | 325 (8.7%) | 305 (8.0%) |
| 20 to 24 Years | 441 (11.8%) | 390 (10.2%) |
| 25 to 29 Years | 282 (7.6%) | 238 (6.2%) |
| 30 to 34 Years | 385 (10.3%) | 229 (6.0%) |
| 35 to 39 Years | 204 (5.5%) | 208 (5.4%) |
| 40 to 44 Years | 142 (3.8%) | 326 (8.5%) |
| 45 to 49 Years | 313 (8.4%) | 309 (8.1%) |
| 50 to 54 Years | 327 (8.8%) | 335 (8.7%) |
| 55 to 59 Years | 220 (5.9%) | 160 (4.2%) |
| 60 to 64 Years | 193 (5.2%) | 133 (3.5%) |
| 65 to 69 Years | 134 (3.6%) | 215 (5.6%) |
| 70 to 74 Years | 85 (2.3%) | 96 (2.5%) |
| 75 to 79 Years | 87 (2.3%) | 147 (3.8%) |
| 80 to 84 Years | 18 (0.5%) | 78 (2.0%) |
| 85 Years and over | 91 (2.4%) | 123 (3.2%) |
| Total | 3,726 (100.0%) | 3,837 (100.0%) |
Families and Households in Pikeville
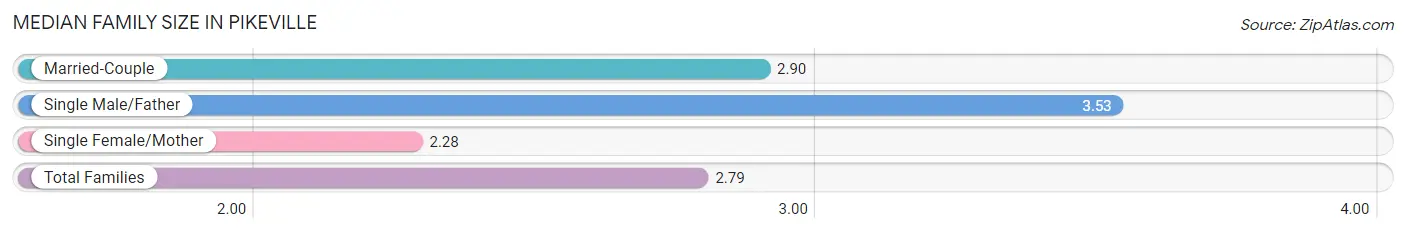
Median Family Size in Pikeville
The median family size in Pikeville is 2.79 persons per family, with single male/father families (155 | 8.4%) accounting for the largest median family size of 3.53 persons per family. On the other hand, single female/mother families (486 | 26.2%) represent the smallest median family size with 2.28 persons per family.
| Family Type | # Families | Family Size |
| Married-Couple | 1,216 (65.5%) | 2.90 |
| Single Male/Father | 155 (8.4%) | 3.53 |
| Single Female/Mother | 486 (26.2%) | 2.28 |
| Total Families | 1,857 (100.0%) | 2.79 |
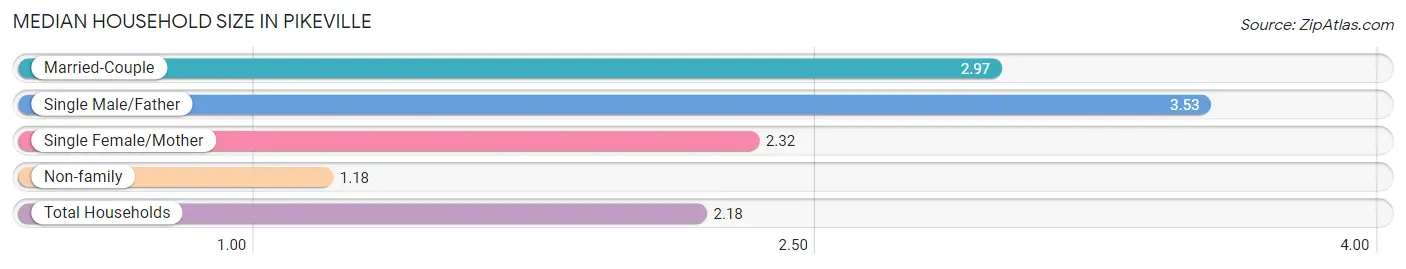
Median Household Size in Pikeville
The median household size in Pikeville is 2.18 persons per household, with single male/father households (155 | 5.0%) accounting for the largest median household size of 3.53 persons per household. non-family households (1,221 | 39.7%) represent the smallest median household size with 1.18 persons per household.
| Household Type | # Households | Household Size |
| Married-Couple | 1,216 (39.5%) | 2.97 |
| Single Male/Father | 155 (5.0%) | 3.53 |
| Single Female/Mother | 486 (15.8%) | 2.32 |
| Non-family | 1,221 (39.7%) | 1.18 |
| Total Households | 3,078 (100.0%) | 2.18 |
Household Size by Marriage Status in Pikeville
Out of a total of 3,078 households in Pikeville, 1,857 (60.3%) are family households, while 1,221 (39.7%) are nonfamily households. The most numerous type of family households are 2-person households, comprising 1,113, and the most common type of nonfamily households are 1-person households, comprising 1,063.
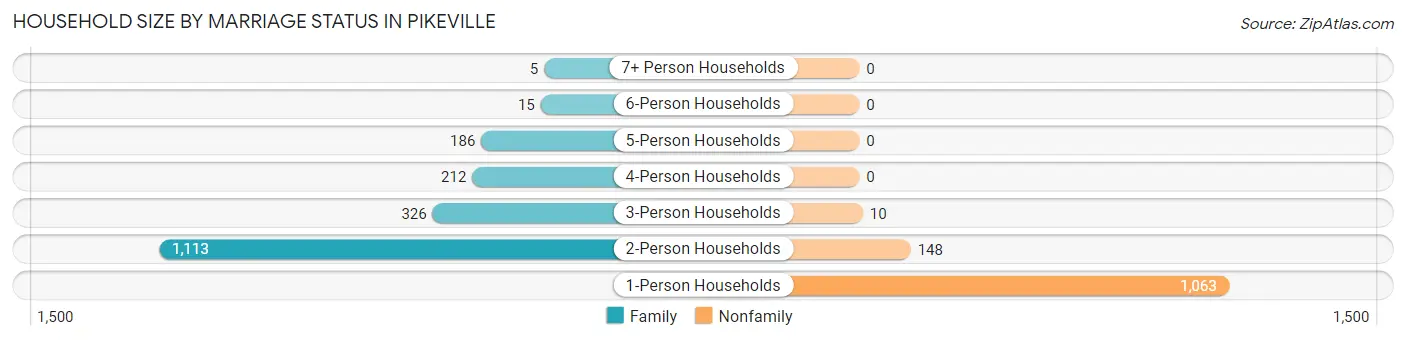
| Household Size | Family Households | Nonfamily Households |
| 1-Person Households | - | 1,063 (34.5%) |
| 2-Person Households | 1,113 (36.2%) | 148 (4.8%) |
| 3-Person Households | 326 (10.6%) | 10 (0.3%) |
| 4-Person Households | 212 (6.9%) | 0 (0.0%) |
| 5-Person Households | 186 (6.0%) | 0 (0.0%) |
| 6-Person Households | 15 (0.5%) | 0 (0.0%) |
| 7+ Person Households | 5 (0.2%) | 0 (0.0%) |
| Total | 1,857 (60.3%) | 1,221 (39.7%) |
Female Fertility in Pikeville
Fertility by Age in Pikeville
Average fertility rate in Pikeville is 19.0 births per 1,000 women. Women in the age bracket of 20 to 34 years have the highest fertility rate with 46.0 births per 1,000 women. Women in the age bracket of 20 to 34 years acount for 100.0% of all women with births.
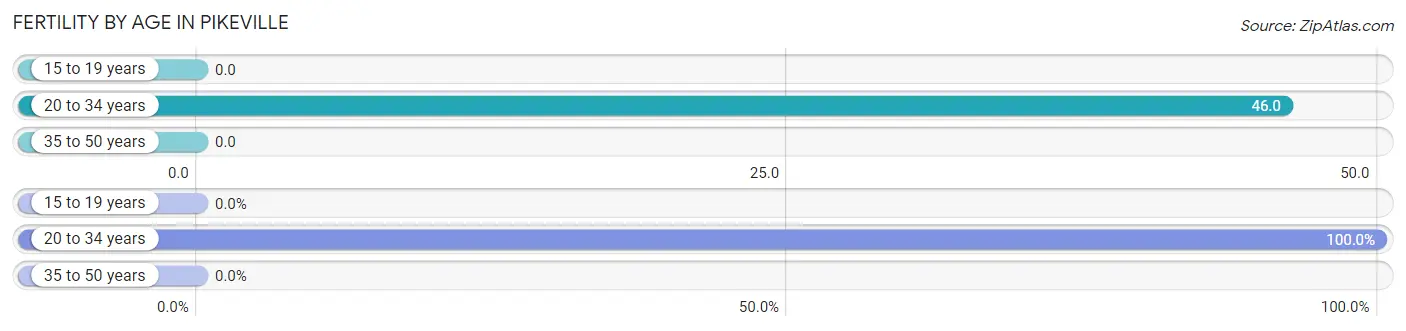
| Age Bracket | Women with Births | Births / 1,000 Women |
| 15 to 19 years | 0 (0.0%) | 0.0 |
| 20 to 34 years | 39 (100.0%) | 46.0 |
| 35 to 50 years | 0 (0.0%) | 0.0 |
| Total | 39 (100.0%) | 19.0 |
Fertility by Age by Marriage Status in Pikeville
82.1% of women with births (39) in Pikeville are married. The highest percentage of unmarried women with births falls into 20 to 34 years age bracket with 17.9% of them unmarried at the time of birth, while the lowest percentage of unmarried women with births belong to 20 to 34 years age bracket with 17.9% of them unmarried.
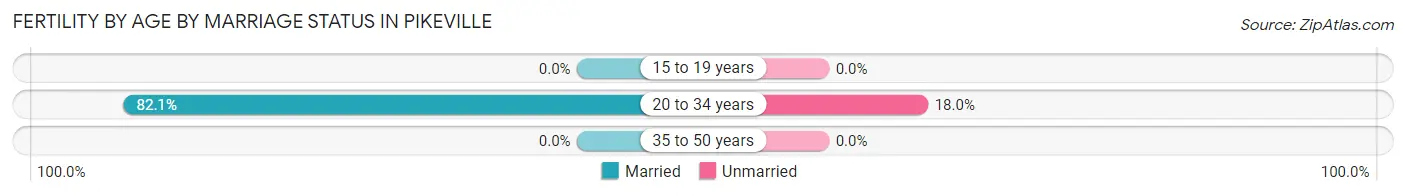
| Age Bracket | Married | Unmarried |
| 15 to 19 years | 0 (0.0%) | 0 (0.0%) |
| 20 to 34 years | 32 (82.1%) | 7 (17.9%) |
| 35 to 50 years | 0 (0.0%) | 0 (0.0%) |
| Total | 32 (82.1%) | 7 (17.9%) |
Fertility by Education in Pikeville
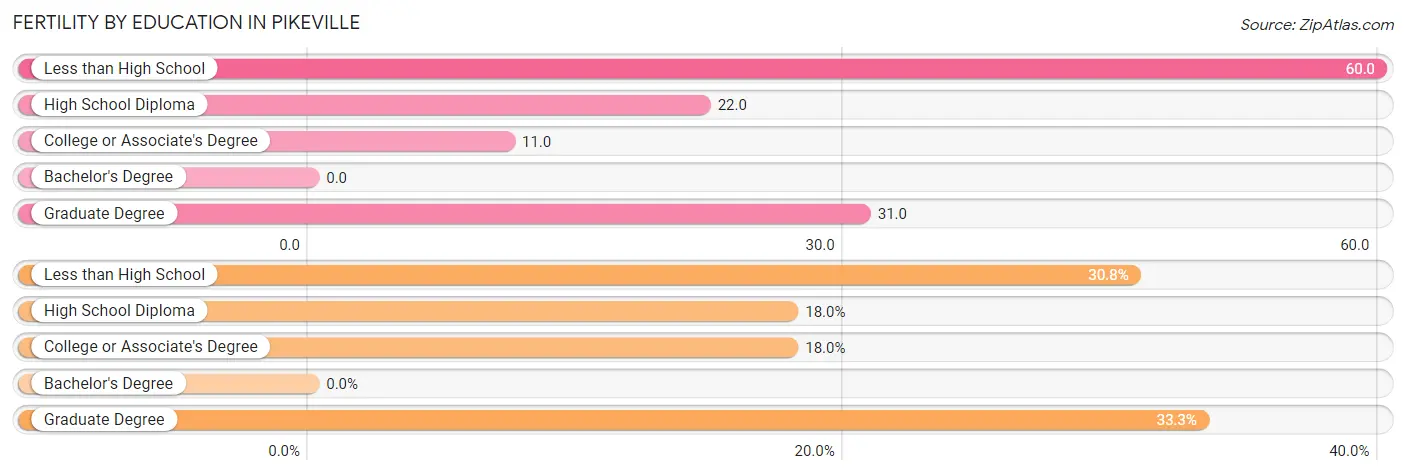
| Educational Attainment | Women with Births | Births / 1,000 Women |
| Less than High School | 12 (30.8%) | 60.0 |
| High School Diploma | 7 (17.9%) | 22.0 |
| College or Associate's Degree | 7 (17.9%) | 11.0 |
| Bachelor's Degree | 0 (0.0%) | 0.0 |
| Graduate Degree | 13 (33.3%) | 31.0 |
| Total | 39 (100.0%) | 19.0 |
Fertility by Education by Marriage Status in Pikeville
17.9% of women with births in Pikeville are unmarried. Women with the educational attainment of less than high school are most likely to be married with 100.0% of them married at childbirth, while women with the educational attainment of high school diploma are least likely to be married with 100.0% of them unmarried at childbirth.
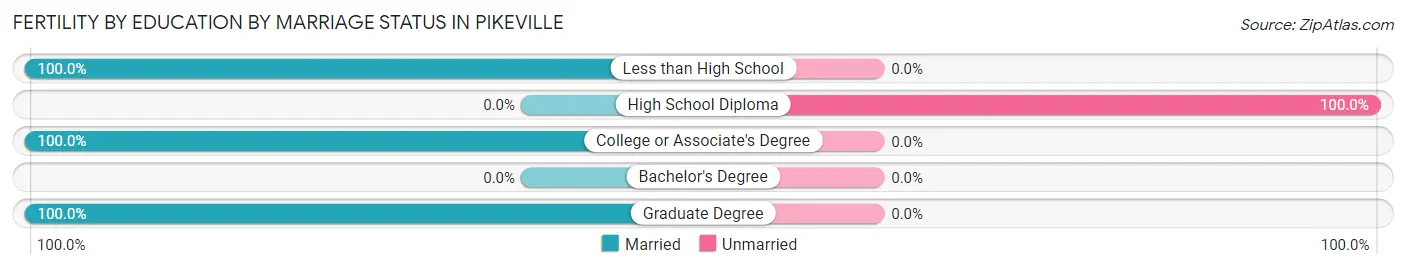
| Educational Attainment | Married | Unmarried |
| Less than High School | 12 (100.0%) | 0 (0.0%) |
| High School Diploma | 0 (0.0%) | 7 (100.0%) |
| College or Associate's Degree | 7 (100.0%) | 0 (0.0%) |
| Bachelor's Degree | 0 (0.0%) | 0 (0.0%) |
| Graduate Degree | 13 (100.0%) | 0 (0.0%) |
| Total | 32 (82.1%) | 7 (17.9%) |
Employment Characteristics in Pikeville
Employment by Class of Employer in Pikeville
Among the 2,825 employed individuals in Pikeville, private company employees (1,736 | 61.5%), not-for-profit organizations (424 | 15.0%), and state government employees (351 | 12.4%) make up the most common classes of employment.
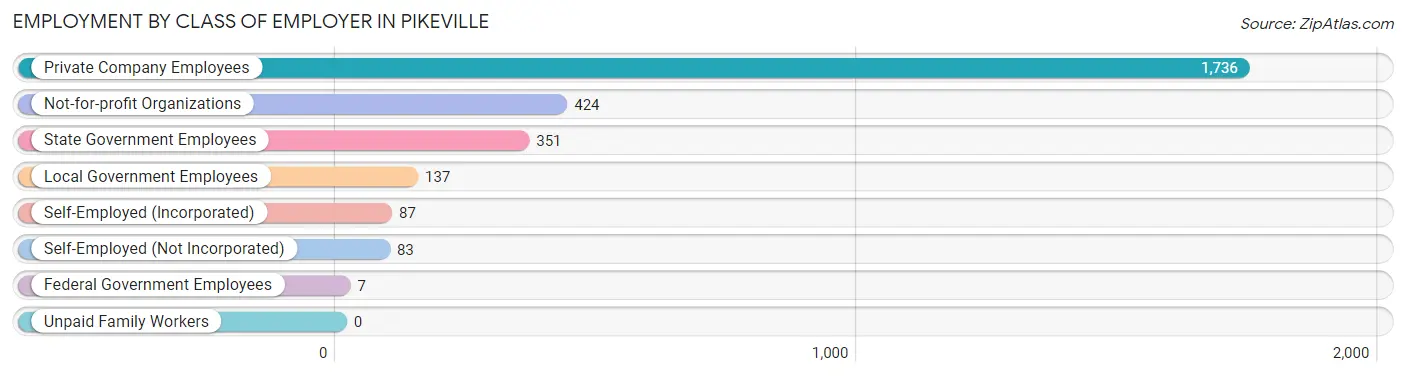
| Employer Class | # Employees | % Employees |
| Private Company Employees | 1,736 | 61.5% |
| Self-Employed (Incorporated) | 87 | 3.1% |
| Self-Employed (Not Incorporated) | 83 | 2.9% |
| Not-for-profit Organizations | 424 | 15.0% |
| Local Government Employees | 137 | 4.9% |
| State Government Employees | 351 | 12.4% |
| Federal Government Employees | 7 | 0.3% |
| Unpaid Family Workers | 0 | 0.0% |
| Total | 2,825 | 100.0% |
Employment Status by Age in Pikeville
According to the labor force statistics for Pikeville, out of the total population over 16 years of age (6,447), 46.8% or 3,017 individuals are in the labor force, with 4.1% or 124 of them unemployed. The age group with the highest labor force participation rate is 30 to 34 years, with 78.3% or 481 individuals in the labor force. Within the labor force, the 16 to 19 years age range has the highest percentage of unemployed individuals, with 45.0% or 68 of them being unemployed.
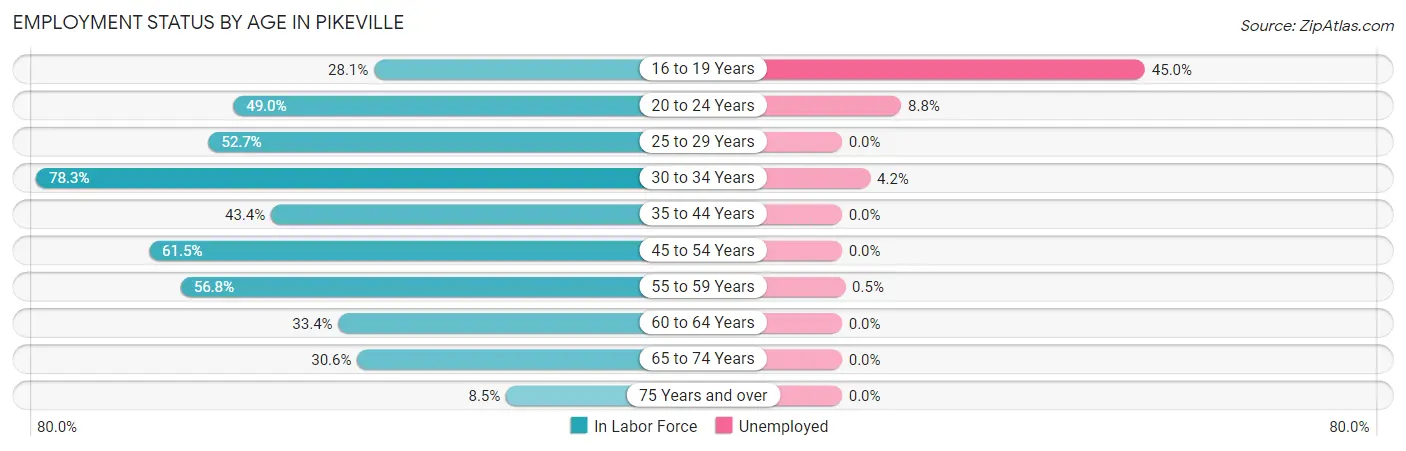
| Age Bracket | In Labor Force | Unemployed |
| 16 to 19 Years | 151 (28.1%) | 68 (45.0%) |
| 20 to 24 Years | 407 (49.0%) | 36 (8.8%) |
| 25 to 29 Years | 274 (52.7%) | 0 (0.0%) |
| 30 to 34 Years | 481 (78.3%) | 20 (4.2%) |
| 35 to 44 Years | 382 (43.4%) | 0 (0.0%) |
| 45 to 54 Years | 790 (61.5%) | 0 (0.0%) |
| 55 to 59 Years | 216 (56.8%) | 1 (0.5%) |
| 60 to 64 Years | 109 (33.4%) | 0 (0.0%) |
| 65 to 74 Years | 162 (30.6%) | 0 (0.0%) |
| 75 Years and over | 46 (8.5%) | 0 (0.0%) |
| Total | 3,017 (46.8%) | 124 (4.1%) |
Employment Status by Educational Attainment in Pikeville
According to labor force statistics for Pikeville, 56.2% of individuals (2,250) out of the total population between 25 and 64 years of age (4,004) are in the labor force, with 0.9% or 20 of them being unemployed. The group with the highest labor force participation rate are those with the educational attainment of bachelor's degree or higher, with 78.4% or 1,341 individuals in the labor force. Within the labor force, individuals with high school diploma education have the highest percentage of unemployment, with 4.9% or 20 of them being unemployed.
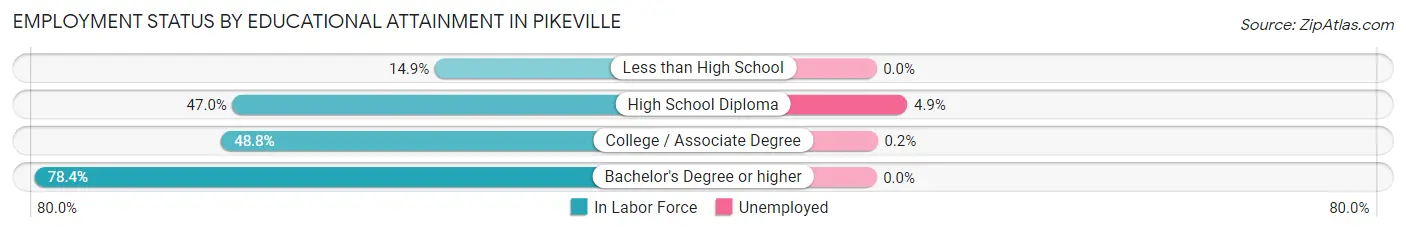
| Educational Attainment | In Labor Force | Unemployed |
| Less than High School | 85 (14.9%) | 0 (0.0%) |
| High School Diploma | 408 (47.0%) | 43 (4.9%) |
| College / Associate Degree | 418 (48.8%) | 2 (0.2%) |
| Bachelor's Degree or higher | 1,341 (78.4%) | 0 (0.0%) |
| Total | 2,250 (56.2%) | 36 (0.9%) |
Employment Occupations by Sex in Pikeville
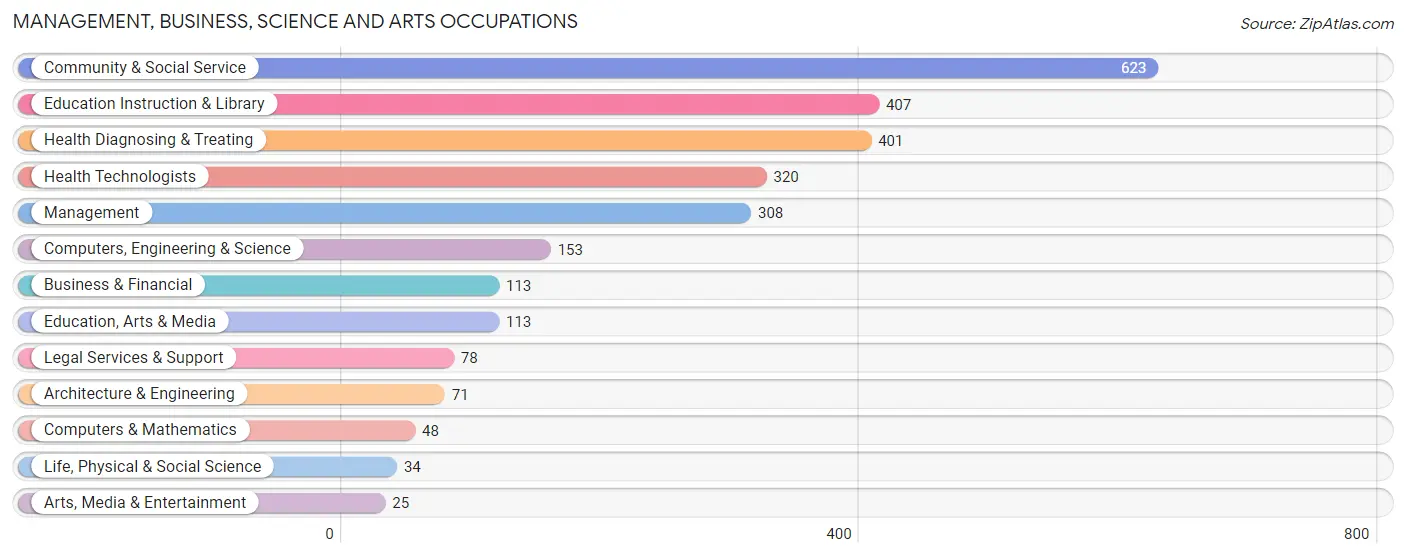
Management, Business, Science and Arts Occupations
The most common Management, Business, Science and Arts occupations in Pikeville are Community & Social Service (623 | 21.5%), Education Instruction & Library (407 | 14.1%), Health Diagnosing & Treating (401 | 13.9%), Health Technologists (320 | 11.1%), and Management (308 | 10.6%).
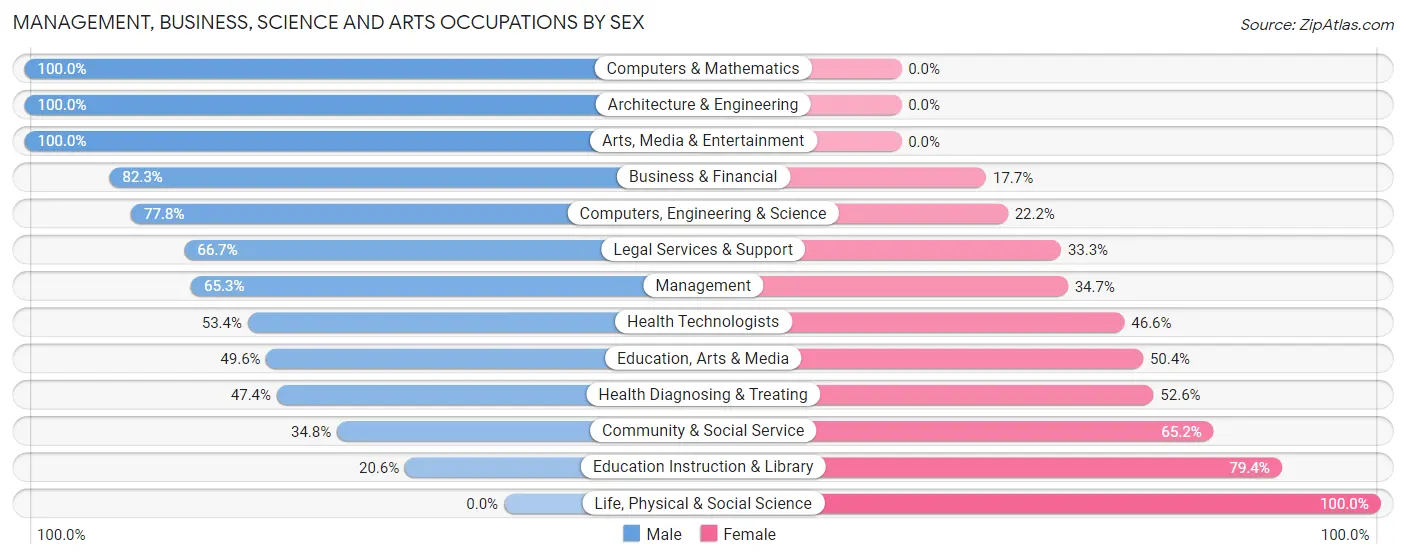
Management, Business, Science and Arts Occupations by Sex
Within the Management, Business, Science and Arts occupations in Pikeville, the most male-oriented occupations are Computers & Mathematics (100.0%), Architecture & Engineering (100.0%), and Arts, Media & Entertainment (100.0%), while the most female-oriented occupations are Life, Physical & Social Science (100.0%), Education Instruction & Library (79.4%), and Community & Social Service (65.2%).
| Occupation | Male | Female |
| Management | 201 (65.3%) | 107 (34.7%) |
| Business & Financial | 93 (82.3%) | 20 (17.7%) |
| Computers, Engineering & Science | 119 (77.8%) | 34 (22.2%) |
| Computers & Mathematics | 48 (100.0%) | 0 (0.0%) |
| Architecture & Engineering | 71 (100.0%) | 0 (0.0%) |
| Life, Physical & Social Science | 0 (0.0%) | 34 (100.0%) |
| Community & Social Service | 217 (34.8%) | 406 (65.2%) |
| Education, Arts & Media | 56 (49.6%) | 57 (50.4%) |
| Legal Services & Support | 52 (66.7%) | 26 (33.3%) |
| Education Instruction & Library | 84 (20.6%) | 323 (79.4%) |
| Arts, Media & Entertainment | 25 (100.0%) | 0 (0.0%) |
| Health Diagnosing & Treating | 190 (47.4%) | 211 (52.6%) |
| Health Technologists | 171 (53.4%) | 149 (46.6%) |
| Total (Category) | 820 (51.3%) | 778 (48.7%) |
| Total (Overall) | 1,503 (51.9%) | 1,390 (48.0%) |
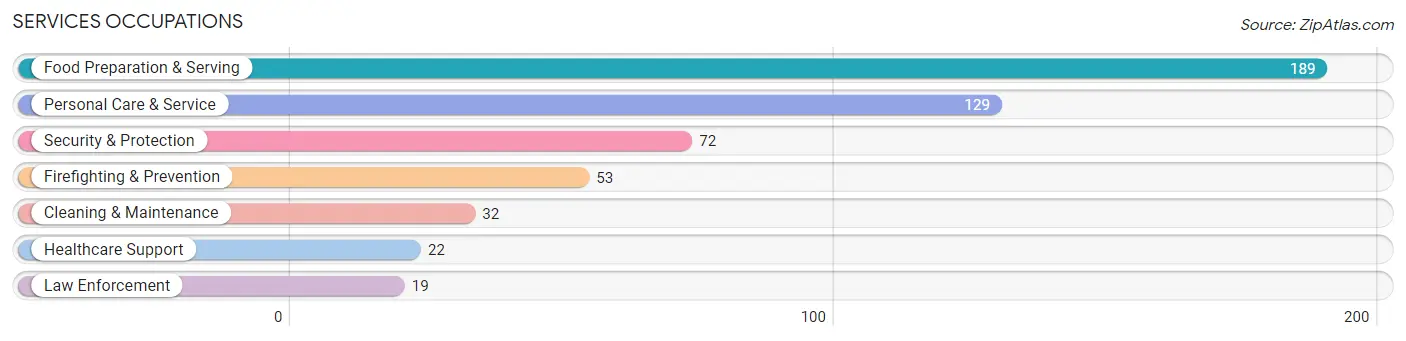
Services Occupations
The most common Services occupations in Pikeville are Food Preparation & Serving (189 | 6.5%), Personal Care & Service (129 | 4.5%), Security & Protection (72 | 2.5%), Firefighting & Prevention (53 | 1.8%), and Cleaning & Maintenance (32 | 1.1%).
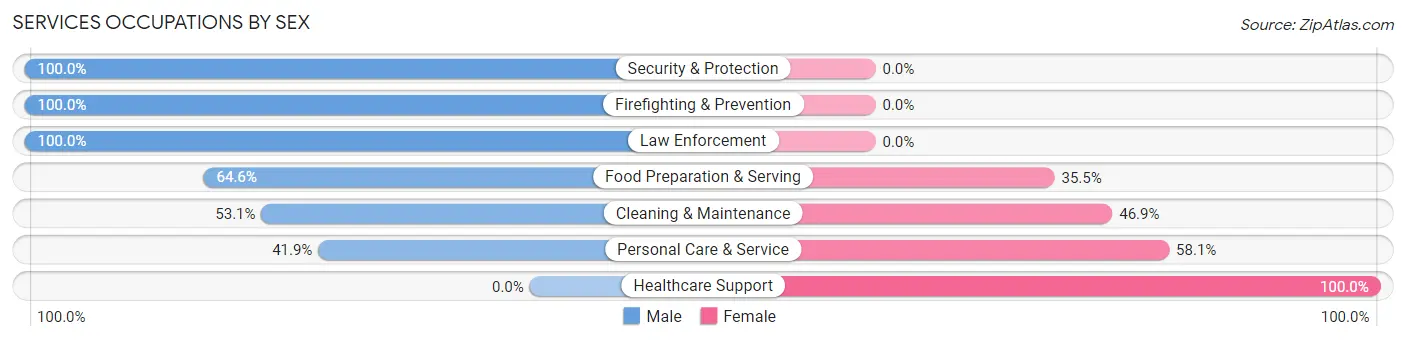
Services Occupations by Sex
Within the Services occupations in Pikeville, the most male-oriented occupations are Security & Protection (100.0%), Firefighting & Prevention (100.0%), and Law Enforcement (100.0%), while the most female-oriented occupations are Healthcare Support (100.0%), Personal Care & Service (58.1%), and Cleaning & Maintenance (46.9%).
| Occupation | Male | Female |
| Healthcare Support | 0 (0.0%) | 22 (100.0%) |
| Security & Protection | 72 (100.0%) | 0 (0.0%) |
| Firefighting & Prevention | 53 (100.0%) | 0 (0.0%) |
| Law Enforcement | 19 (100.0%) | 0 (0.0%) |
| Food Preparation & Serving | 122 (64.5%) | 67 (35.4%) |
| Cleaning & Maintenance | 17 (53.1%) | 15 (46.9%) |
| Personal Care & Service | 54 (41.9%) | 75 (58.1%) |
| Total (Category) | 265 (59.7%) | 179 (40.3%) |
| Total (Overall) | 1,503 (51.9%) | 1,390 (48.0%) |
Sales and Office Occupations
The most common Sales and Office occupations in Pikeville are Office & Administration (358 | 12.4%), and Sales & Related (137 | 4.7%).

Sales and Office Occupations by Sex

| Occupation | Male | Female |
| Sales & Related | 46 (33.6%) | 91 (66.4%) |
| Office & Administration | 49 (13.7%) | 309 (86.3%) |
| Total (Category) | 95 (19.2%) | 400 (80.8%) |
| Total (Overall) | 1,503 (51.9%) | 1,390 (48.0%) |
Natural Resources, Construction and Maintenance Occupations
The most common Natural Resources, Construction and Maintenance occupations in Pikeville are Installation, Maintenance & Repair (51 | 1.8%), and Construction & Extraction (48 | 1.7%).

Natural Resources, Construction and Maintenance Occupations by Sex

| Occupation | Male | Female |
| Farming, Fishing & Forestry | 0 (0.0%) | 0 (0.0%) |
| Construction & Extraction | 48 (100.0%) | 0 (0.0%) |
| Installation, Maintenance & Repair | 51 (100.0%) | 0 (0.0%) |
| Total (Category) | 99 (100.0%) | 0 (0.0%) |
| Total (Overall) | 1,503 (51.9%) | 1,390 (48.0%) |
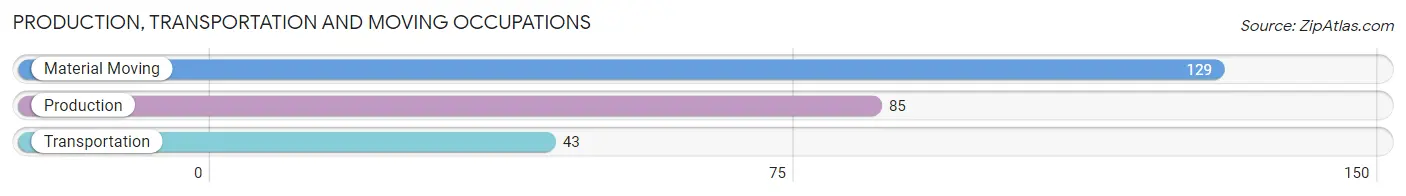
Production, Transportation and Moving Occupations
The most common Production, Transportation and Moving occupations in Pikeville are Material Moving (129 | 4.5%), Production (85 | 2.9%), and Transportation (43 | 1.5%).
Production, Transportation and Moving Occupations by Sex
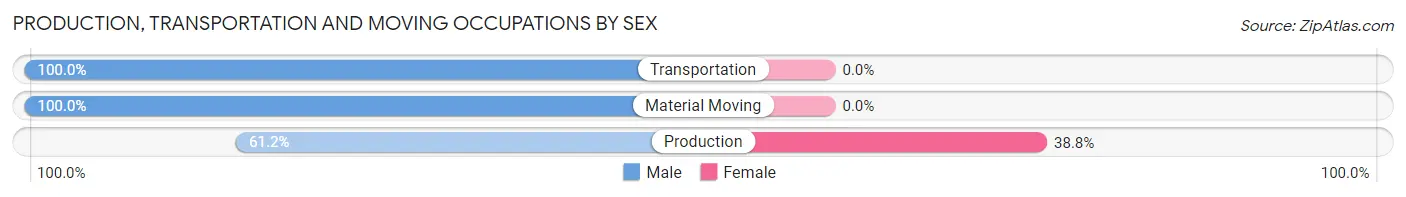
| Occupation | Male | Female |
| Production | 52 (61.2%) | 33 (38.8%) |
| Transportation | 43 (100.0%) | 0 (0.0%) |
| Material Moving | 129 (100.0%) | 0 (0.0%) |
| Total (Category) | 224 (87.2%) | 33 (12.8%) |
| Total (Overall) | 1,503 (51.9%) | 1,390 (48.0%) |
Employment Industries by Sex in Pikeville
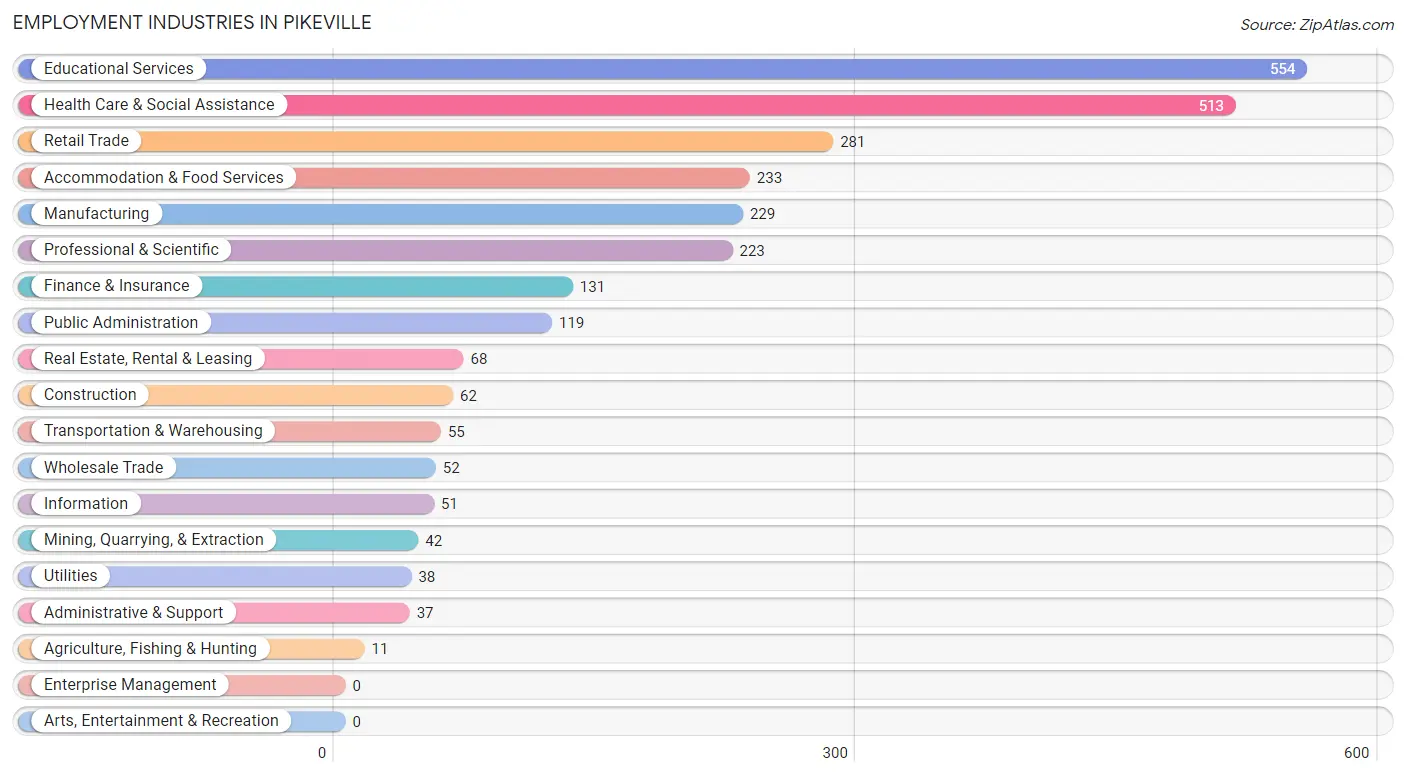
Employment Industries in Pikeville
The major employment industries in Pikeville include Educational Services (554 | 19.2%), Health Care & Social Assistance (513 | 17.7%), Retail Trade (281 | 9.7%), Accommodation & Food Services (233 | 8.1%), and Manufacturing (229 | 7.9%).
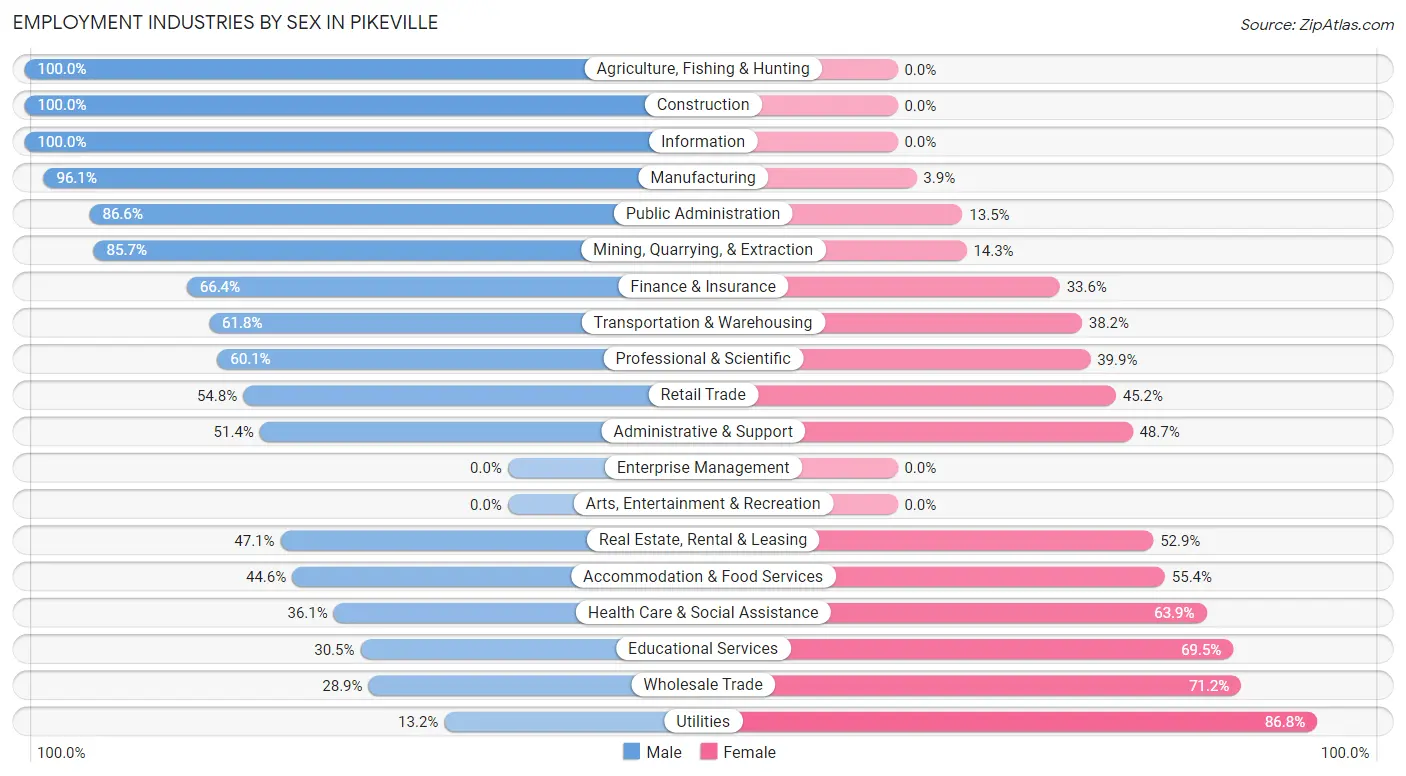
Employment Industries by Sex in Pikeville
The Pikeville industries that see more men than women are Agriculture, Fishing & Hunting (100.0%), Construction (100.0%), and Information (100.0%), whereas the industries that tend to have a higher number of women are Utilities (86.8%), Wholesale Trade (71.2%), and Educational Services (69.5%).
| Industry | Male | Female |
| Agriculture, Fishing & Hunting | 11 (100.0%) | 0 (0.0%) |
| Mining, Quarrying, & Extraction | 36 (85.7%) | 6 (14.3%) |
| Construction | 62 (100.0%) | 0 (0.0%) |
| Manufacturing | 220 (96.1%) | 9 (3.9%) |
| Wholesale Trade | 15 (28.8%) | 37 (71.2%) |
| Retail Trade | 154 (54.8%) | 127 (45.2%) |
| Transportation & Warehousing | 34 (61.8%) | 21 (38.2%) |
| Utilities | 5 (13.2%) | 33 (86.8%) |
| Information | 51 (100.0%) | 0 (0.0%) |
| Finance & Insurance | 87 (66.4%) | 44 (33.6%) |
| Real Estate, Rental & Leasing | 32 (47.1%) | 36 (52.9%) |
| Professional & Scientific | 134 (60.1%) | 89 (39.9%) |
| Enterprise Management | 0 (0.0%) | 0 (0.0%) |
| Administrative & Support | 19 (51.3%) | 18 (48.6%) |
| Educational Services | 169 (30.5%) | 385 (69.5%) |
| Health Care & Social Assistance | 185 (36.1%) | 328 (63.9%) |
| Arts, Entertainment & Recreation | 0 (0.0%) | 0 (0.0%) |
| Accommodation & Food Services | 104 (44.6%) | 129 (55.4%) |
| Public Administration | 103 (86.6%) | 16 (13.5%) |
| Total | 1,503 (51.9%) | 1,390 (48.0%) |
Education in Pikeville
School Enrollment in Pikeville
The most common levels of schooling among the 2,112 students in Pikeville are college / undergraduate (711 | 33.7%), middle school (430 | 20.4%), and graduate / professional (427 | 20.2%).
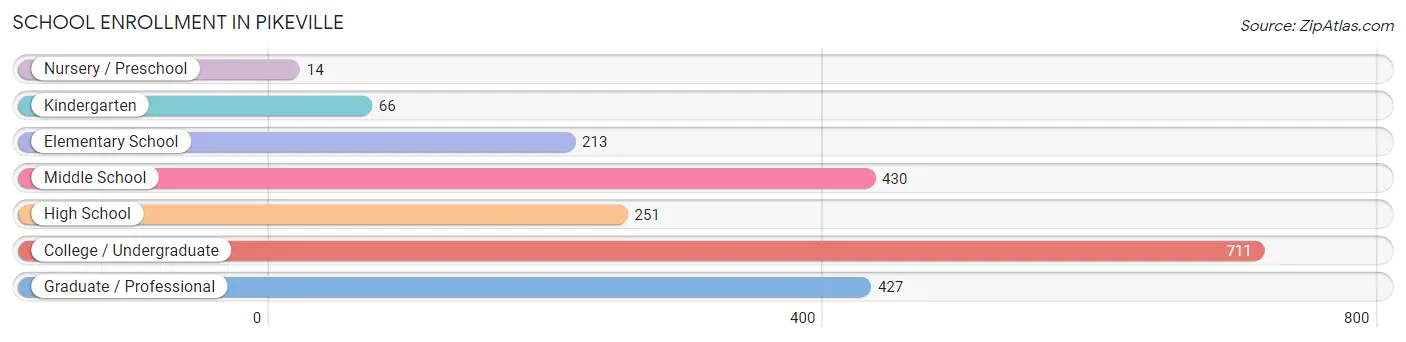
| School Level | # Students | % Students |
| Nursery / Preschool | 14 | 0.7% |
| Kindergarten | 66 | 3.1% |
| Elementary School | 213 | 10.1% |
| Middle School | 430 | 20.4% |
| High School | 251 | 11.9% |
| College / Undergraduate | 711 | 33.7% |
| Graduate / Professional | 427 | 20.2% |
| Total | 2,112 | 100.0% |
School Enrollment by Age by Funding Source in Pikeville
Out of a total of 2,112 students who are enrolled in schools in Pikeville, 653 (30.9%) attend a private institution, while the remaining 1,459 (69.1%) are enrolled in public schools. The age group of 35 years and over has the highest likelihood of being enrolled in private schools, with 109 (59.9% in the age bracket) enrolled. Conversely, the age group of 15 to 17 year olds has the lowest likelihood of being enrolled in a private school, with 182 (91.5% in the age bracket) attending a public institution.
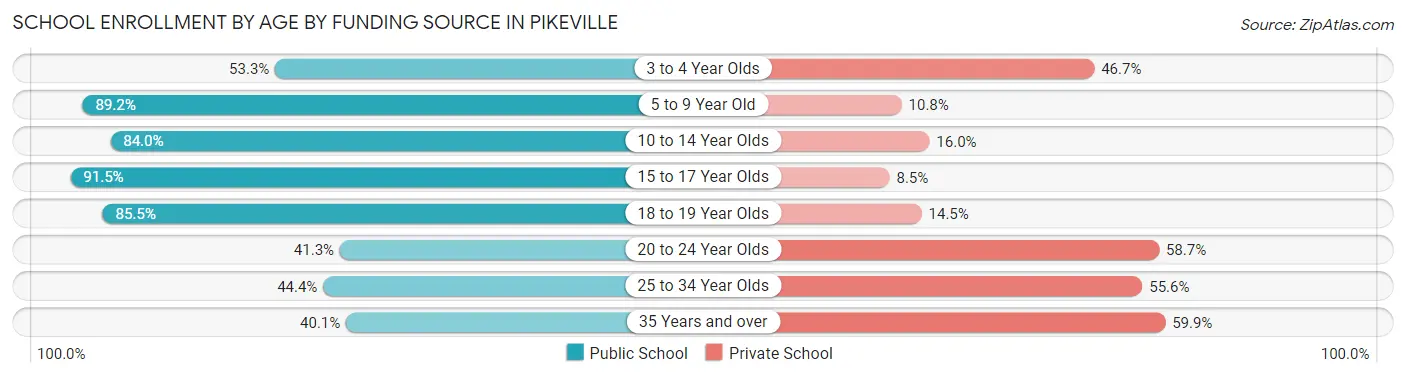
| Age Bracket | Public School | Private School |
| 3 to 4 Year Olds | 16 (53.3%) | 14 (46.7%) |
| 5 to 9 Year Old | 215 (89.2%) | 26 (10.8%) |
| 10 to 14 Year Olds | 400 (84.0%) | 76 (16.0%) |
| 15 to 17 Year Olds | 182 (91.5%) | 17 (8.5%) |
| 18 to 19 Year Olds | 312 (85.5%) | 53 (14.5%) |
| 20 to 24 Year Olds | 182 (41.3%) | 259 (58.7%) |
| 25 to 34 Year Olds | 79 (44.4%) | 99 (55.6%) |
| 35 Years and over | 73 (40.1%) | 109 (59.9%) |
| Total | 1,459 (69.1%) | 653 (30.9%) |
Educational Attainment by Field of Study in Pikeville
Education (495 | 23.0%), business (377 | 17.5%), bio, nature & agricultural (260 | 12.1%), arts & humanities (209 | 9.7%), and science & technology (195 | 9.1%) are the most common fields of study among 2,150 individuals in Pikeville who have obtained a bachelor's degree or higher.
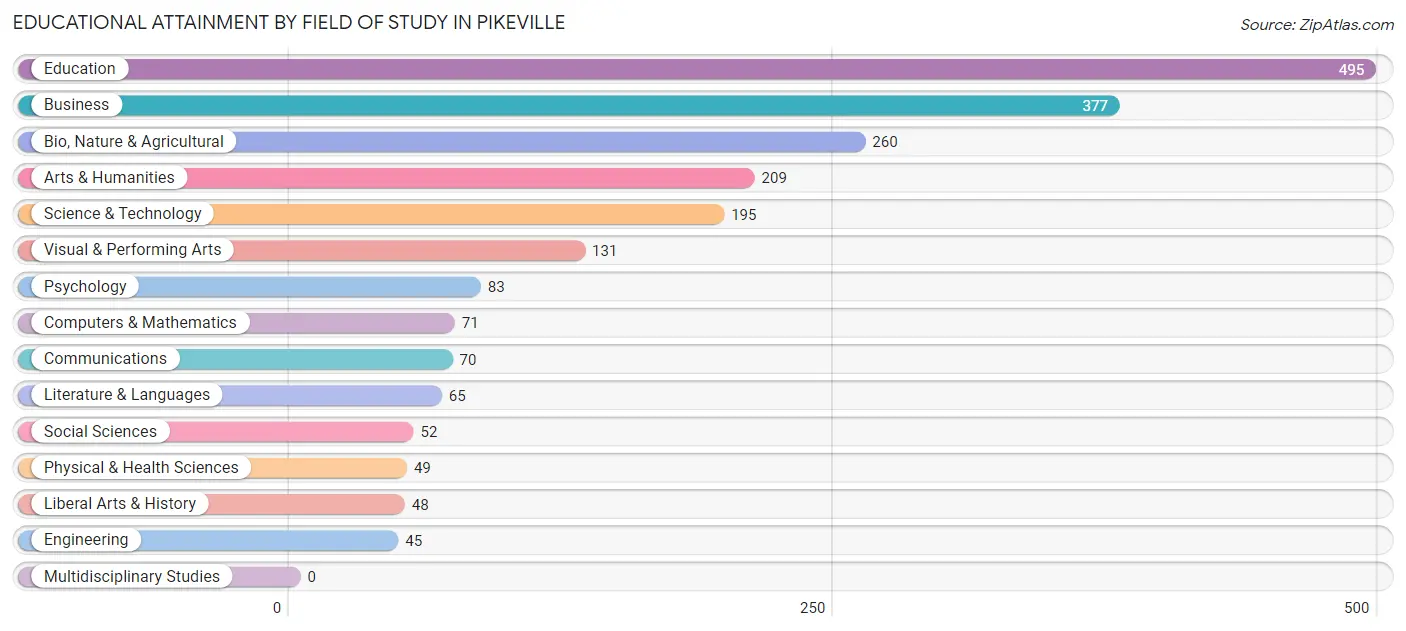
| Field of Study | # Graduates | % Graduates |
| Computers & Mathematics | 71 | 3.3% |
| Bio, Nature & Agricultural | 260 | 12.1% |
| Physical & Health Sciences | 49 | 2.3% |
| Psychology | 83 | 3.9% |
| Social Sciences | 52 | 2.4% |
| Engineering | 45 | 2.1% |
| Multidisciplinary Studies | 0 | 0.0% |
| Science & Technology | 195 | 9.1% |
| Business | 377 | 17.5% |
| Education | 495 | 23.0% |
| Literature & Languages | 65 | 3.0% |
| Liberal Arts & History | 48 | 2.2% |
| Visual & Performing Arts | 131 | 6.1% |
| Communications | 70 | 3.3% |
| Arts & Humanities | 209 | 9.7% |
| Total | 2,150 | 100.0% |
Transportation & Commute in Pikeville
Vehicle Availability by Sex in Pikeville
The most prevalent vehicle ownership categories in Pikeville are males with 2 vehicles (739, accounting for 53.8%) and females with 2 vehicles (680, making up 57.5%).
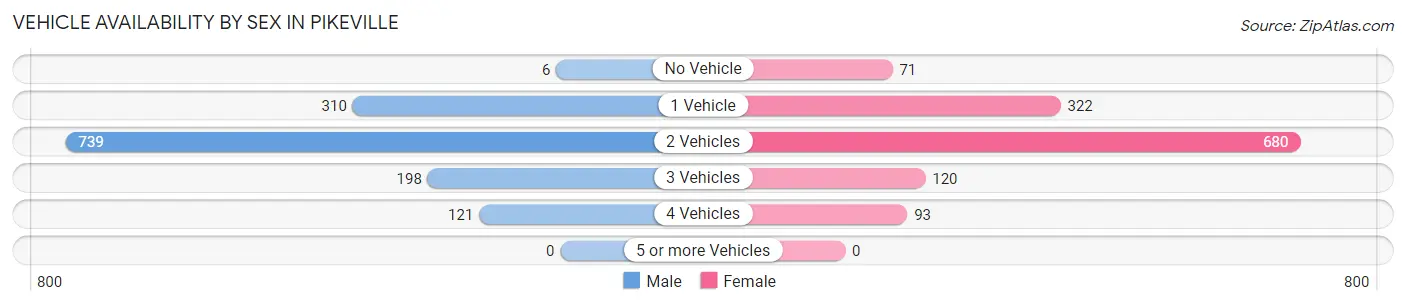
| Vehicles Available | Male | Female |
| No Vehicle | 6 (0.4%) | 71 (5.5%) |
| 1 Vehicle | 310 (22.6%) | 322 (25.0%) |
| 2 Vehicles | 739 (53.8%) | 680 (52.9%) |
| 3 Vehicles | 198 (14.4%) | 120 (9.3%) |
| 4 Vehicles | 121 (8.8%) | 93 (7.2%) |
| 5 or more Vehicles | 0 (0.0%) | 0 (0.0%) |
| Total | 1,374 (100.0%) | 1,286 (100.0%) |
Commute Time in Pikeville
The most frequently occuring commute durations in Pikeville are 5 to 9 minutes (949 commuters, 36.5%), 10 to 14 minutes (454 commuters, 17.5%), and 15 to 19 minutes (327 commuters, 12.6%).
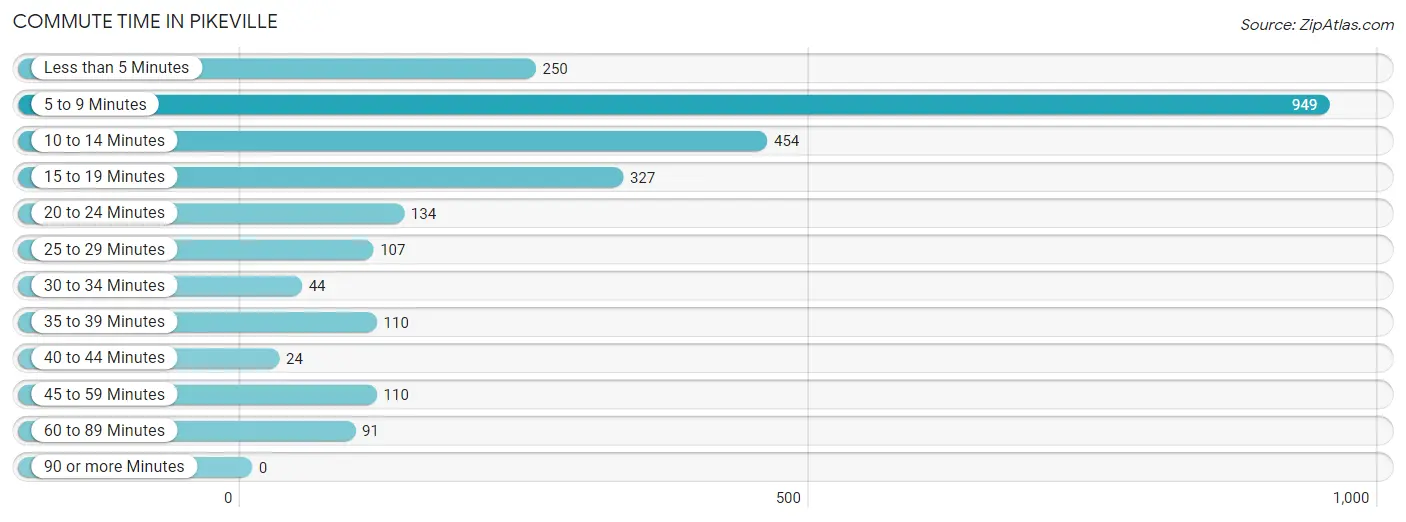
| Commute Time | # Commuters | % Commuters |
| Less than 5 Minutes | 250 | 9.6% |
| 5 to 9 Minutes | 949 | 36.5% |
| 10 to 14 Minutes | 454 | 17.5% |
| 15 to 19 Minutes | 327 | 12.6% |
| 20 to 24 Minutes | 134 | 5.1% |
| 25 to 29 Minutes | 107 | 4.1% |
| 30 to 34 Minutes | 44 | 1.7% |
| 35 to 39 Minutes | 110 | 4.2% |
| 40 to 44 Minutes | 24 | 0.9% |
| 45 to 59 Minutes | 110 | 4.2% |
| 60 to 89 Minutes | 91 | 3.5% |
| 90 or more Minutes | 0 | 0.0% |
Commute Time by Sex in Pikeville
The most common commute times in Pikeville are 5 to 9 minutes (584 commuters, 40.1%) for males and 5 to 9 minutes (365 commuters, 32.0%) for females.
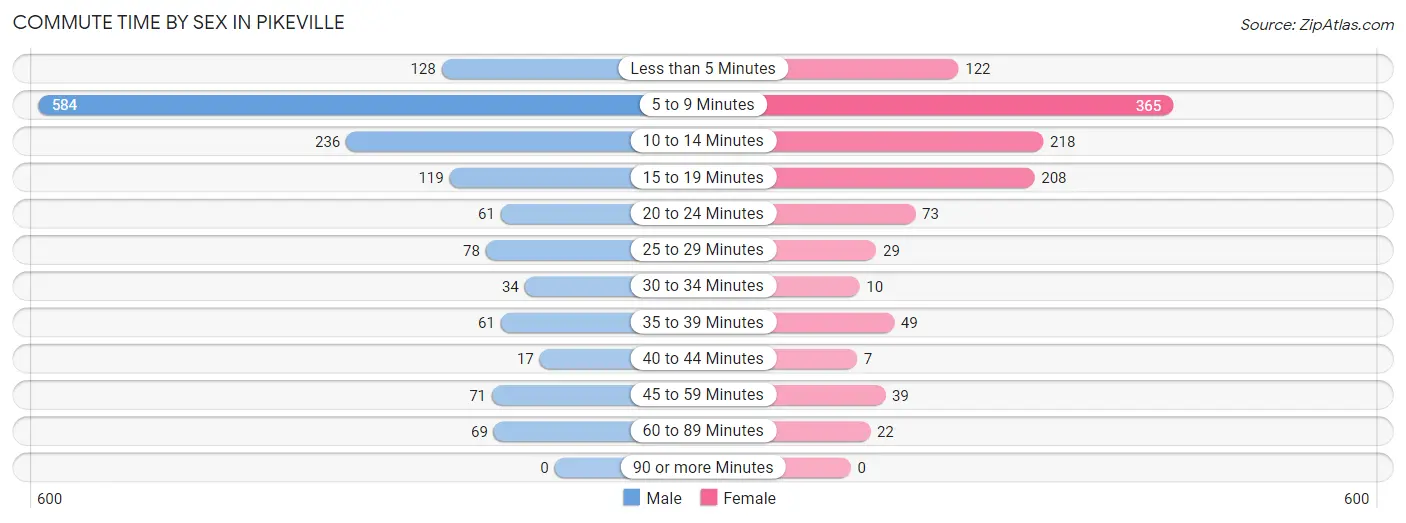
| Commute Time | Male | Female |
| Less than 5 Minutes | 128 (8.8%) | 122 (10.7%) |
| 5 to 9 Minutes | 584 (40.1%) | 365 (32.0%) |
| 10 to 14 Minutes | 236 (16.2%) | 218 (19.1%) |
| 15 to 19 Minutes | 119 (8.2%) | 208 (18.2%) |
| 20 to 24 Minutes | 61 (4.2%) | 73 (6.4%) |
| 25 to 29 Minutes | 78 (5.3%) | 29 (2.5%) |
| 30 to 34 Minutes | 34 (2.3%) | 10 (0.9%) |
| 35 to 39 Minutes | 61 (4.2%) | 49 (4.3%) |
| 40 to 44 Minutes | 17 (1.2%) | 7 (0.6%) |
| 45 to 59 Minutes | 71 (4.9%) | 39 (3.4%) |
| 60 to 89 Minutes | 69 (4.7%) | 22 (1.9%) |
| 90 or more Minutes | 0 (0.0%) | 0 (0.0%) |
Time of Departure to Work by Sex in Pikeville
The most frequent times of departure to work in Pikeville are 8:00 AM to 8:29 AM (298, 20.4%) for males and 8:00 AM to 8:29 AM (307, 26.9%) for females.
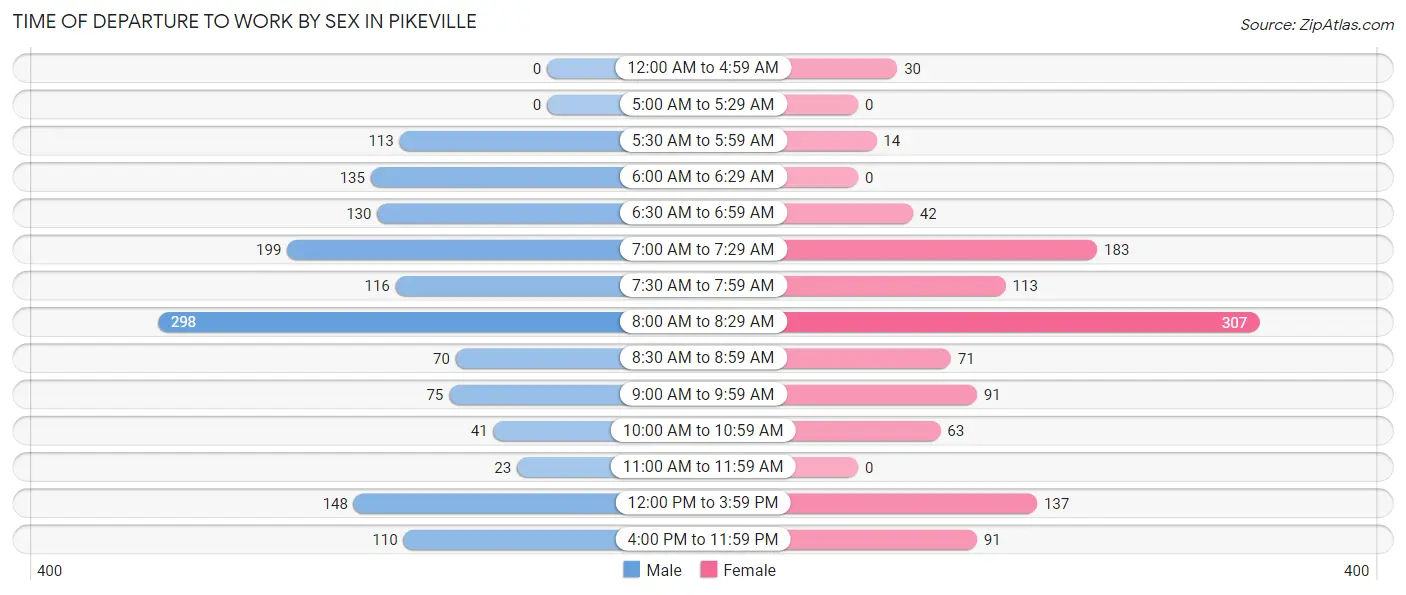
| Time of Departure | Male | Female |
| 12:00 AM to 4:59 AM | 0 (0.0%) | 30 (2.6%) |
| 5:00 AM to 5:29 AM | 0 (0.0%) | 0 (0.0%) |
| 5:30 AM to 5:59 AM | 113 (7.7%) | 14 (1.2%) |
| 6:00 AM to 6:29 AM | 135 (9.3%) | 0 (0.0%) |
| 6:30 AM to 6:59 AM | 130 (8.9%) | 42 (3.7%) |
| 7:00 AM to 7:29 AM | 199 (13.7%) | 183 (16.0%) |
| 7:30 AM to 7:59 AM | 116 (8.0%) | 113 (9.9%) |
| 8:00 AM to 8:29 AM | 298 (20.4%) | 307 (26.9%) |
| 8:30 AM to 8:59 AM | 70 (4.8%) | 71 (6.2%) |
| 9:00 AM to 9:59 AM | 75 (5.1%) | 91 (8.0%) |
| 10:00 AM to 10:59 AM | 41 (2.8%) | 63 (5.5%) |
| 11:00 AM to 11:59 AM | 23 (1.6%) | 0 (0.0%) |
| 12:00 PM to 3:59 PM | 148 (10.2%) | 137 (12.0%) |
| 4:00 PM to 11:59 PM | 110 (7.5%) | 91 (8.0%) |
| Total | 1,458 (100.0%) | 1,142 (100.0%) |
Housing Occupancy in Pikeville
Occupancy by Ownership in Pikeville
Of the total 3,078 dwellings in Pikeville, owner-occupied units account for 1,214 (39.4%), while renter-occupied units make up 1,864 (60.6%).
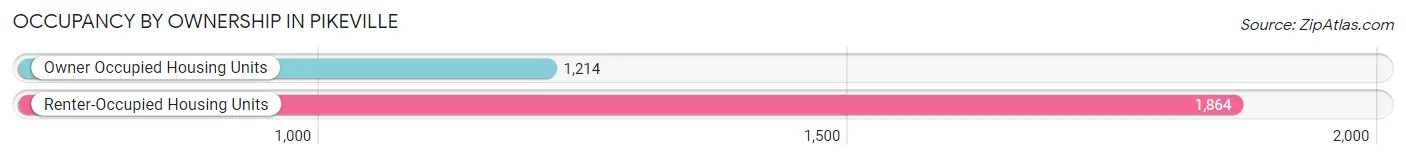
| Occupancy | # Housing Units | % Housing Units |
| Owner Occupied Housing Units | 1,214 | 39.4% |
| Renter-Occupied Housing Units | 1,864 | 60.6% |
| Total Occupied Housing Units | 3,078 | 100.0% |
Occupancy by Household Size in Pikeville
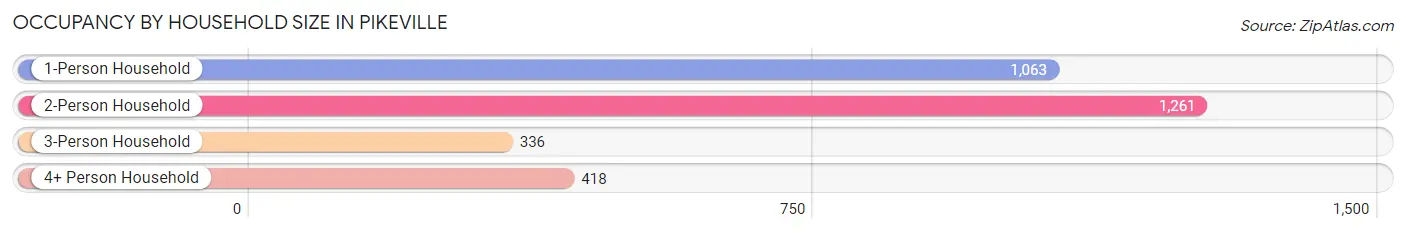
| Household Size | # Housing Units | % Housing Units |
| 1-Person Household | 1,063 | 34.5% |
| 2-Person Household | 1,261 | 41.0% |
| 3-Person Household | 336 | 10.9% |
| 4+ Person Household | 418 | 13.6% |
| Total Housing Units | 3,078 | 100.0% |
Occupancy by Ownership by Household Size in Pikeville
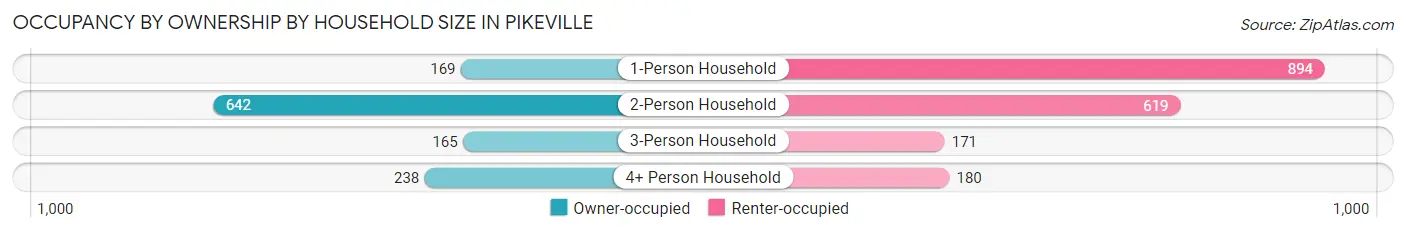
| Household Size | Owner-occupied | Renter-occupied |
| 1-Person Household | 169 (15.9%) | 894 (84.1%) |
| 2-Person Household | 642 (50.9%) | 619 (49.1%) |
| 3-Person Household | 165 (49.1%) | 171 (50.9%) |
| 4+ Person Household | 238 (56.9%) | 180 (43.1%) |
| Total Housing Units | 1,214 (39.4%) | 1,864 (60.6%) |
Occupancy by Educational Attainment in Pikeville
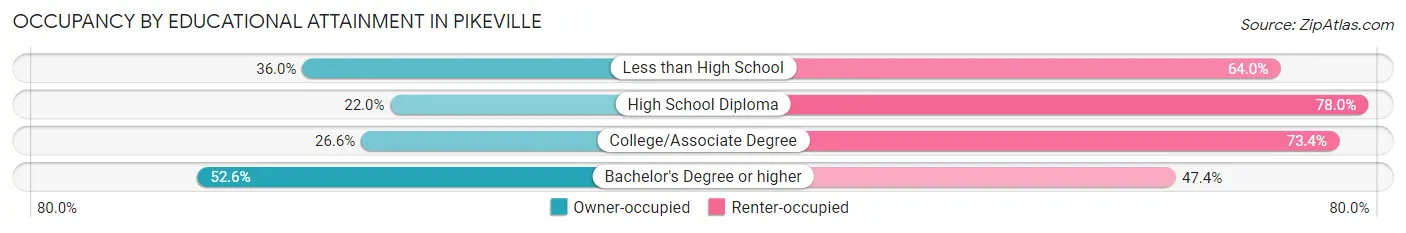
| Household Size | Owner-occupied | Renter-occupied |
| Less than High School | 196 (36.0%) | 349 (64.0%) |
| High School Diploma | 123 (22.0%) | 436 (78.0%) |
| College/Associate Degree | 147 (26.6%) | 405 (73.4%) |
| Bachelor's Degree or higher | 748 (52.6%) | 674 (47.4%) |
Occupancy by Age of Householder in Pikeville
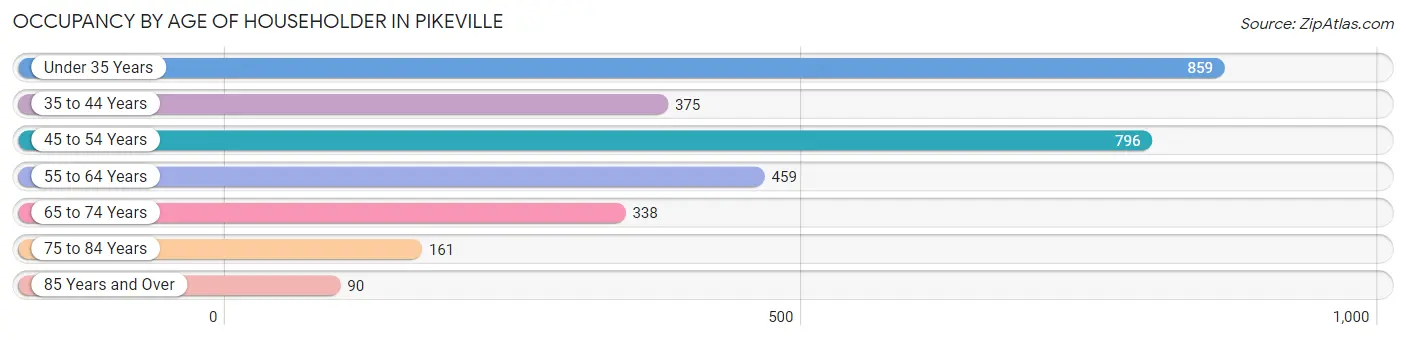
| Age Bracket | # Households | % Households |
| Under 35 Years | 859 | 27.9% |
| 35 to 44 Years | 375 | 12.2% |
| 45 to 54 Years | 796 | 25.9% |
| 55 to 64 Years | 459 | 14.9% |
| 65 to 74 Years | 338 | 11.0% |
| 75 to 84 Years | 161 | 5.2% |
| 85 Years and Over | 90 | 2.9% |
| Total | 3,078 | 100.0% |
Housing Finances in Pikeville
Median Income by Occupancy in Pikeville
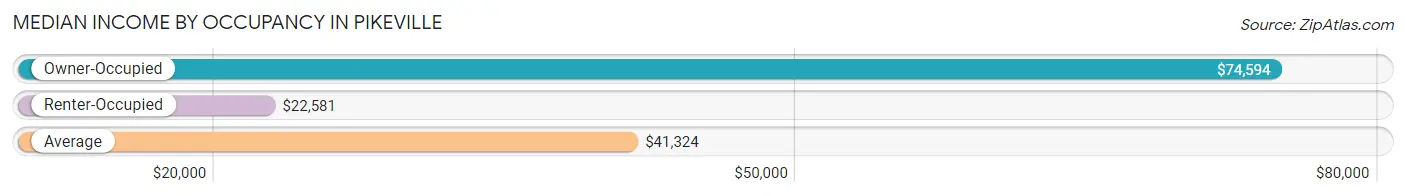
| Occupancy Type | # Households | Median Income |
| Owner-Occupied | 1,214 (39.4%) | $74,594 |
| Renter-Occupied | 1,864 (60.6%) | $22,581 |
| Average | 3,078 (100.0%) | $41,324 |
Occupancy by Householder Income Bracket in Pikeville
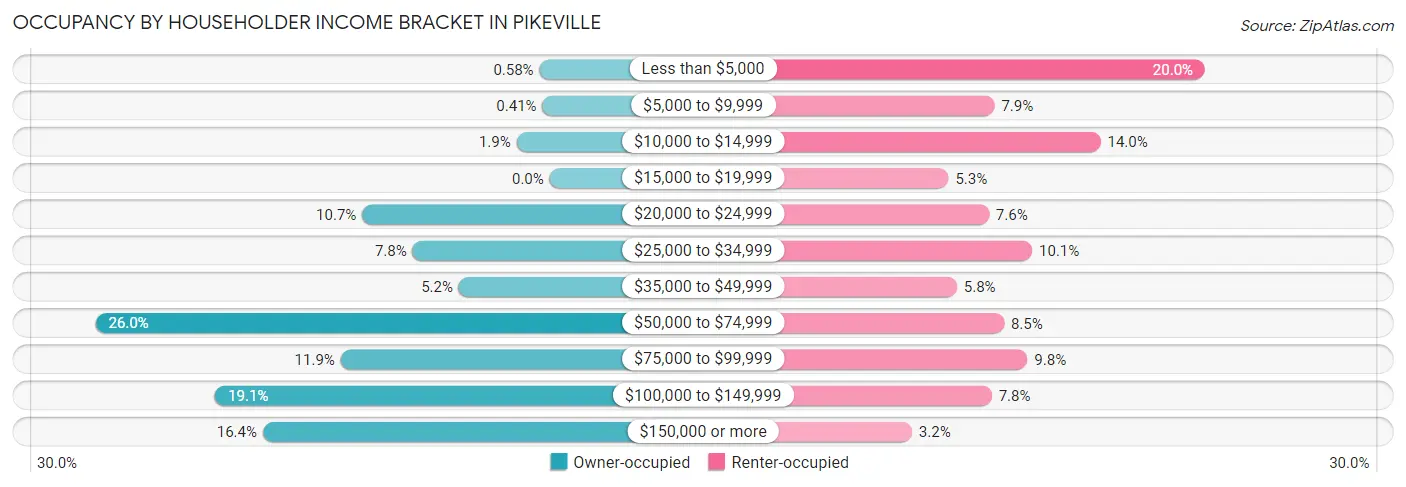
| Income Bracket | Owner-occupied | Renter-occupied |
| Less than $5,000 | 7 (0.6%) | 372 (20.0%) |
| $5,000 to $9,999 | 5 (0.4%) | 148 (7.9%) |
| $10,000 to $14,999 | 23 (1.9%) | 261 (14.0%) |
| $15,000 to $19,999 | 0 (0.0%) | 99 (5.3%) |
| $20,000 to $24,999 | 130 (10.7%) | 142 (7.6%) |
| $25,000 to $34,999 | 95 (7.8%) | 188 (10.1%) |
| $35,000 to $49,999 | 63 (5.2%) | 108 (5.8%) |
| $50,000 to $74,999 | 315 (26.0%) | 158 (8.5%) |
| $75,000 to $99,999 | 145 (11.9%) | 183 (9.8%) |
| $100,000 to $149,999 | 232 (19.1%) | 145 (7.8%) |
| $150,000 or more | 199 (16.4%) | 60 (3.2%) |
| Total | 1,214 (100.0%) | 1,864 (100.0%) |
Monthly Housing Cost Tiers in Pikeville
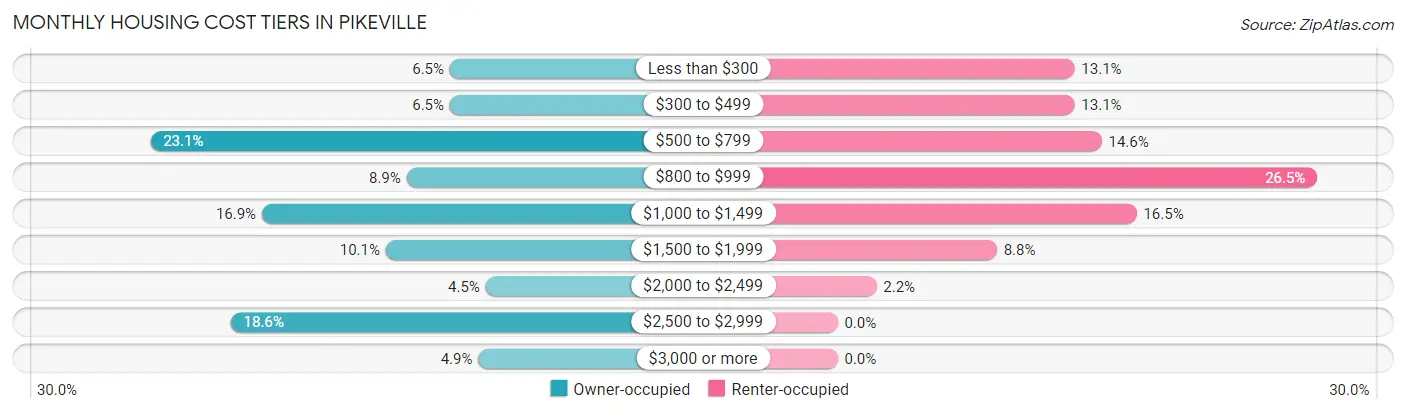
| Monthly Cost | Owner-occupied | Renter-occupied |
| Less than $300 | 79 (6.5%) | 244 (13.1%) |
| $300 to $499 | 79 (6.5%) | 244 (13.1%) |
| $500 to $799 | 280 (23.1%) | 272 (14.6%) |
| $800 to $999 | 108 (8.9%) | 494 (26.5%) |
| $1,000 to $1,499 | 205 (16.9%) | 308 (16.5%) |
| $1,500 to $1,999 | 122 (10.1%) | 164 (8.8%) |
| $2,000 to $2,499 | 55 (4.5%) | 40 (2.1%) |
| $2,500 to $2,999 | 226 (18.6%) | 0 (0.0%) |
| $3,000 or more | 60 (4.9%) | 0 (0.0%) |
| Total | 1,214 (100.0%) | 1,864 (100.0%) |
Physical Housing Characteristics in Pikeville
Housing Structures in Pikeville
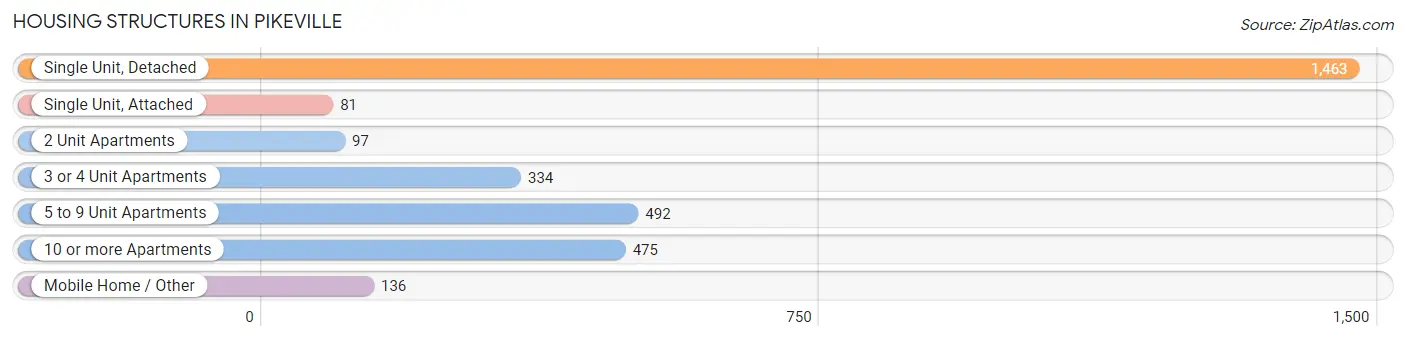
| Structure Type | # Housing Units | % Housing Units |
| Single Unit, Detached | 1,463 | 47.5% |
| Single Unit, Attached | 81 | 2.6% |
| 2 Unit Apartments | 97 | 3.2% |
| 3 or 4 Unit Apartments | 334 | 10.8% |
| 5 to 9 Unit Apartments | 492 | 16.0% |
| 10 or more Apartments | 475 | 15.4% |
| Mobile Home / Other | 136 | 4.4% |
| Total | 3,078 | 100.0% |
Housing Structures by Occupancy in Pikeville
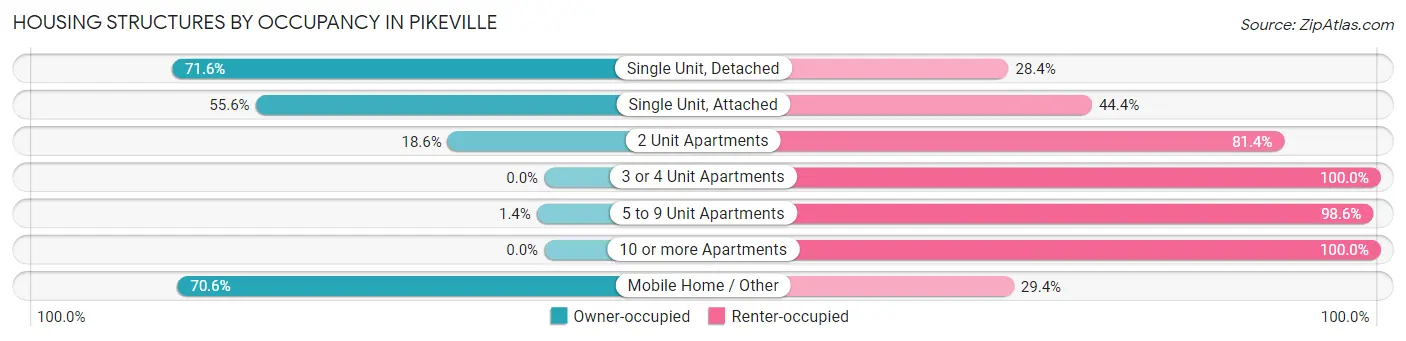
| Structure Type | Owner-occupied | Renter-occupied |
| Single Unit, Detached | 1,048 (71.6%) | 415 (28.4%) |
| Single Unit, Attached | 45 (55.6%) | 36 (44.4%) |
| 2 Unit Apartments | 18 (18.6%) | 79 (81.4%) |
| 3 or 4 Unit Apartments | 0 (0.0%) | 334 (100.0%) |
| 5 to 9 Unit Apartments | 7 (1.4%) | 485 (98.6%) |
| 10 or more Apartments | 0 (0.0%) | 475 (100.0%) |
| Mobile Home / Other | 96 (70.6%) | 40 (29.4%) |
| Total | 1,214 (39.4%) | 1,864 (60.6%) |
Housing Structures by Number of Rooms in Pikeville
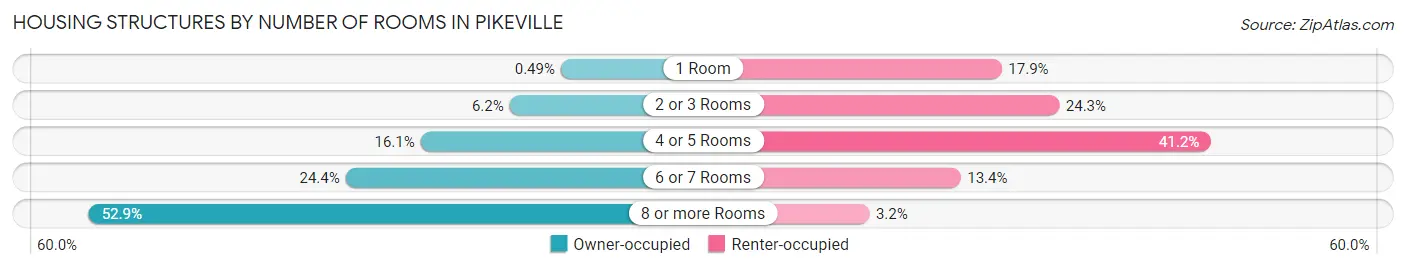
| Number of Rooms | Owner-occupied | Renter-occupied |
| 1 Room | 6 (0.5%) | 334 (17.9%) |
| 2 or 3 Rooms | 75 (6.2%) | 453 (24.3%) |
| 4 or 5 Rooms | 195 (16.1%) | 768 (41.2%) |
| 6 or 7 Rooms | 296 (24.4%) | 249 (13.4%) |
| 8 or more Rooms | 642 (52.9%) | 60 (3.2%) |
| Total | 1,214 (100.0%) | 1,864 (100.0%) |
Housing Structure by Heating Type in Pikeville
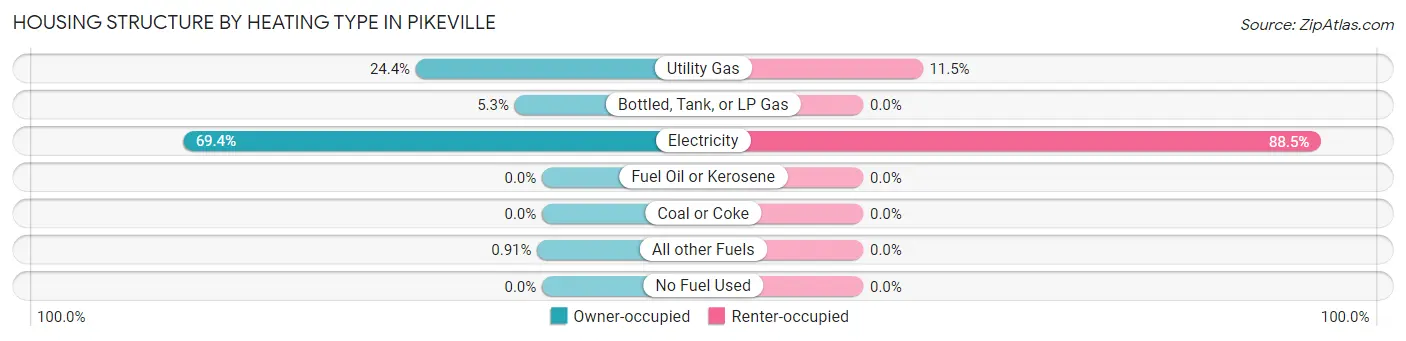
| Heating Type | Owner-occupied | Renter-occupied |
| Utility Gas | 296 (24.4%) | 214 (11.5%) |
| Bottled, Tank, or LP Gas | 64 (5.3%) | 0 (0.0%) |
| Electricity | 843 (69.4%) | 1,650 (88.5%) |
| Fuel Oil or Kerosene | 0 (0.0%) | 0 (0.0%) |
| Coal or Coke | 0 (0.0%) | 0 (0.0%) |
| All other Fuels | 11 (0.9%) | 0 (0.0%) |
| No Fuel Used | 0 (0.0%) | 0 (0.0%) |
| Total | 1,214 (100.0%) | 1,864 (100.0%) |
Household Vehicle Usage in Pikeville
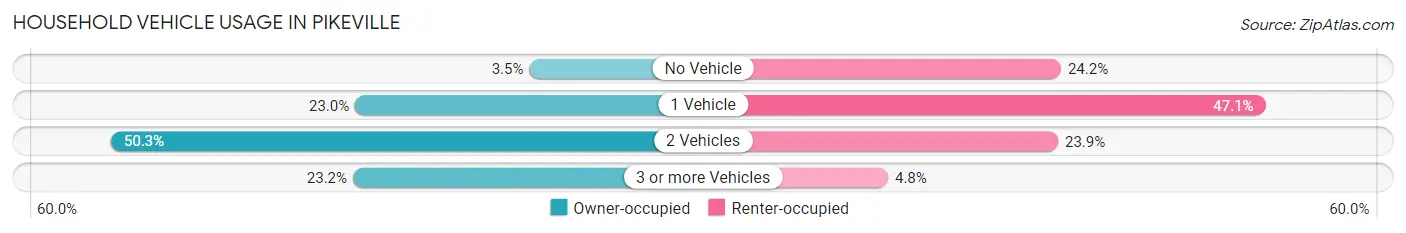
| Vehicles per Household | Owner-occupied | Renter-occupied |
| No Vehicle | 42 (3.5%) | 451 (24.2%) |
| 1 Vehicle | 279 (23.0%) | 878 (47.1%) |
| 2 Vehicles | 611 (50.3%) | 445 (23.9%) |
| 3 or more Vehicles | 282 (23.2%) | 90 (4.8%) |
| Total | 1,214 (100.0%) | 1,864 (100.0%) |
Real Estate & Mortgages in Pikeville
Real Estate and Mortgage Overview in Pikeville
| Characteristic | Without Mortgage | With Mortgage |
| Housing Units | 512 | 702 |
| Median Property Value | $192,800 | $392,700 |
| Median Household Income | $43,056 | $157 |
| Monthly Housing Costs | $553 | $53 |
| Real Estate Taxes | $1,106 | $18 |
Property Value by Mortgage Status in Pikeville
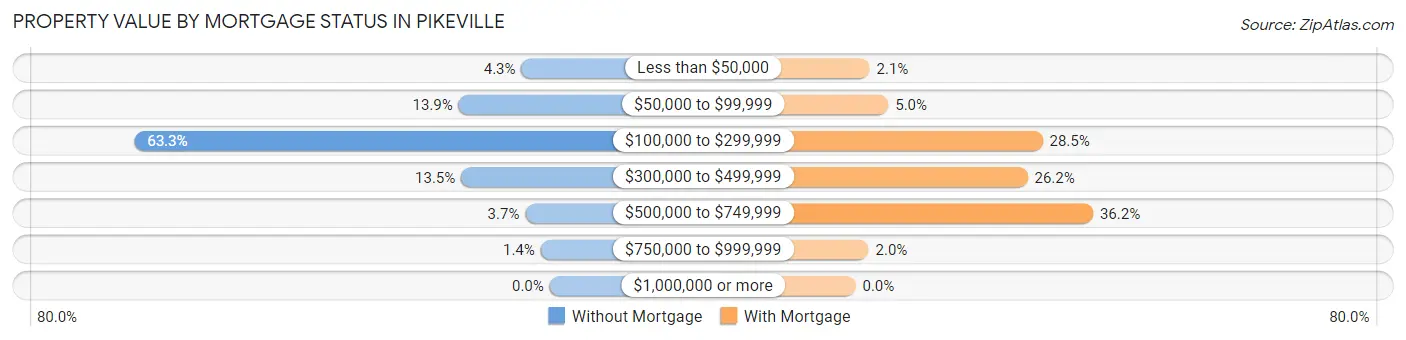
| Property Value | Without Mortgage | With Mortgage |
| Less than $50,000 | 22 (4.3%) | 15 (2.1%) |
| $50,000 to $99,999 | 71 (13.9%) | 35 (5.0%) |
| $100,000 to $299,999 | 324 (63.3%) | 200 (28.5%) |
| $300,000 to $499,999 | 69 (13.5%) | 184 (26.2%) |
| $500,000 to $749,999 | 19 (3.7%) | 254 (36.2%) |
| $750,000 to $999,999 | 7 (1.4%) | 14 (2.0%) |
| $1,000,000 or more | 0 (0.0%) | 0 (0.0%) |
| Total | 512 (100.0%) | 702 (100.0%) |
Household Income by Mortgage Status in Pikeville
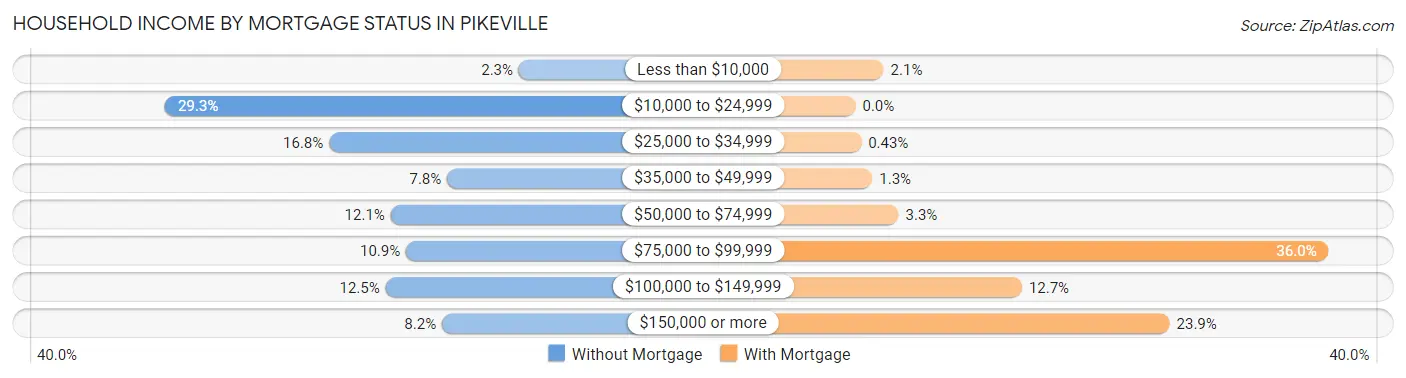
| Household Income | Without Mortgage | With Mortgage |
| Less than $10,000 | 12 (2.3%) | 15 (2.1%) |
| $10,000 to $24,999 | 150 (29.3%) | 0 (0.0%) |
| $25,000 to $34,999 | 86 (16.8%) | 3 (0.4%) |
| $35,000 to $49,999 | 40 (7.8%) | 9 (1.3%) |
| $50,000 to $74,999 | 62 (12.1%) | 23 (3.3%) |
| $75,000 to $99,999 | 56 (10.9%) | 253 (36.0%) |
| $100,000 to $149,999 | 64 (12.5%) | 89 (12.7%) |
| $150,000 or more | 42 (8.2%) | 168 (23.9%) |
| Total | 512 (100.0%) | 702 (100.0%) |
Property Value to Household Income Ratio in Pikeville
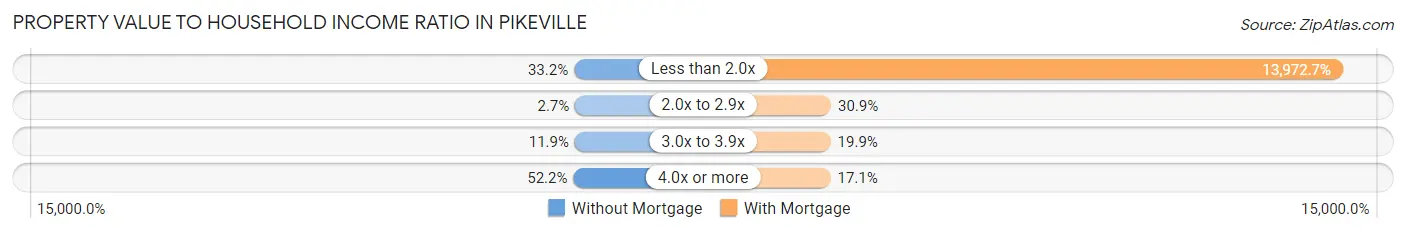
| Value-to-Income Ratio | Without Mortgage | With Mortgage |
| Less than 2.0x | 170 (33.2%) | 98,088 (13,972.6%) |
| 2.0x to 2.9x | 14 (2.7%) | 217 (30.9%) |
| 3.0x to 3.9x | 61 (11.9%) | 140 (19.9%) |
| 4.0x or more | 267 (52.1%) | 120 (17.1%) |
| Total | 512 (100.0%) | 702 (100.0%) |
Real Estate Taxes by Mortgage Status in Pikeville
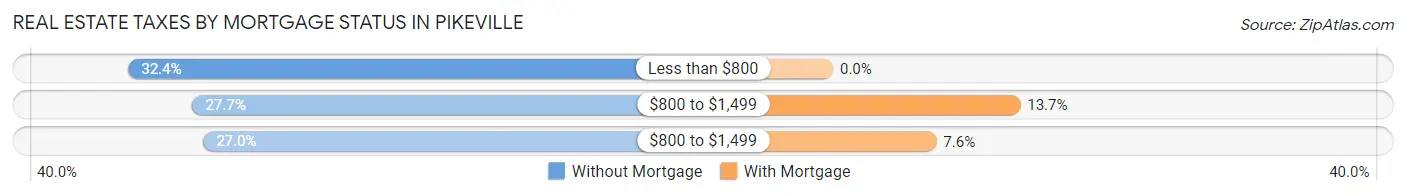
| Property Taxes | Without Mortgage | With Mortgage |
| Less than $800 | 166 (32.4%) | 0 (0.0%) |
| $800 to $1,499 | 142 (27.7%) | 96 (13.7%) |
| $800 to $1,499 | 138 (27.0%) | 53 (7.5%) |
| Total | 512 (100.0%) | 702 (100.0%) |
Health & Disability in Pikeville
Health Insurance Coverage by Age in Pikeville
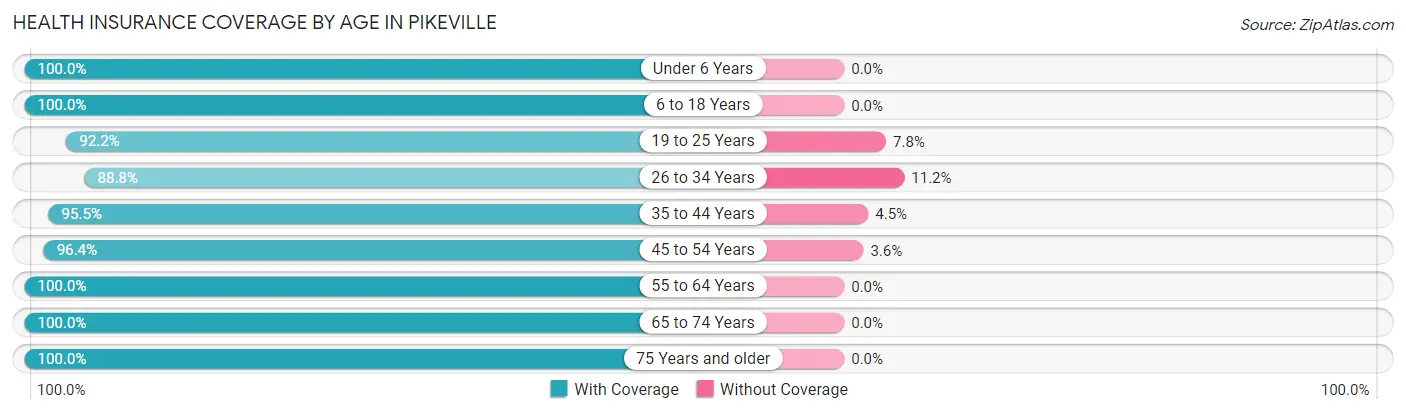
| Age Bracket | With Coverage | Without Coverage |
| Under 6 Years | 306 (100.0%) | 0 (0.0%) |
| 6 to 18 Years | 1,186 (100.0%) | 0 (0.0%) |
| 19 to 25 Years | 1,052 (92.2%) | 89 (7.8%) |
| 26 to 34 Years | 745 (88.8%) | 94 (11.2%) |
| 35 to 44 Years | 744 (95.5%) | 35 (4.5%) |
| 45 to 54 Years | 1,163 (96.4%) | 43 (3.6%) |
| 55 to 64 Years | 681 (100.0%) | 0 (0.0%) |
| 65 to 74 Years | 510 (100.0%) | 0 (0.0%) |
| 75 Years and older | 484 (100.0%) | 0 (0.0%) |
| Total | 6,871 (96.3%) | 261 (3.7%) |
Health Insurance Coverage by Citizenship Status in Pikeville
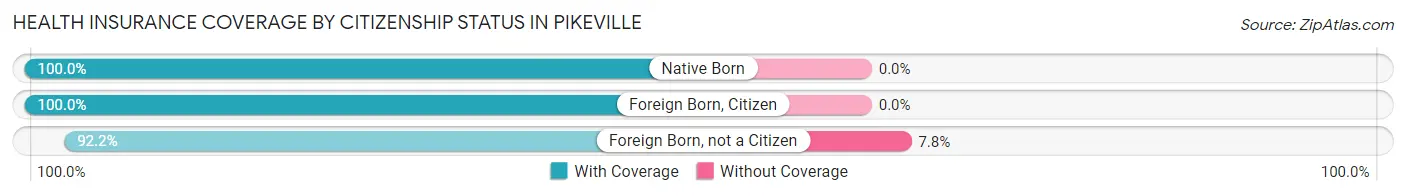
| Citizenship Status | With Coverage | Without Coverage |
| Native Born | 306 (100.0%) | 0 (0.0%) |
| Foreign Born, Citizen | 1,186 (100.0%) | 0 (0.0%) |
| Foreign Born, not a Citizen | 1,052 (92.2%) | 89 (7.8%) |
Health Insurance Coverage by Household Income in Pikeville
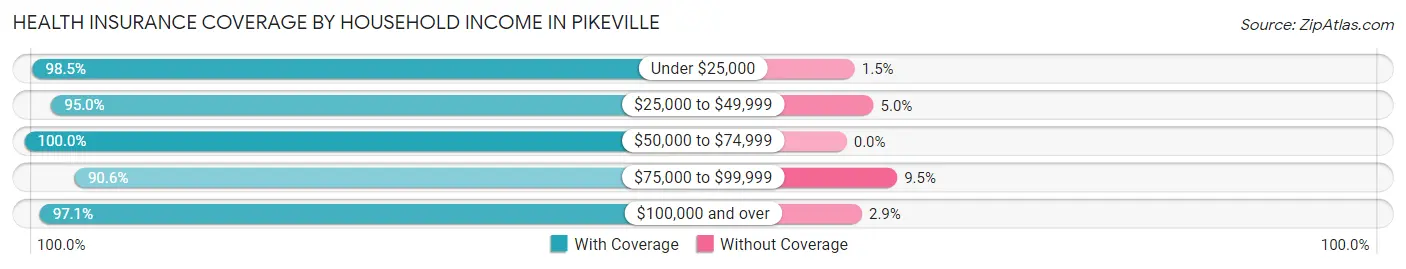
| Household Income | With Coverage | Without Coverage |
| Under $25,000 | 1,765 (98.5%) | 27 (1.5%) |
| $25,000 to $49,999 | 889 (95.0%) | 47 (5.0%) |
| $50,000 to $74,999 | 1,135 (100.0%) | 0 (0.0%) |
| $75,000 to $99,999 | 939 (90.5%) | 98 (9.5%) |
| $100,000 and over | 1,767 (97.1%) | 52 (2.9%) |
Public vs Private Health Insurance Coverage by Age in Pikeville
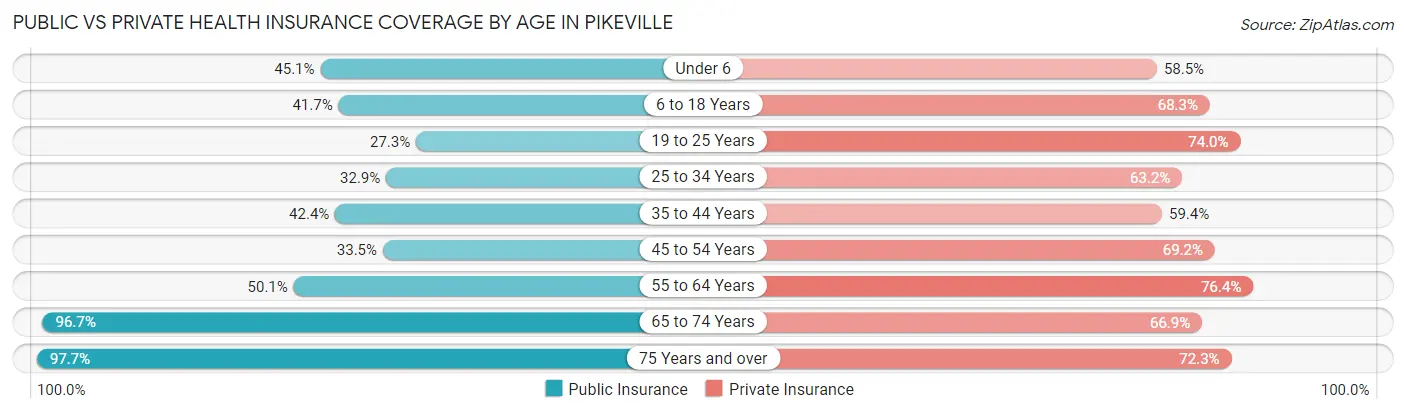
| Age Bracket | Public Insurance | Private Insurance |
| Under 6 | 138 (45.1%) | 179 (58.5%) |
| 6 to 18 Years | 495 (41.7%) | 810 (68.3%) |
| 19 to 25 Years | 312 (27.3%) | 844 (74.0%) |
| 25 to 34 Years | 276 (32.9%) | 530 (63.2%) |
| 35 to 44 Years | 330 (42.4%) | 463 (59.4%) |
| 45 to 54 Years | 404 (33.5%) | 835 (69.2%) |
| 55 to 64 Years | 341 (50.1%) | 520 (76.4%) |
| 65 to 74 Years | 493 (96.7%) | 341 (66.9%) |
| 75 Years and over | 473 (97.7%) | 350 (72.3%) |
| Total | 3,262 (45.7%) | 4,872 (68.3%) |
Disability Status by Sex by Age in Pikeville
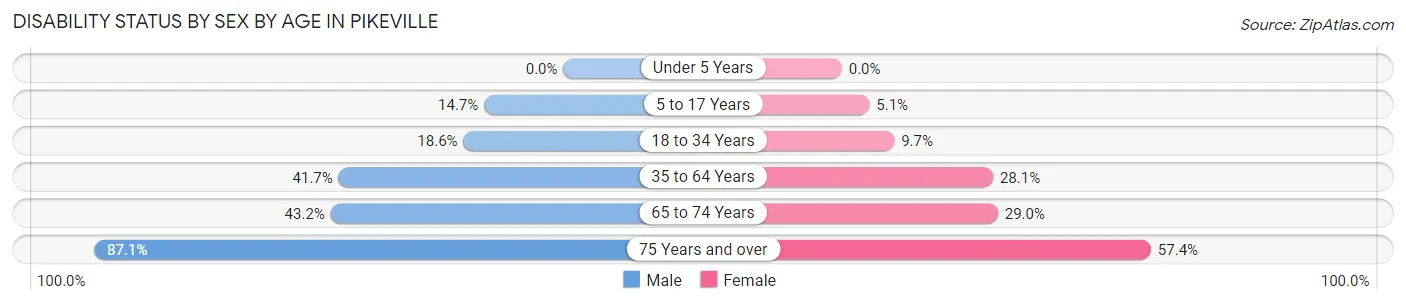
| Age Bracket | Male | Female |
| Under 5 Years | 0 (0.0%) | 0 (0.0%) |
| 5 to 17 Years | 64 (14.7%) | 27 (5.1%) |
| 18 to 34 Years | 225 (18.5%) | 100 (9.7%) |
| 35 to 64 Years | 513 (41.7%) | 403 (28.1%) |
| 65 to 74 Years | 92 (43.2%) | 86 (29.0%) |
| 75 Years and over | 162 (87.1%) | 171 (57.4%) |
Disability Class by Sex by Age in Pikeville
Disability Class: Hearing Difficulty
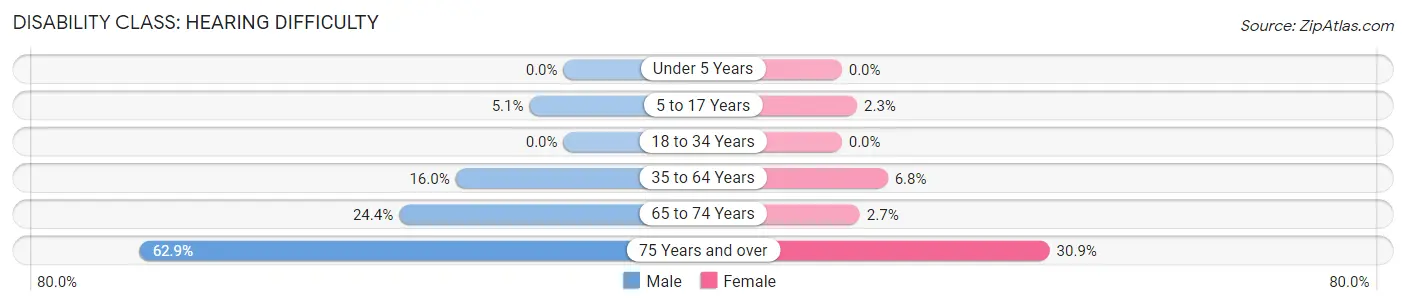
| Age Bracket | Male | Female |
| Under 5 Years | 0 (0.0%) | 0 (0.0%) |
| 5 to 17 Years | 22 (5.1%) | 12 (2.3%) |
| 18 to 34 Years | 0 (0.0%) | 0 (0.0%) |
| 35 to 64 Years | 197 (16.0%) | 98 (6.8%) |
| 65 to 74 Years | 52 (24.4%) | 8 (2.7%) |
| 75 Years and over | 117 (62.9%) | 92 (30.9%) |
Disability Class: Vision Difficulty
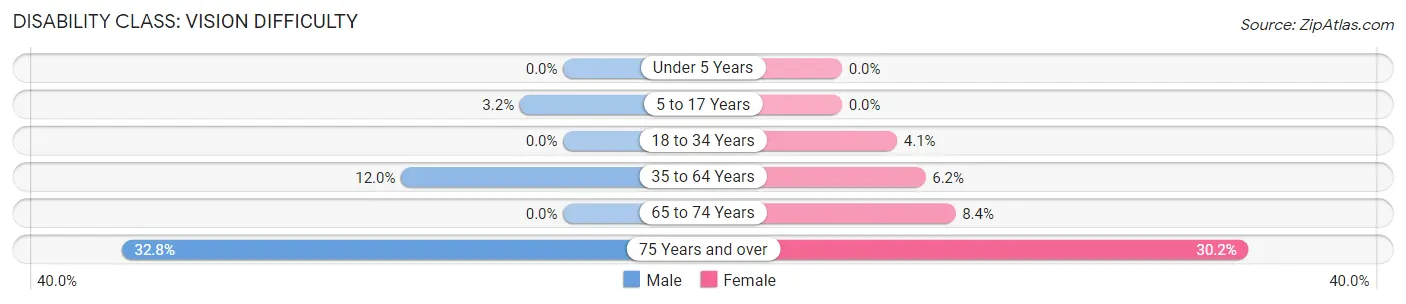
| Age Bracket | Male | Female |
| Under 5 Years | 0 (0.0%) | 0 (0.0%) |
| 5 to 17 Years | 14 (3.2%) | 0 (0.0%) |
| 18 to 34 Years | 0 (0.0%) | 42 (4.1%) |
| 35 to 64 Years | 148 (12.0%) | 89 (6.2%) |
| 65 to 74 Years | 0 (0.0%) | 25 (8.4%) |
| 75 Years and over | 61 (32.8%) | 90 (30.2%) |
Disability Class: Cognitive Difficulty
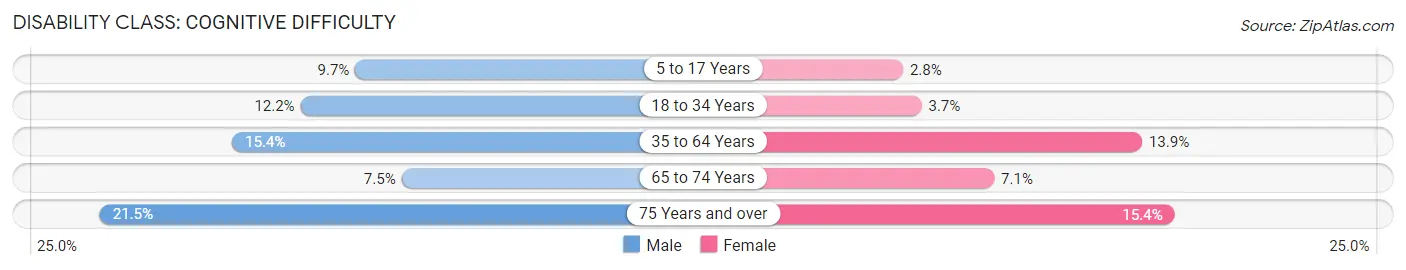
| Age Bracket | Male | Female |
| 5 to 17 Years | 42 (9.7%) | 15 (2.8%) |
| 18 to 34 Years | 148 (12.2%) | 38 (3.7%) |
| 35 to 64 Years | 189 (15.4%) | 200 (13.9%) |
| 65 to 74 Years | 16 (7.5%) | 21 (7.1%) |
| 75 Years and over | 40 (21.5%) | 46 (15.4%) |
Disability Class: Ambulatory Difficulty
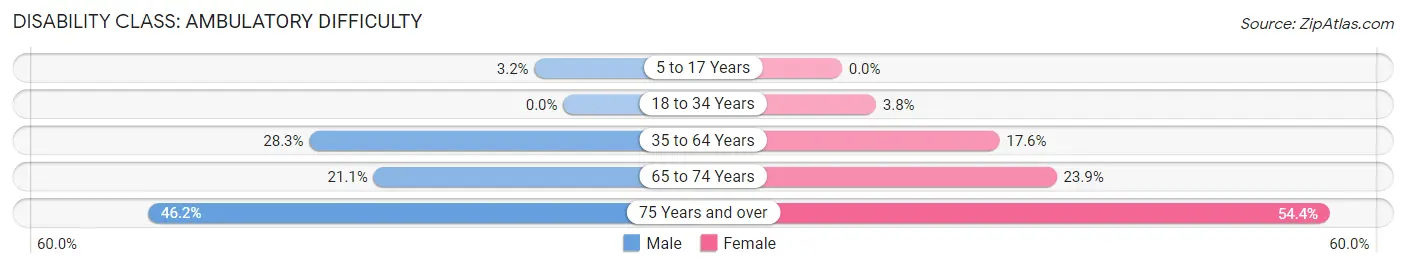
| Age Bracket | Male | Female |
| 5 to 17 Years | 14 (3.2%) | 0 (0.0%) |
| 18 to 34 Years | 0 (0.0%) | 39 (3.8%) |
| 35 to 64 Years | 348 (28.3%) | 252 (17.5%) |
| 65 to 74 Years | 45 (21.1%) | 71 (23.9%) |
| 75 Years and over | 86 (46.2%) | 162 (54.4%) |
Disability Class: Self-Care Difficulty
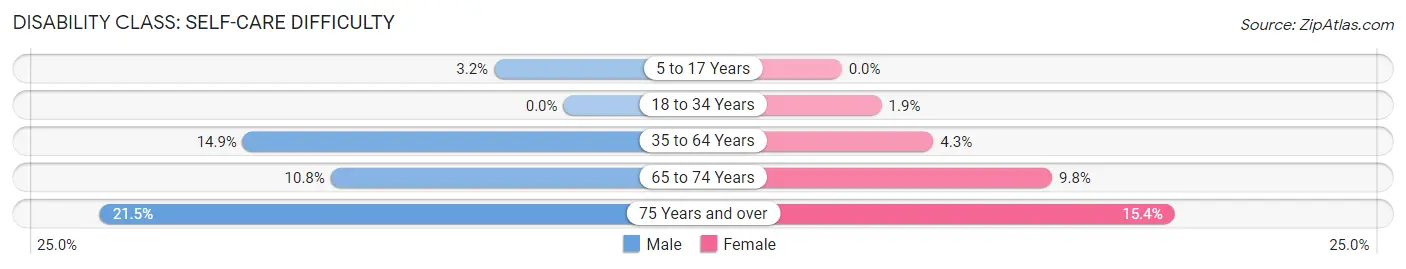
| Age Bracket | Male | Female |
| 5 to 17 Years | 14 (3.2%) | 0 (0.0%) |
| 18 to 34 Years | 0 (0.0%) | 19 (1.8%) |
| 35 to 64 Years | 183 (14.9%) | 61 (4.3%) |
| 65 to 74 Years | 23 (10.8%) | 29 (9.8%) |
| 75 Years and over | 40 (21.5%) | 46 (15.4%) |
Technology Access in Pikeville
Computing Device Access in Pikeville
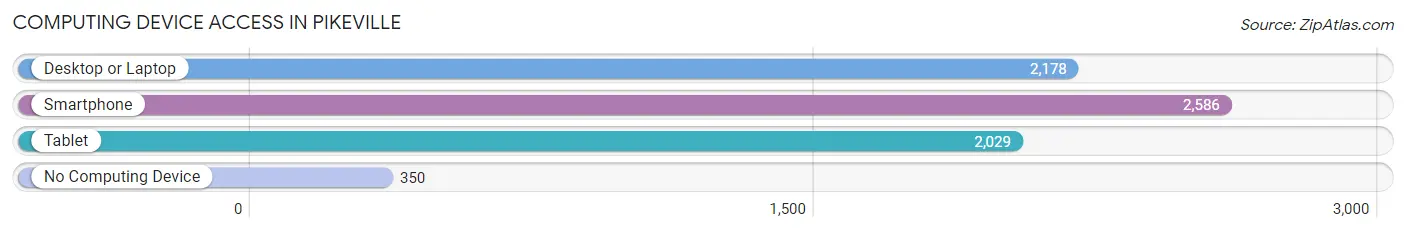
| Device Type | # Households | % Households |
| Desktop or Laptop | 2,178 | 70.8% |
| Smartphone | 2,586 | 84.0% |
| Tablet | 2,029 | 65.9% |
| No Computing Device | 350 | 11.4% |
| Total | 3,078 | 100.0% |
Internet Access in Pikeville
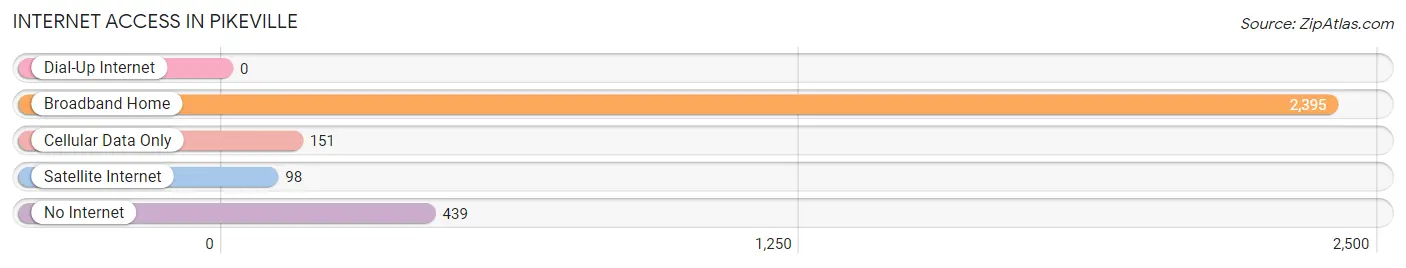
| Internet Type | # Households | % Households |
| Dial-Up Internet | 0 | 0.0% |
| Broadband Home | 2,395 | 77.8% |
| Cellular Data Only | 151 | 4.9% |
| Satellite Internet | 98 | 3.2% |
| No Internet | 439 | 14.3% |
| Total | 3,078 | 100.0% |
Pikeville Summary
Pikeville is a city located in Pike County, Kentucky, United States. It is the county seat of Pike County and the 11th-largest city in the state. The population was 6,903 at the 2010 census. Pikeville is located in the heart of the Appalachian Mountains, and is the primary city of the Pikeville Micropolitan Statistical Area, which includes Pike and Martin counties.
History
Pikeville was founded in 1822 by John Pike, a Revolutionary War veteran. The city was named after him and was incorporated in 1854. The city was originally a small farming community, but it quickly grew into a bustling coal mining town. The city was the site of the Battle of Middle Creek, a Civil War battle fought in 1862.
Geography
Pikeville is located at 37°27′N 82°30′W (37.45, -82.50). According to the United States Census Bureau, the city has a total area of 4.3 square miles (11.2 km2), all land.
Economy
Pikeville is the economic hub of the region, and its economy is largely based on coal mining and related industries. The city is home to several large coal companies, including Alpha Natural Resources, Arch Coal, and Patriot Coal. The city is also home to several manufacturing companies, including a large automotive parts plant operated by Toyota.
Demographics
As of the 2010 census, there were 6,903 people, 2,845 households, and 1,845 families residing in the city. The population density was 1,611.3 people per square mile (619.7/km2). There were 3,093 housing units at an average density of 717.3 per square mile (277.3/km2). The racial makeup of the city was 95.2% White, 2.2% African American, 0.2% Native American, 0.5% Asian, 0.1% Pacific Islander, 0.7% from other races, and 1.1% from two or more races. Hispanic or Latino of any race were 1.7% of the population.
There were 2,845 households, out of which 28.2% had children under the age of 18 living with them, 44.2% were married couples living together, 15.3% had a female householder with no husband present, and 36.2% were non-families. 32.2% of all households were made up of individuals, and 14.2% had someone living alone who was 65 years of age or older. The average household size was 2.33 and the average family size was 2.94.
In the city, the population was spread out, with 23.2% under the age of 18, 8.7% from 18 to 24, 27.2% from 25 to 44, 24.2% from 45 to 64, and 16.7% who were 65 years of age or older. The median age was 38 years. For every 100 females, there were 87.2 males. For every 100 females age 18 and over, there were 82.7 males.
The median income for a household in the city was $25,938, and the median income for a family was $32,917. Males had a median income of $30,917 versus $20,938 for females. The per capita income for the city was $15,938. About 17.2% of families and 20.2% of the population were below the poverty line, including 28.2% of those under age 18 and 16.2% of those age 65 or over.
Common Questions
What is Per Capita Income in Pikeville?
Per Capita income in Pikeville is $31,614.
What is the Median Family Income in Pikeville?
Median Family Income in Pikeville is $73,475.
What is the Median Household income in Pikeville?
Median Household Income in Pikeville is $41,324.
What is Income or Wage Gap in Pikeville?
Income or Wage Gap in Pikeville is 8.6%.
Women in Pikeville earn 91.4 cents for every dollar earned by a man.
What is Inequality or Gini Index in Pikeville?
Inequality or Gini Index in Pikeville is 0.61.
What is the Total Population of Pikeville?
Total Population of Pikeville is 7,563.
What is the Total Male Population of Pikeville?
Total Male Population of Pikeville is 3,726.
What is the Total Female Population of Pikeville?
Total Female Population of Pikeville is 3,837.
What is the Ratio of Males per 100 Females in Pikeville?
There are 97.11 Males per 100 Females in Pikeville.
What is the Ratio of Females per 100 Males in Pikeville?
There are 102.98 Females per 100 Males in Pikeville.
What is the Median Population Age in Pikeville?
Median Population Age in Pikeville is 35.8 Years.
What is the Average Family Size in Pikeville
Average Family Size in Pikeville is 2.8 People.
What is the Average Household Size in Pikeville
Average Household Size in Pikeville is 2.2 People.
How Large is the Labor Force in Pikeville?
There are 3,017 People in the Labor Forcein in Pikeville.
What is the Percentage of People in the Labor Force in Pikeville?
46.8% of People are in the Labor Force in Pikeville.
What is the Unemployment Rate in Pikeville?
Unemployment Rate in Pikeville is 4.1%.