Burkesville, KY Map & Demographics
Burkesville Map
Burkesville Overview
$22,422
PER CAPITA INCOME
$34,974
AVG FAMILY INCOME
$26,563
AVG HOUSEHOLD INCOME
21.0%
WAGE / INCOME GAP [ % ]
79.0¢/ $1
WAGE / INCOME GAP [ $ ]
0.50
INEQUALITY / GINI INDEX
1,423
TOTAL POPULATION
584
MALE POPULATION
839
FEMALE POPULATION
69.61
MALES / 100 FEMALES
143.66
FEMALES / 100 MALES
51.6
MEDIAN AGE
2.7
AVG FAMILY SIZE
1.8
AVG HOUSEHOLD SIZE
502
LABOR FORCE [ PEOPLE ]
40.9%
PERCENT IN LABOR FORCE
2.4%
UNEMPLOYMENT RATE
Burkesville Zip Codes
Burkesville Area Codes
Income in Burkesville
Income Overview in Burkesville
Per Capita Income in Burkesville is $22,422, while median incomes of families and households are $34,974 and $26,563 respectively.
| Characteristic | Number | Measure |
| Per Capita Income | 1,423 | $22,422 |
| Median Family Income | 313 | $34,974 |
| Mean Family Income | 313 | $53,232 |
| Median Household Income | 737 | $26,563 |
| Mean Household Income | 737 | $42,569 |
| Income Deficit | 313 | $0 |
| Wage / Income Gap (%) | 1,423 | 20.96% |
| Wage / Income Gap ($) | 1,423 | 79.04¢ per $1 |
| Gini / Inequality Index | 1,423 | 0.50 |
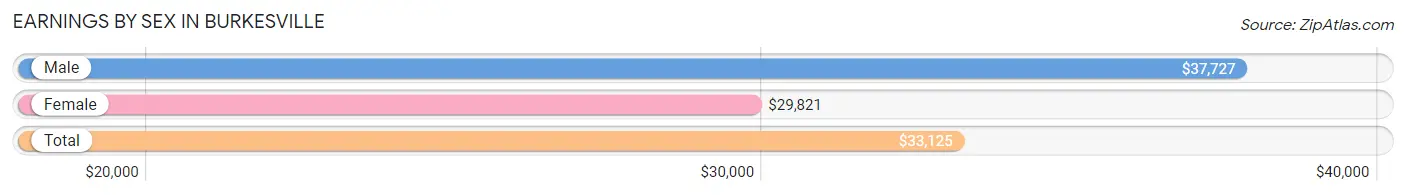
Earnings by Sex in Burkesville
Average Earnings in Burkesville are $33,125, $37,727 for men and $29,821 for women, a difference of 21.0%.
| Sex | Number | Average Earnings |
| Male | 290 (53.7%) | $37,727 |
| Female | 250 (46.3%) | $29,821 |
| Total | 540 (100.0%) | $33,125 |
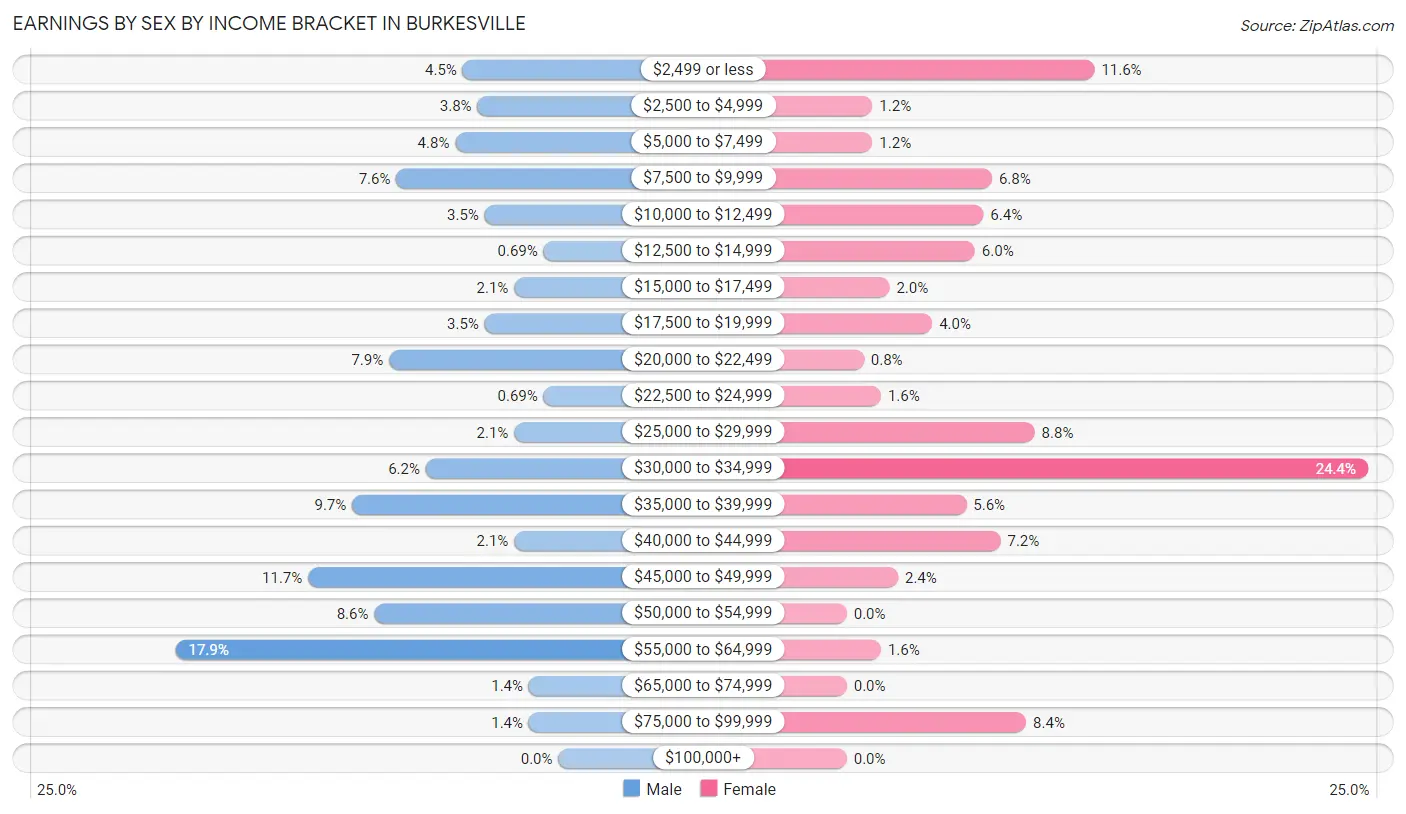
Earnings by Sex by Income Bracket in Burkesville
The most common earnings brackets in Burkesville are $55,000 to $64,999 for men (52 | 17.9%) and $30,000 to $34,999 for women (61 | 24.4%).
| Income | Male | Female |
| $2,499 or less | 13 (4.5%) | 29 (11.6%) |
| $2,500 to $4,999 | 11 (3.8%) | 3 (1.2%) |
| $5,000 to $7,499 | 14 (4.8%) | 3 (1.2%) |
| $7,500 to $9,999 | 22 (7.6%) | 17 (6.8%) |
| $10,000 to $12,499 | 10 (3.5%) | 16 (6.4%) |
| $12,500 to $14,999 | 2 (0.7%) | 15 (6.0%) |
| $15,000 to $17,499 | 6 (2.1%) | 5 (2.0%) |
| $17,500 to $19,999 | 10 (3.5%) | 10 (4.0%) |
| $20,000 to $22,499 | 23 (7.9%) | 2 (0.8%) |
| $22,500 to $24,999 | 2 (0.7%) | 4 (1.6%) |
| $25,000 to $29,999 | 6 (2.1%) | 22 (8.8%) |
| $30,000 to $34,999 | 18 (6.2%) | 61 (24.4%) |
| $35,000 to $39,999 | 28 (9.7%) | 14 (5.6%) |
| $40,000 to $44,999 | 6 (2.1%) | 18 (7.2%) |
| $45,000 to $49,999 | 34 (11.7%) | 6 (2.4%) |
| $50,000 to $54,999 | 25 (8.6%) | 0 (0.0%) |
| $55,000 to $64,999 | 52 (17.9%) | 4 (1.6%) |
| $65,000 to $74,999 | 4 (1.4%) | 0 (0.0%) |
| $75,000 to $99,999 | 4 (1.4%) | 21 (8.4%) |
| $100,000+ | 0 (0.0%) | 0 (0.0%) |
| Total | 290 (100.0%) | 250 (100.0%) |
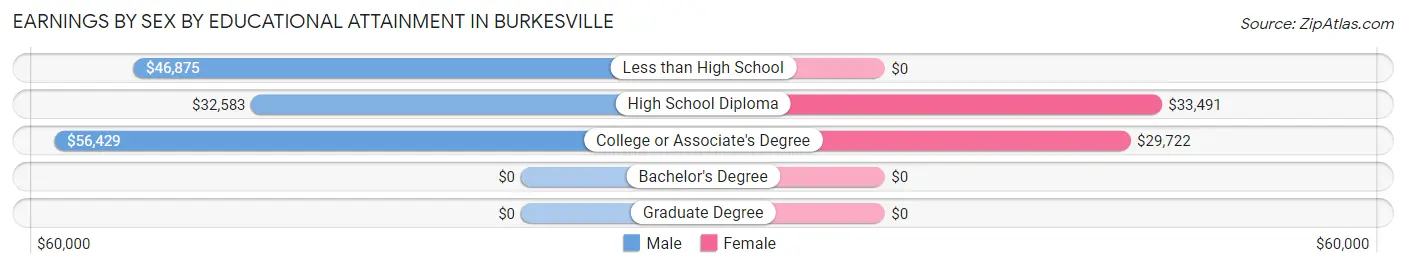
Earnings by Sex by Educational Attainment in Burkesville
Average earnings in Burkesville are $39,716 for men and $32,901 for women, a difference of 17.2%. Men with an educational attainment of college or associate's degree enjoy the highest average annual earnings of $56,429, while those with high school diploma education earn the least with $32,583. Women with an educational attainment of high school diploma earn the most with the average annual earnings of $33,491, while those with college or associate's degree education have the smallest earnings of $29,722.
| Educational Attainment | Male Income | Female Income |
| Less than High School | $46,875 | $0 |
| High School Diploma | $32,583 | $33,491 |
| College or Associate's Degree | $56,429 | $29,722 |
| Bachelor's Degree | - | - |
| Graduate Degree | - | - |
| Total | $39,716 | $32,901 |
Family Income in Burkesville
Family Income Brackets in Burkesville
According to the Burkesville family income data, there are 61 families falling into the $25,000 to $34,999 income range, which is the most common income bracket and makes up 19.5% of all families.
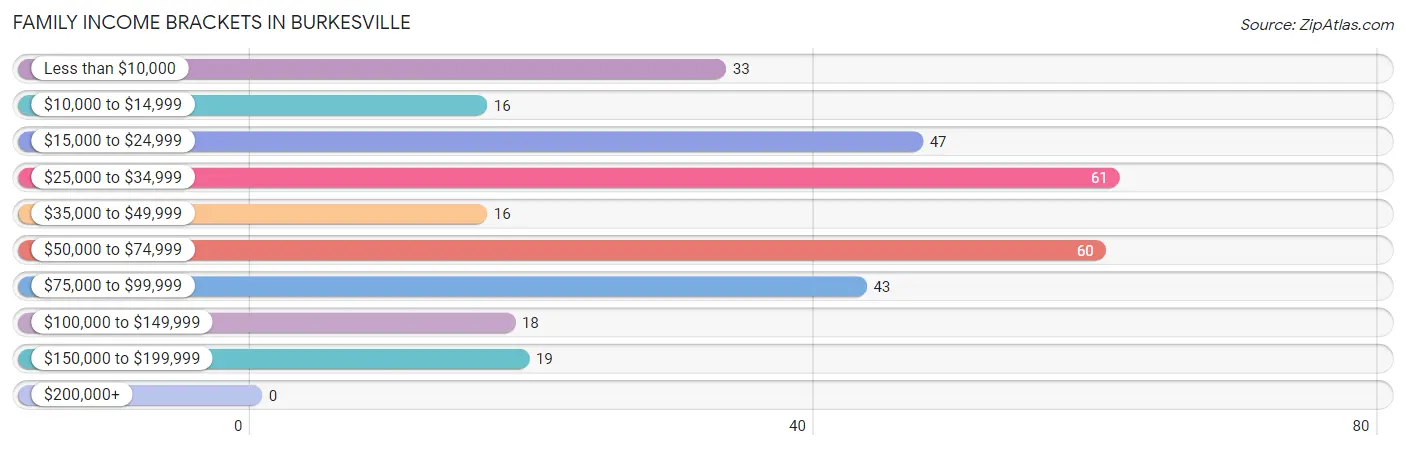
| Income Bracket | # Families | % Families |
| Less than $10,000 | 33 | 10.5% |
| $10,000 to $14,999 | 16 | 5.1% |
| $15,000 to $24,999 | 47 | 15.0% |
| $25,000 to $34,999 | 61 | 19.5% |
| $35,000 to $49,999 | 16 | 5.1% |
| $50,000 to $74,999 | 60 | 19.2% |
| $75,000 to $99,999 | 43 | 13.7% |
| $100,000 to $149,999 | 18 | 5.8% |
| $150,000 to $199,999 | 19 | 6.1% |
| $200,000+ | 0 | 0.0% |
Family Income by Famaliy Size in Burkesville
3-person families (64 | 20.4%) account for the highest median family income in Burkesville with $81,250 per family, while 3-person families (64 | 20.4%) have the highest median income of $27,083 per family member.
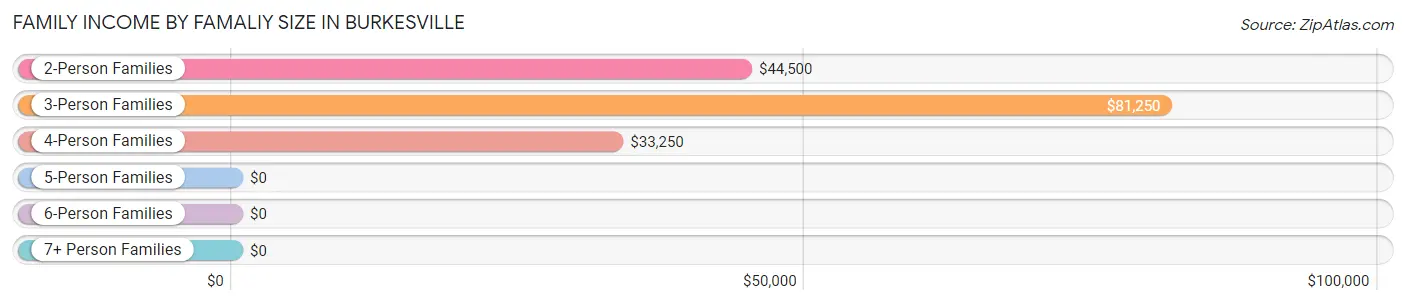
| Income Bracket | # Families | Median Income |
| 2-Person Families | 160 (51.1%) | $44,500 |
| 3-Person Families | 64 (20.4%) | $81,250 |
| 4-Person Families | 67 (21.4%) | $33,250 |
| 5-Person Families | 17 (5.4%) | $0 |
| 6-Person Families | 0 (0.0%) | $0 |
| 7+ Person Families | 5 (1.6%) | $0 |
| Total | 313 (100.0%) | $34,974 |
Family Income by Number of Earners in Burkesville
The median family income in Burkesville is $34,974, with families comprising 3+ earners (28) having the highest median family income of $153,158, while families with no earners (71) have the lowest median family income of $13,250, accounting for 8.9% and 22.7% of families, respectively.
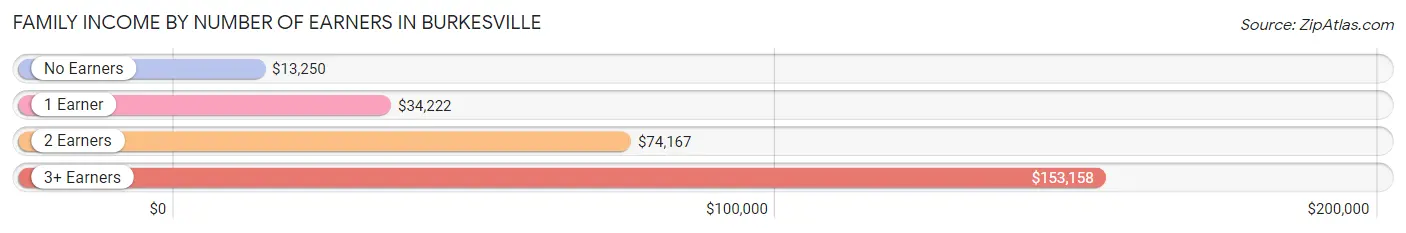
| Number of Earners | # Families | Median Income |
| No Earners | 71 (22.7%) | $13,250 |
| 1 Earner | 132 (42.2%) | $34,222 |
| 2 Earners | 82 (26.2%) | $74,167 |
| 3+ Earners | 28 (8.9%) | $153,158 |
| Total | 313 (100.0%) | $34,974 |
Household Income in Burkesville
Household Income Brackets in Burkesville
With 152 households falling in the category, the $10,000 to $14,999 income range is the most frequent in Burkesville, accounting for 20.6% of all households. In contrast, only 11 households (1.5%) fall into the $200,000+ income bracket, making it the least populous group.
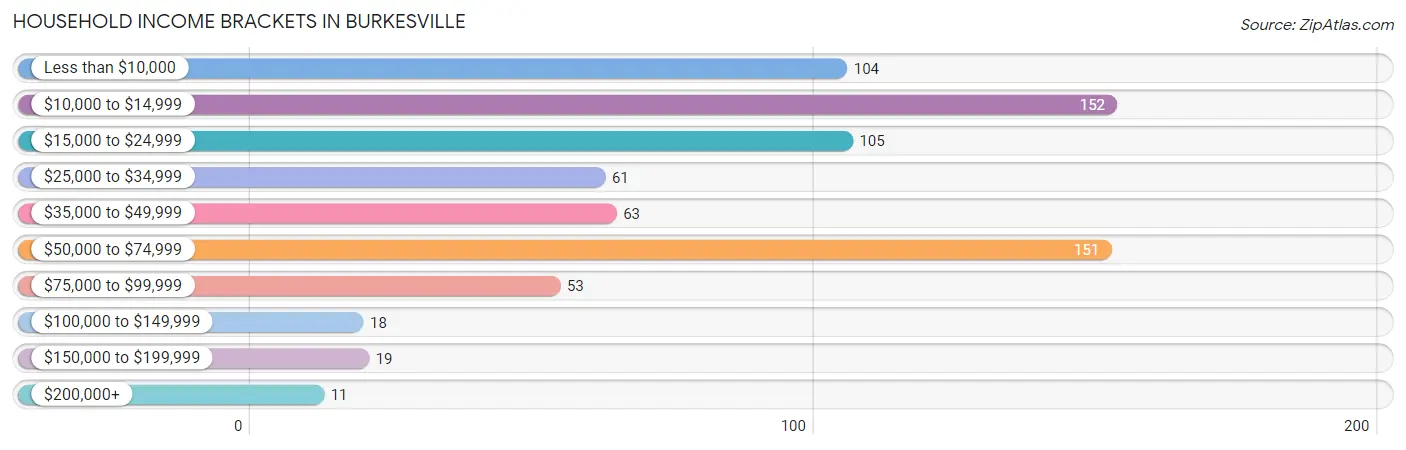
| Income Bracket | # Households | % Households |
| Less than $10,000 | 104 | 14.1% |
| $10,000 to $14,999 | 152 | 20.6% |
| $15,000 to $24,999 | 105 | 14.2% |
| $25,000 to $34,999 | 61 | 8.3% |
| $35,000 to $49,999 | 63 | 8.5% |
| $50,000 to $74,999 | 151 | 20.5% |
| $75,000 to $99,999 | 53 | 7.2% |
| $100,000 to $149,999 | 18 | 2.4% |
| $150,000 to $199,999 | 19 | 2.6% |
| $200,000+ | 11 | 1.5% |
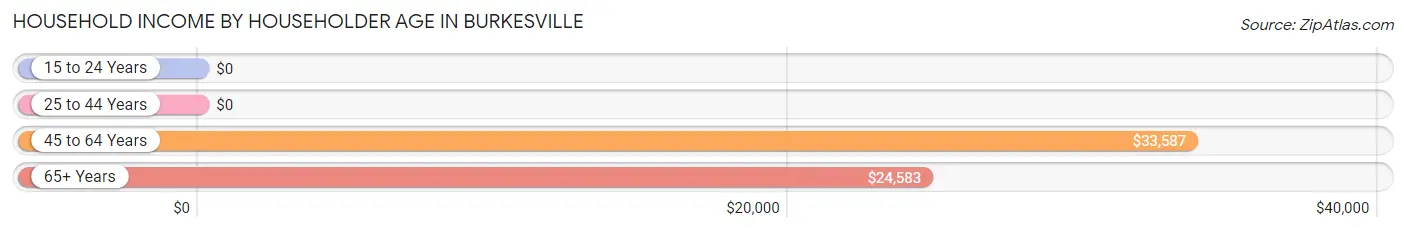
Household Income by Householder Age in Burkesville
The median household income in Burkesville is $26,563, with the highest median household income of $33,587 found in the 45 to 64 years age bracket for the primary householder. A total of 296 households (40.2%) fall into this category. Meanwhile, the 15 to 24 years age bracket for the primary householder has the lowest median household income of $0, with 27 households (3.7%) in this group.
| Income Bracket | # Households | Median Income |
| 15 to 24 Years | 27 (3.7%) | $0 |
| 25 to 44 Years | 171 (23.2%) | $0 |
| 45 to 64 Years | 296 (40.2%) | $33,587 |
| 65+ Years | 243 (33.0%) | $24,583 |
| Total | 737 (100.0%) | $26,563 |
Poverty in Burkesville
Income Below Poverty by Sex and Age in Burkesville
With 31.1% poverty level for males and 41.6% for females among the residents of Burkesville, 16 and 17 year old males and 25 to 34 year old females are the most vulnerable to poverty, with 4 males (100.0%) and 48 females (69.6%) in their respective age groups living below the poverty level.
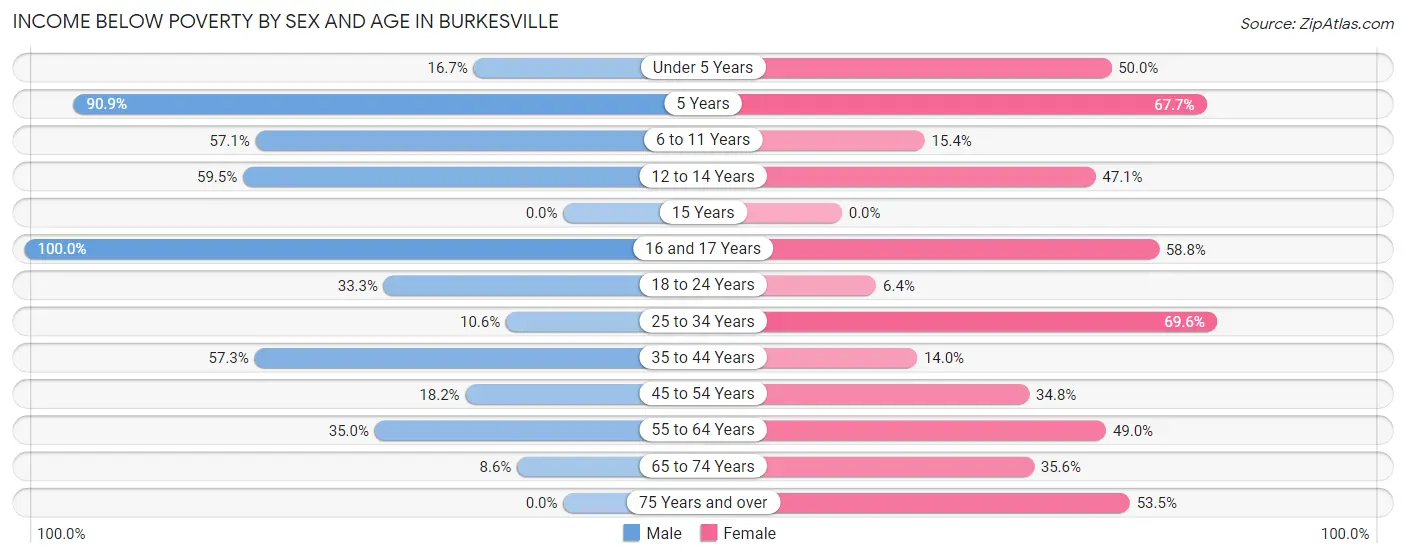
| Age Bracket | Male | Female |
| Under 5 Years | 2 (16.7%) | 6 (50.0%) |
| 5 Years | 10 (90.9%) | 23 (67.6%) |
| 6 to 11 Years | 8 (57.1%) | 4 (15.4%) |
| 12 to 14 Years | 22 (59.5%) | 8 (47.1%) |
| 15 Years | 0 (0.0%) | 0 (0.0%) |
| 16 and 17 Years | 4 (100.0%) | 10 (58.8%) |
| 18 to 24 Years | 12 (33.3%) | 3 (6.4%) |
| 25 to 34 Years | 5 (10.6%) | 48 (69.6%) |
| 35 to 44 Years | 47 (57.3%) | 12 (14.0%) |
| 45 to 54 Years | 16 (18.2%) | 32 (34.8%) |
| 55 to 64 Years | 42 (35.0%) | 76 (49.0%) |
| 65 to 74 Years | 6 (8.6%) | 31 (35.6%) |
| 75 Years and over | 0 (0.0%) | 62 (53.4%) |
| Total | 174 (31.1%) | 315 (41.6%) |
Income Above Poverty by Sex and Age in Burkesville
According to the poverty statistics in Burkesville, males aged 15 years and females aged 18 to 24 years are the age groups that are most secure financially, with 100.0% of males and 93.6% of females in these age groups living above the poverty line.
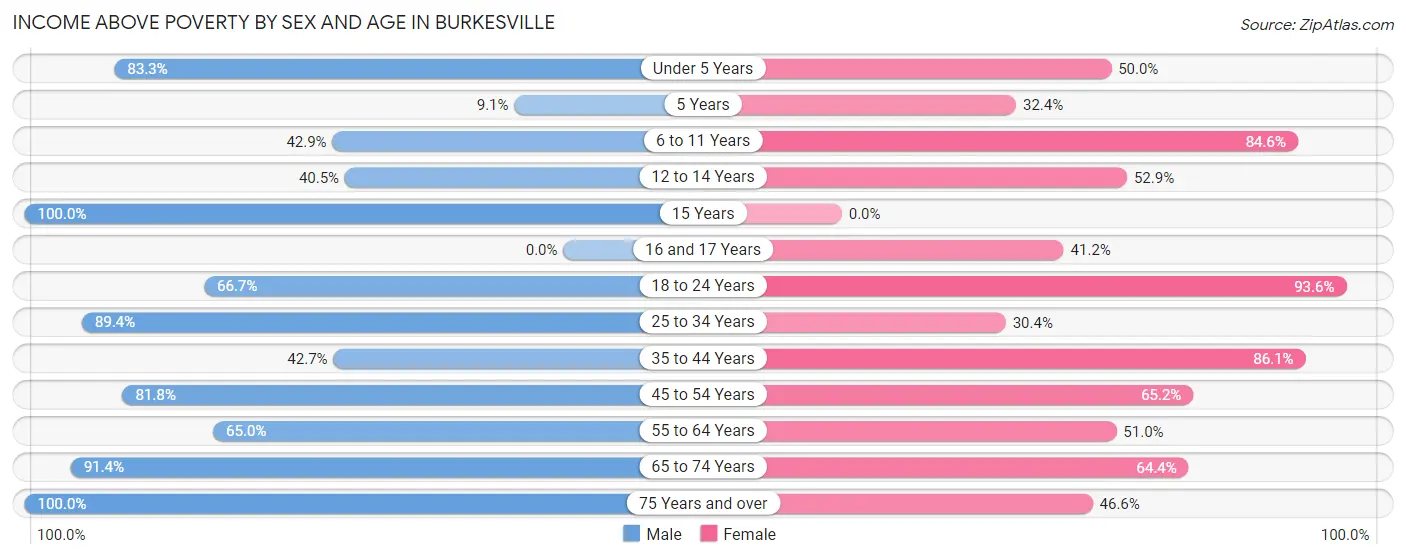
| Age Bracket | Male | Female |
| Under 5 Years | 10 (83.3%) | 6 (50.0%) |
| 5 Years | 1 (9.1%) | 11 (32.4%) |
| 6 to 11 Years | 6 (42.9%) | 22 (84.6%) |
| 12 to 14 Years | 15 (40.5%) | 9 (52.9%) |
| 15 Years | 8 (100.0%) | 0 (0.0%) |
| 16 and 17 Years | 0 (0.0%) | 7 (41.2%) |
| 18 to 24 Years | 24 (66.7%) | 44 (93.6%) |
| 25 to 34 Years | 42 (89.4%) | 21 (30.4%) |
| 35 to 44 Years | 35 (42.7%) | 74 (86.1%) |
| 45 to 54 Years | 72 (81.8%) | 60 (65.2%) |
| 55 to 64 Years | 78 (65.0%) | 79 (51.0%) |
| 65 to 74 Years | 64 (91.4%) | 56 (64.4%) |
| 75 Years and over | 31 (100.0%) | 54 (46.6%) |
| Total | 386 (68.9%) | 443 (58.4%) |
Income Below Poverty Among Married-Couple Families in Burkesville
The poverty statistics for married-couple families in Burkesville show that 22.7% or 35 of the total 154 families live below the poverty line. Families with 1 or 2 children have the highest poverty rate of 45.5%, comprising of 15 families. On the other hand, families with 3 or 4 children have the lowest poverty rate of 0.0%, which includes 0 families.
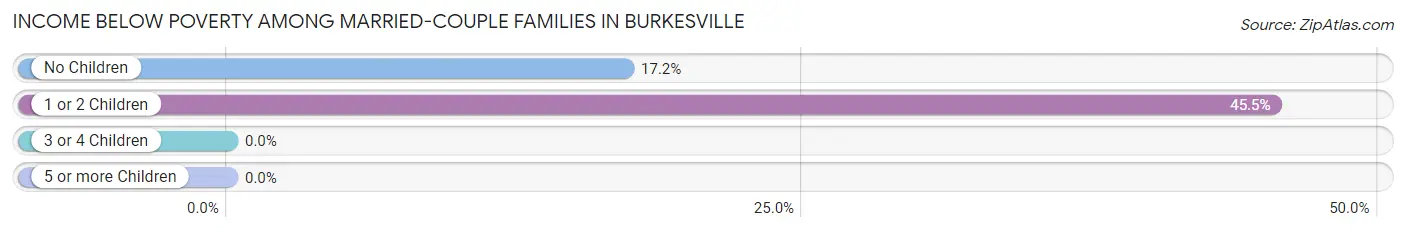
| Children | Above Poverty | Below Poverty |
| No Children | 96 (82.8%) | 20 (17.2%) |
| 1 or 2 Children | 18 (54.5%) | 15 (45.5%) |
| 3 or 4 Children | 5 (100.0%) | 0 (0.0%) |
| 5 or more Children | 0 (0.0%) | 0 (0.0%) |
| Total | 119 (77.3%) | 35 (22.7%) |
Income Below Poverty Among Single-Parent Households in Burkesville
According to the poverty data in Burkesville, 23.8% or 10 single-father households and 36.7% or 43 single-mother households are living below the poverty line. Among single-father households, those with 1 or 2 children have the highest poverty rate, with 10 households (100.0%) experiencing poverty. Likewise, among single-mother households, those with 1 or 2 children have the highest poverty rate, with 31 households (93.9%) falling below the poverty line.
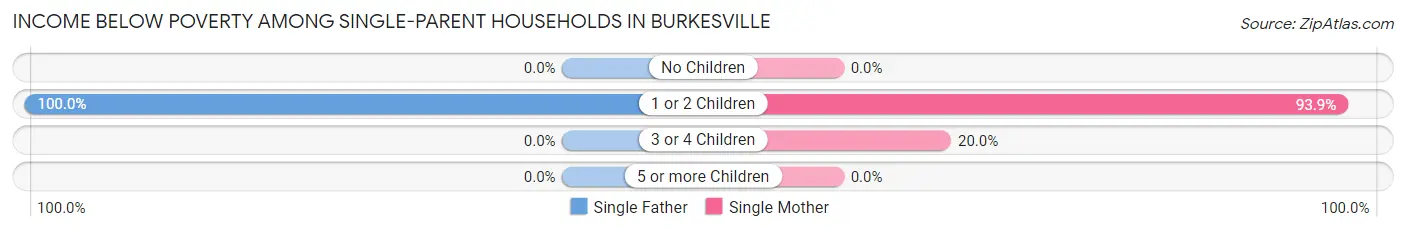
| Children | Single Father | Single Mother |
| No Children | 0 (0.0%) | 0 (0.0%) |
| 1 or 2 Children | 10 (100.0%) | 31 (93.9%) |
| 3 or 4 Children | 0 (0.0%) | 12 (20.0%) |
| 5 or more Children | 0 (0.0%) | 0 (0.0%) |
| Total | 10 (23.8%) | 43 (36.7%) |
Income Below Poverty Among Married-Couple vs Single-Parent Households in Burkesville
The poverty data for Burkesville shows that 35 of the married-couple family households (22.7%) and 53 of the single-parent households (33.3%) are living below the poverty level. Within the married-couple family households, those with 1 or 2 children have the highest poverty rate, with 15 households (45.5%) falling below the poverty line. Among the single-parent households, those with 1 or 2 children have the highest poverty rate, with 41 household (95.4%) living below poverty.
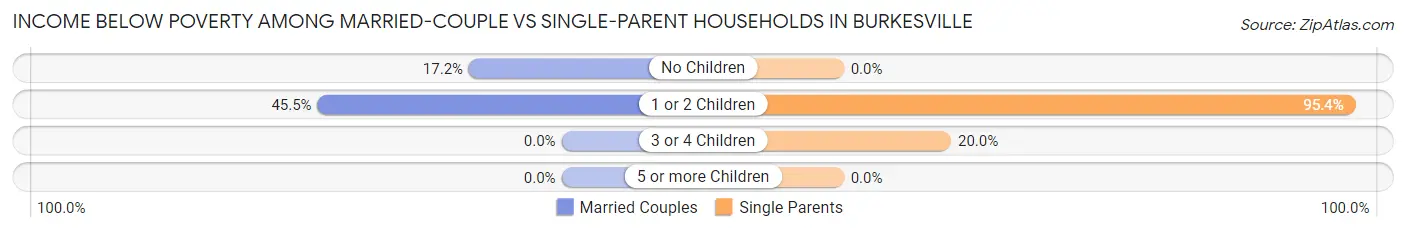
| Children | Married-Couple Families | Single-Parent Households |
| No Children | 20 (17.2%) | 0 (0.0%) |
| 1 or 2 Children | 15 (45.5%) | 41 (95.4%) |
| 3 or 4 Children | 0 (0.0%) | 12 (20.0%) |
| 5 or more Children | 0 (0.0%) | 0 (0.0%) |
| Total | 35 (22.7%) | 53 (33.3%) |
Race in Burkesville
The most populous races in Burkesville are White / Caucasian (1,200 | 84.3%), Black / African American (145 | 10.2%), and Hispanic or Latino (42 | 2.9%).
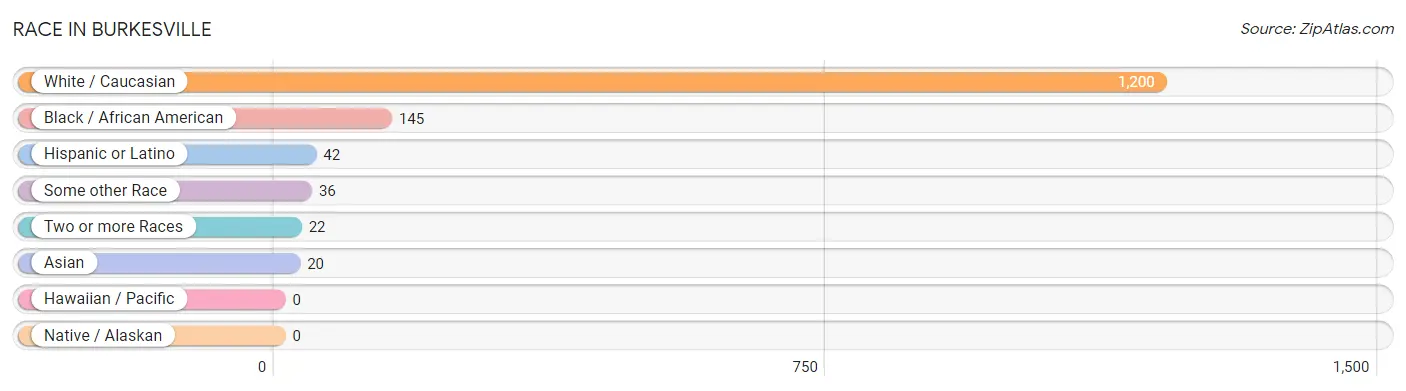
| Race | # Population | % Population |
| Asian | 20 | 1.4% |
| Black / African American | 145 | 10.2% |
| Hawaiian / Pacific | 0 | 0.0% |
| Hispanic or Latino | 42 | 2.9% |
| Native / Alaskan | 0 | 0.0% |
| White / Caucasian | 1,200 | 84.3% |
| Two or more Races | 22 | 1.5% |
| Some other Race | 36 | 2.5% |
| Total | 1,423 | 100.0% |
Ancestry in Burkesville
The most populous ancestries reported in Burkesville are American (233 | 16.4%), English (219 | 15.4%), German (100 | 7.0%), Irish (78 | 5.5%), and Scottish (40 | 2.8%), together accounting for 47.1% of all Burkesville residents.
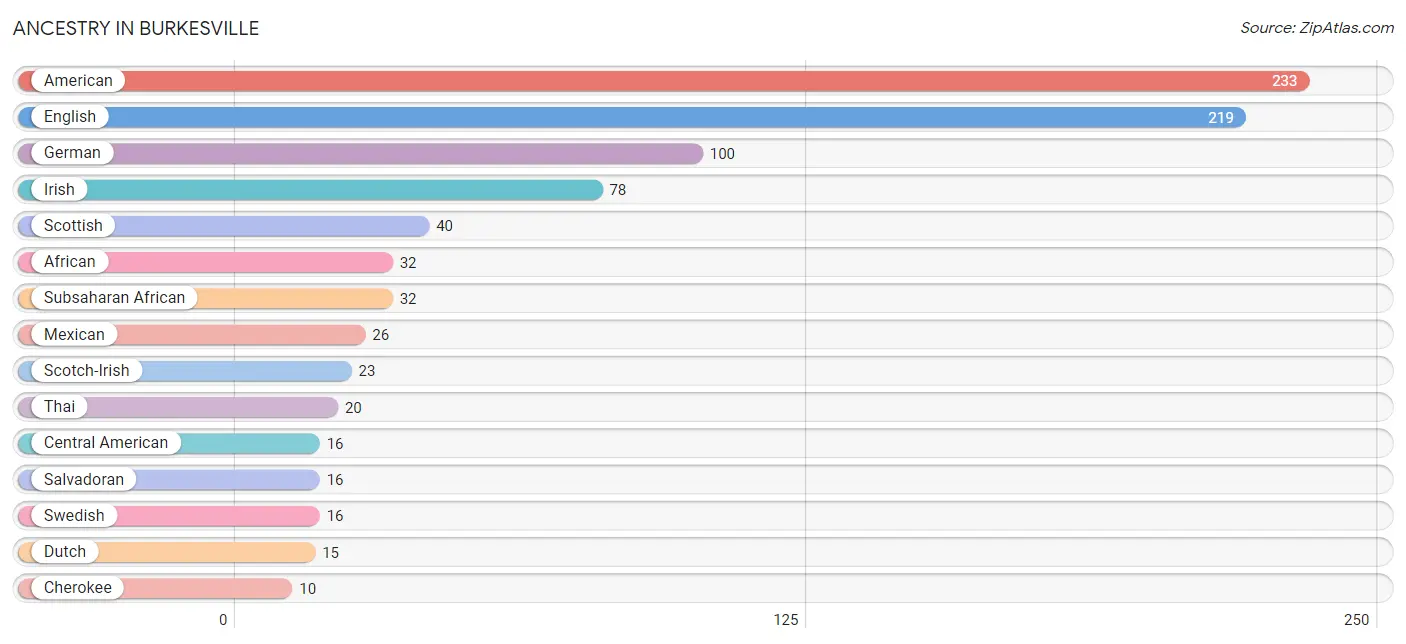
| Ancestry | # Population | % Population |
| African | 32 | 2.2% |
| American | 233 | 16.4% |
| British | 9 | 0.6% |
| Central American | 16 | 1.1% |
| Cherokee | 10 | 0.7% |
| Dutch | 15 | 1.1% |
| English | 219 | 15.4% |
| German | 100 | 7.0% |
| Irish | 78 | 5.5% |
| Italian | 2 | 0.1% |
| Mexican | 26 | 1.8% |
| Northern European | 4 | 0.3% |
| Norwegian | 4 | 0.3% |
| Salvadoran | 16 | 1.1% |
| Scotch-Irish | 23 | 1.6% |
| Scottish | 40 | 2.8% |
| Subsaharan African | 32 | 2.2% |
| Swedish | 16 | 1.1% |
| Thai | 20 | 1.4% | View All 19 Rows |
Immigrants in Burkesville
The most numerous immigrant groups reported in Burkesville came from Central America (23 | 1.6%), Latin America (23 | 1.6%), Asia (20 | 1.4%), India (20 | 1.4%), and South Central Asia (20 | 1.4%), together accounting for 7.5% of all Burkesville residents.
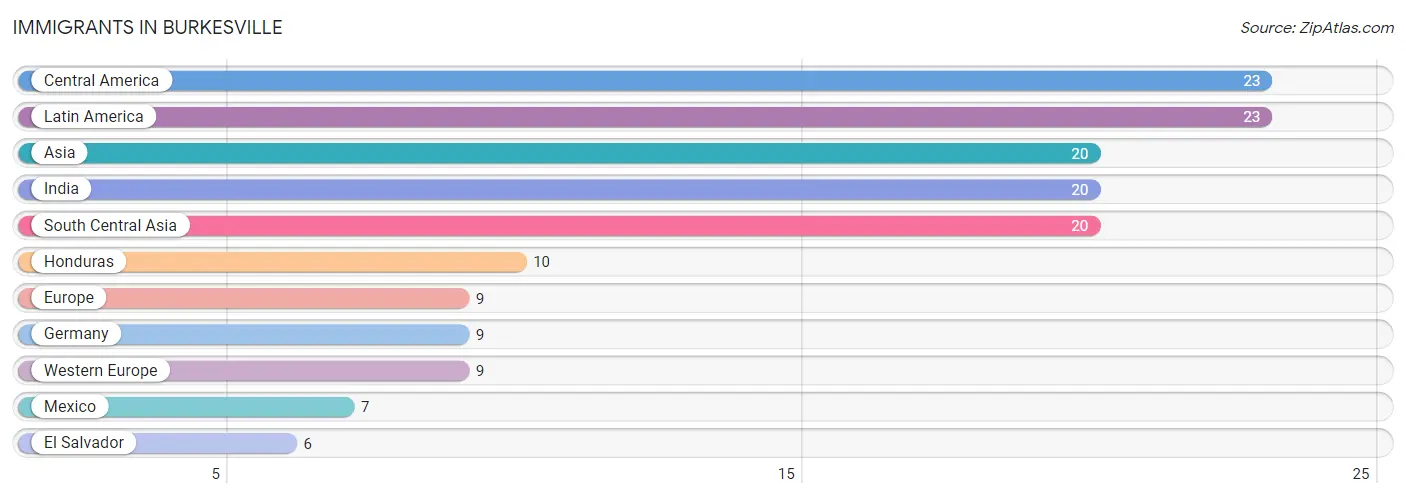
| Immigration Origin | # Population | % Population |
| Asia | 20 | 1.4% |
| Central America | 23 | 1.6% |
| El Salvador | 6 | 0.4% |
| Europe | 9 | 0.6% |
| Germany | 9 | 0.6% |
| Honduras | 10 | 0.7% |
| India | 20 | 1.4% |
| Latin America | 23 | 1.6% |
| Mexico | 7 | 0.5% |
| South Central Asia | 20 | 1.4% |
| Western Europe | 9 | 0.6% | View All 11 Rows |
Sex and Age in Burkesville
Sex and Age in Burkesville
The most populous age groups in Burkesville are 55 to 59 Years (89 | 15.2%) for men and 55 to 59 Years (90 | 10.7%) for women.
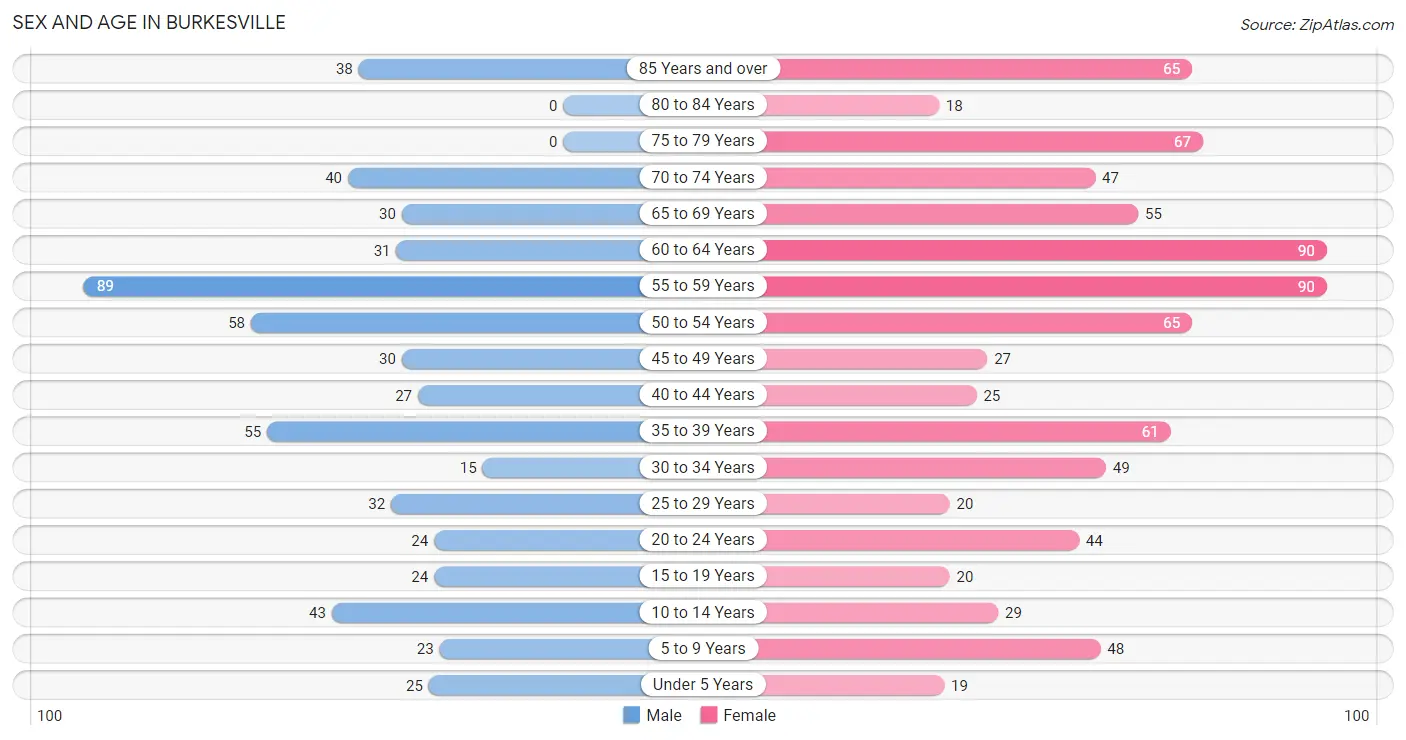
| Age Bracket | Male | Female |
| Under 5 Years | 25 (4.3%) | 19 (2.3%) |
| 5 to 9 Years | 23 (3.9%) | 48 (5.7%) |
| 10 to 14 Years | 43 (7.4%) | 29 (3.5%) |
| 15 to 19 Years | 24 (4.1%) | 20 (2.4%) |
| 20 to 24 Years | 24 (4.1%) | 44 (5.2%) |
| 25 to 29 Years | 32 (5.5%) | 20 (2.4%) |
| 30 to 34 Years | 15 (2.6%) | 49 (5.8%) |
| 35 to 39 Years | 55 (9.4%) | 61 (7.3%) |
| 40 to 44 Years | 27 (4.6%) | 25 (3.0%) |
| 45 to 49 Years | 30 (5.1%) | 27 (3.2%) |
| 50 to 54 Years | 58 (9.9%) | 65 (7.7%) |
| 55 to 59 Years | 89 (15.2%) | 90 (10.7%) |
| 60 to 64 Years | 31 (5.3%) | 90 (10.7%) |
| 65 to 69 Years | 30 (5.1%) | 55 (6.6%) |
| 70 to 74 Years | 40 (6.9%) | 47 (5.6%) |
| 75 to 79 Years | 0 (0.0%) | 67 (8.0%) |
| 80 to 84 Years | 0 (0.0%) | 18 (2.1%) |
| 85 Years and over | 38 (6.5%) | 65 (7.7%) |
| Total | 584 (100.0%) | 839 (100.0%) |
Families and Households in Burkesville
Median Family Size in Burkesville
The median family size in Burkesville is 2.68 persons per family, with married-couple families (154 | 49.2%) accounting for the largest median family size of 2.99 persons per family. On the other hand, single male/father families (42 | 13.4%) represent the smallest median family size with 2.33 persons per family.
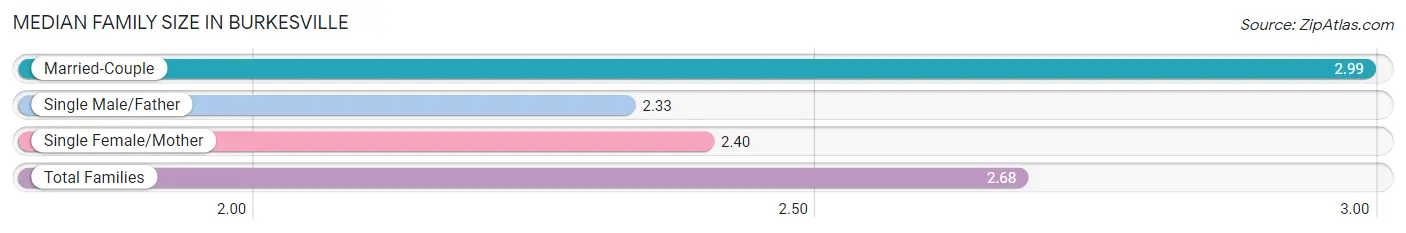
| Family Type | # Families | Family Size |
| Married-Couple | 154 (49.2%) | 2.99 |
| Single Male/Father | 42 (13.4%) | 2.33 |
| Single Female/Mother | 117 (37.4%) | 2.40 |
| Total Families | 313 (100.0%) | 2.68 |
Median Household Size in Burkesville
The median household size in Burkesville is 1.82 persons per household, with married-couple households (154 | 20.9%) accounting for the largest median household size of 3.12 persons per household. non-family households (424 | 57.5%) represent the smallest median household size with 1.08 persons per household.
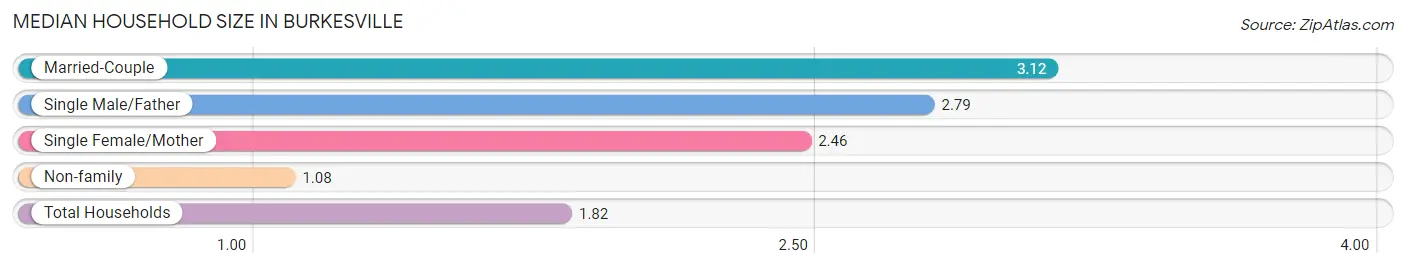
| Household Type | # Households | Household Size |
| Married-Couple | 154 (20.9%) | 3.12 |
| Single Male/Father | 42 (5.7%) | 2.79 |
| Single Female/Mother | 117 (15.9%) | 2.46 |
| Non-family | 424 (57.5%) | 1.08 |
| Total Households | 737 (100.0%) | 1.82 |
Household Size by Marriage Status in Burkesville
Out of a total of 737 households in Burkesville, 313 (42.5%) are family households, while 424 (57.5%) are nonfamily households. The most numerous type of family households are 2-person households, comprising 153, and the most common type of nonfamily households are 1-person households, comprising 396.
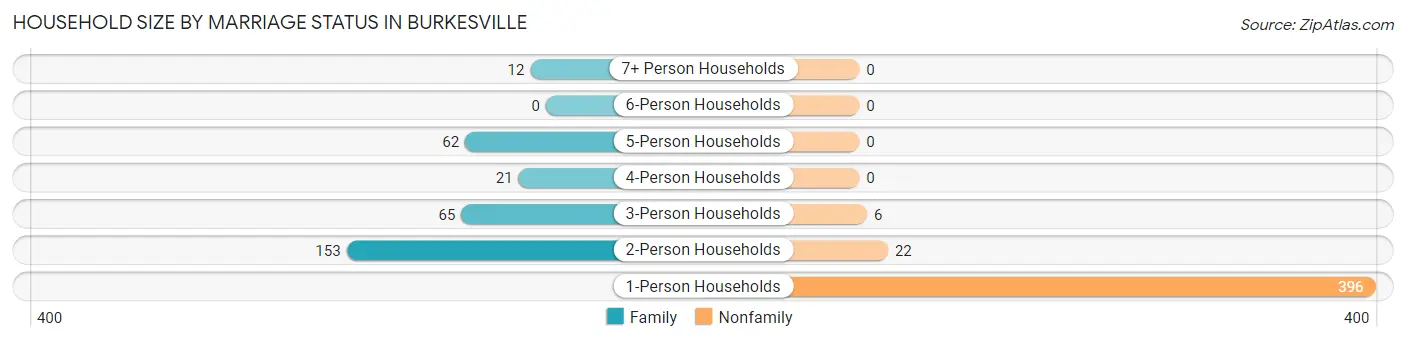
| Household Size | Family Households | Nonfamily Households |
| 1-Person Households | - | 396 (53.7%) |
| 2-Person Households | 153 (20.8%) | 22 (3.0%) |
| 3-Person Households | 65 (8.8%) | 6 (0.8%) |
| 4-Person Households | 21 (2.9%) | 0 (0.0%) |
| 5-Person Households | 62 (8.4%) | 0 (0.0%) |
| 6-Person Households | 0 (0.0%) | 0 (0.0%) |
| 7+ Person Households | 12 (1.6%) | 0 (0.0%) |
| Total | 313 (42.5%) | 424 (57.5%) |
Female Fertility in Burkesville
Fertility by Age in Burkesville
Average fertility rate in Burkesville is 29.0 births per 1,000 women. Women in the age bracket of 20 to 34 years have the highest fertility rate with 71.0 births per 1,000 women. Women in the age bracket of 20 to 34 years acount for 100.0% of all women with births.
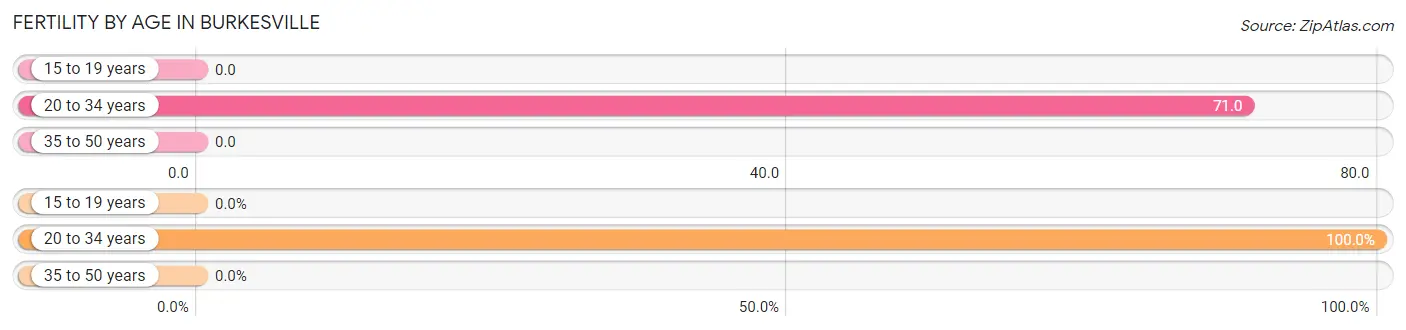
| Age Bracket | Women with Births | Births / 1,000 Women |
| 15 to 19 years | 0 (0.0%) | 0.0 |
| 20 to 34 years | 8 (100.0%) | 71.0 |
| 35 to 50 years | 0 (0.0%) | 0.0 |
| Total | 8 (100.0%) | 29.0 |
Fertility by Age by Marriage Status in Burkesville
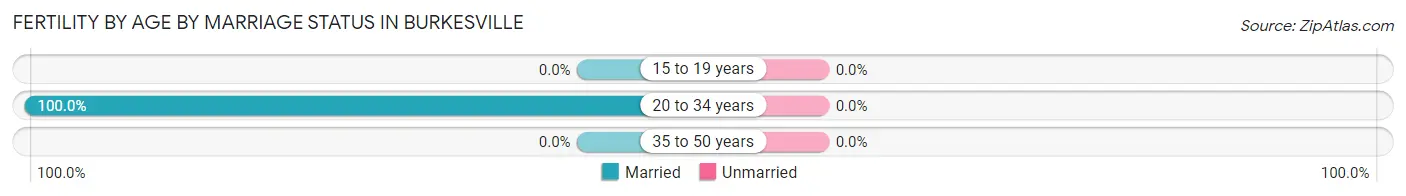
| Age Bracket | Married | Unmarried |
| 15 to 19 years | 0 (0.0%) | 0 (0.0%) |
| 20 to 34 years | 8 (100.0%) | 0 (0.0%) |
| 35 to 50 years | 0 (0.0%) | 0 (0.0%) |
| Total | 8 (100.0%) | 0 (0.0%) |
Fertility by Education in Burkesville
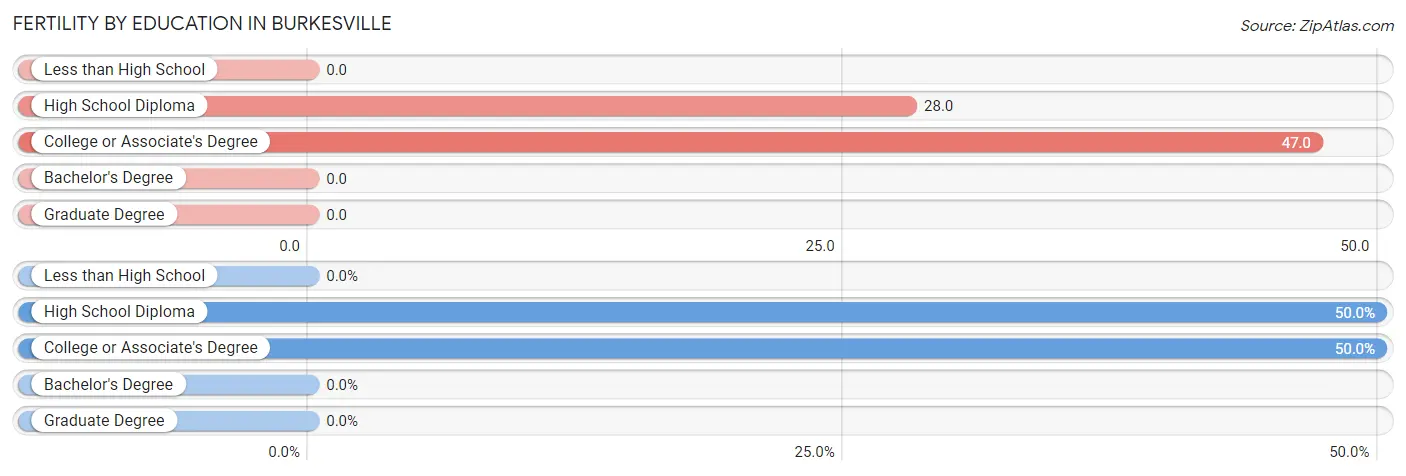
| Educational Attainment | Women with Births | Births / 1,000 Women |
| Less than High School | 0 (0.0%) | 0.0 |
| High School Diploma | 4 (50.0%) | 28.0 |
| College or Associate's Degree | 4 (50.0%) | 47.0 |
| Bachelor's Degree | 0 (0.0%) | 0.0 |
| Graduate Degree | 0 (0.0%) | 0.0 |
| Total | 8 (100.0%) | 29.0 |
Fertility by Education by Marriage Status in Burkesville
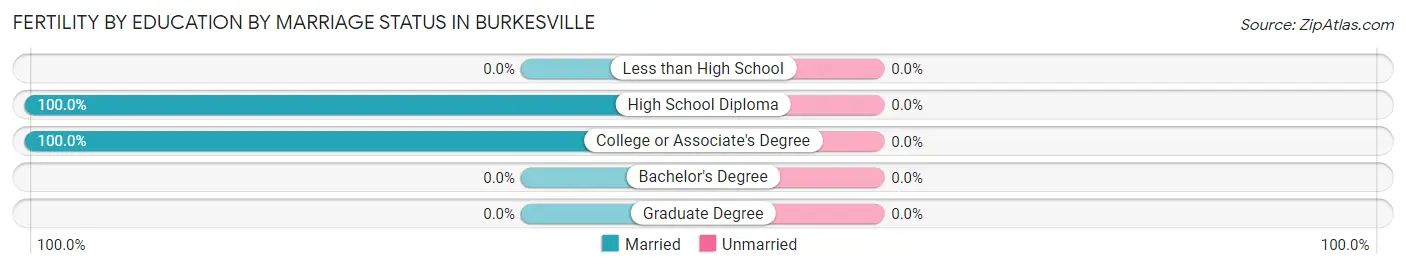
| Educational Attainment | Married | Unmarried |
| Less than High School | 0 (0.0%) | 0 (0.0%) |
| High School Diploma | 4 (100.0%) | 0 (0.0%) |
| College or Associate's Degree | 4 (100.0%) | 0 (0.0%) |
| Bachelor's Degree | 0 (0.0%) | 0 (0.0%) |
| Graduate Degree | 0 (0.0%) | 0 (0.0%) |
| Total | 8 (100.0%) | 0 (0.0%) |
Employment Characteristics in Burkesville
Employment by Class of Employer in Burkesville
Among the 445 employed individuals in Burkesville, private company employees (296 | 66.5%), not-for-profit organizations (66 | 14.8%), and self-employed (not incorporated) (42 | 9.4%) make up the most common classes of employment.
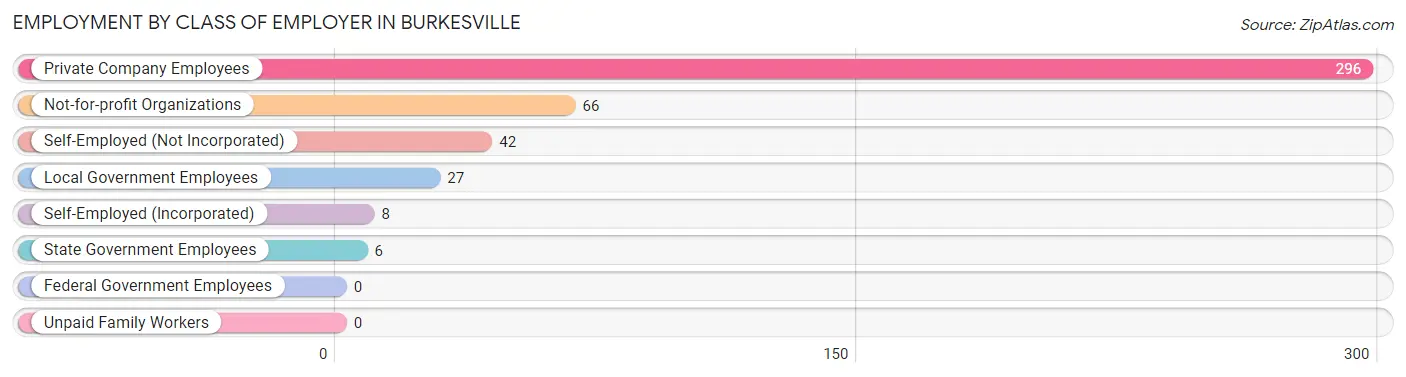
| Employer Class | # Employees | % Employees |
| Private Company Employees | 296 | 66.5% |
| Self-Employed (Incorporated) | 8 | 1.8% |
| Self-Employed (Not Incorporated) | 42 | 9.4% |
| Not-for-profit Organizations | 66 | 14.8% |
| Local Government Employees | 27 | 6.1% |
| State Government Employees | 6 | 1.3% |
| Federal Government Employees | 0 | 0.0% |
| Unpaid Family Workers | 0 | 0.0% |
| Total | 445 | 100.0% |
Employment Status by Age in Burkesville
According to the labor force statistics for Burkesville, out of the total population over 16 years of age (1,228), 40.9% or 502 individuals are in the labor force, with 2.4% or 12 of them unemployed. The age group with the highest labor force participation rate is 25 to 29 years, with 94.2% or 49 individuals in the labor force. Within the labor force, the 16 to 19 years age range has the highest percentage of unemployed individuals, with 29.4% or 5 of them being unemployed.
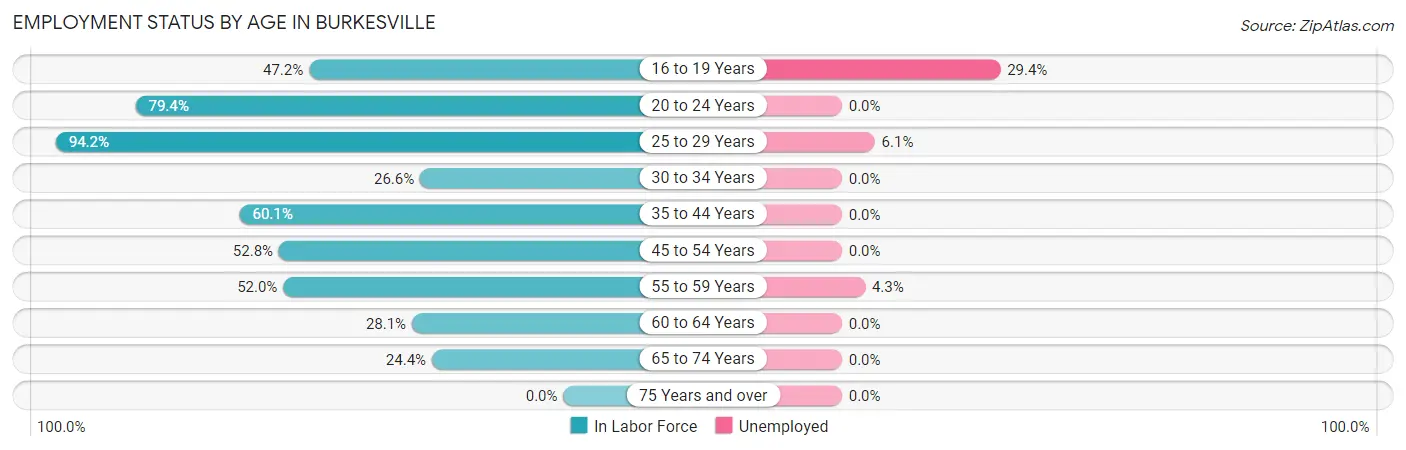
| Age Bracket | In Labor Force | Unemployed |
| 16 to 19 Years | 17 (47.2%) | 5 (29.4%) |
| 20 to 24 Years | 54 (79.4%) | 0 (0.0%) |
| 25 to 29 Years | 49 (94.2%) | 3 (6.1%) |
| 30 to 34 Years | 17 (26.6%) | 0 (0.0%) |
| 35 to 44 Years | 101 (60.1%) | 0 (0.0%) |
| 45 to 54 Years | 95 (52.8%) | 0 (0.0%) |
| 55 to 59 Years | 93 (52.0%) | 4 (4.3%) |
| 60 to 64 Years | 34 (28.1%) | 0 (0.0%) |
| 65 to 74 Years | 42 (24.4%) | 0 (0.0%) |
| 75 Years and over | 0 (0.0%) | 0 (0.0%) |
| Total | 502 (40.9%) | 12 (2.4%) |
Employment Status by Educational Attainment in Burkesville
According to labor force statistics for Burkesville, 50.9% of individuals (389) out of the total population between 25 and 64 years of age (764) are in the labor force, with 1.8% or 7 of them being unemployed. The group with the highest labor force participation rate are those with the educational attainment of college / associate degree, with 67.5% or 108 individuals in the labor force. Within the labor force, individuals with college / associate degree education have the highest percentage of unemployment, with 3.7% or 4 of them being unemployed.
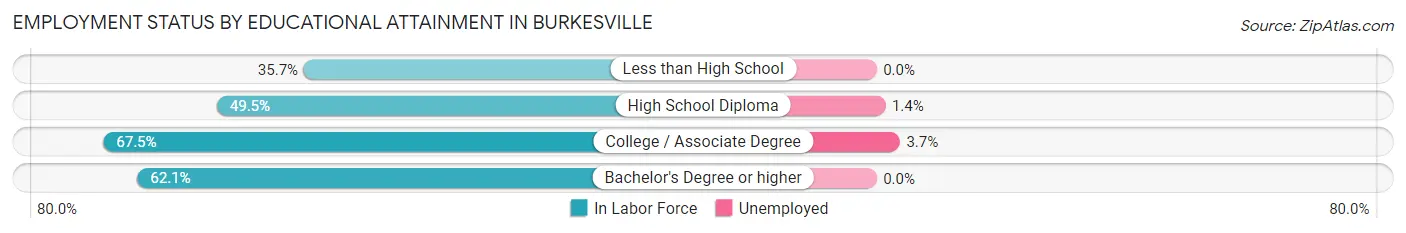
| Educational Attainment | In Labor Force | Unemployed |
| Less than High School | 56 (35.7%) | 0 (0.0%) |
| High School Diploma | 207 (49.5%) | 6 (1.4%) |
| College / Associate Degree | 108 (67.5%) | 6 (3.7%) |
| Bachelor's Degree or higher | 18 (62.1%) | 0 (0.0%) |
| Total | 389 (50.9%) | 14 (1.8%) |
Employment Occupations by Sex in Burkesville
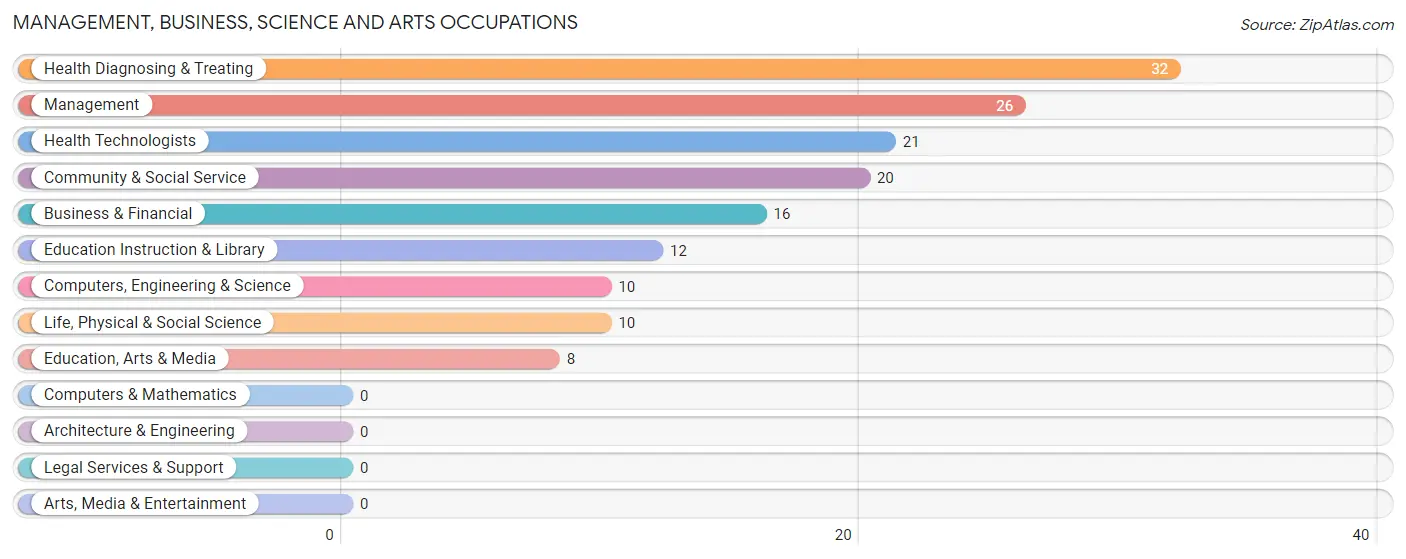
Management, Business, Science and Arts Occupations
The most common Management, Business, Science and Arts occupations in Burkesville are Health Diagnosing & Treating (32 | 6.5%), Management (26 | 5.3%), Health Technologists (21 | 4.3%), Community & Social Service (20 | 4.1%), and Business & Financial (16 | 3.3%).
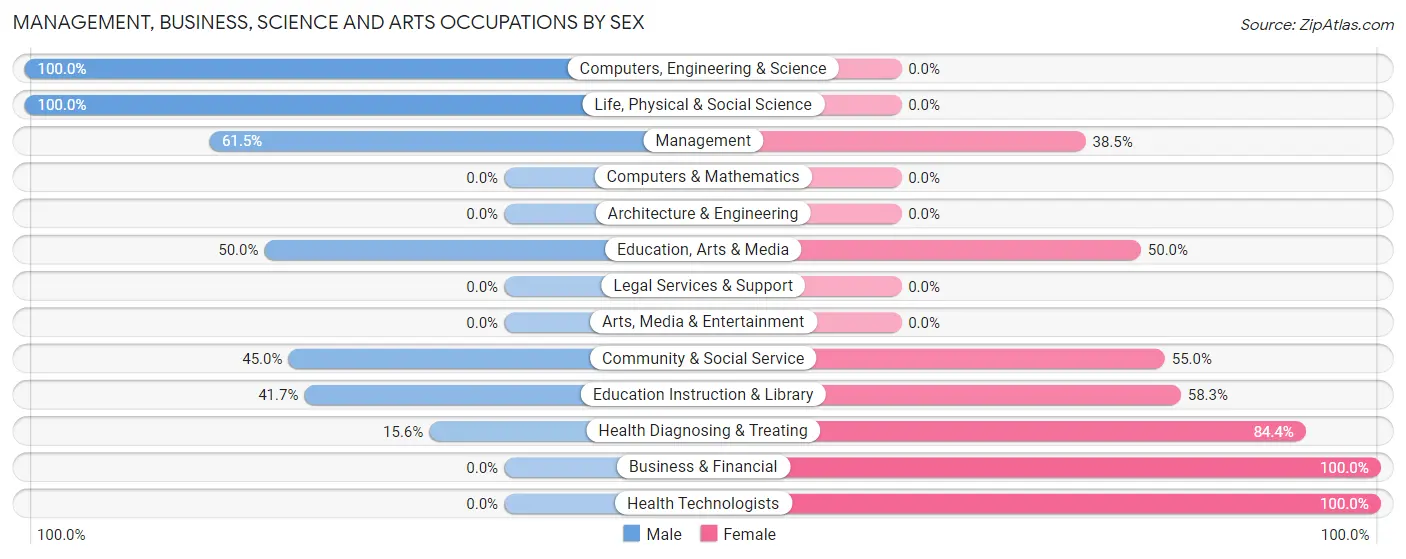
Management, Business, Science and Arts Occupations by Sex
Within the Management, Business, Science and Arts occupations in Burkesville, the most male-oriented occupations are Computers, Engineering & Science (100.0%), Life, Physical & Social Science (100.0%), and Management (61.5%), while the most female-oriented occupations are Business & Financial (100.0%), Health Technologists (100.0%), and Health Diagnosing & Treating (84.4%).
| Occupation | Male | Female |
| Management | 16 (61.5%) | 10 (38.5%) |
| Business & Financial | 0 (0.0%) | 16 (100.0%) |
| Computers, Engineering & Science | 10 (100.0%) | 0 (0.0%) |
| Computers & Mathematics | 0 (0.0%) | 0 (0.0%) |
| Architecture & Engineering | 0 (0.0%) | 0 (0.0%) |
| Life, Physical & Social Science | 10 (100.0%) | 0 (0.0%) |
| Community & Social Service | 9 (45.0%) | 11 (55.0%) |
| Education, Arts & Media | 4 (50.0%) | 4 (50.0%) |
| Legal Services & Support | 0 (0.0%) | 0 (0.0%) |
| Education Instruction & Library | 5 (41.7%) | 7 (58.3%) |
| Arts, Media & Entertainment | 0 (0.0%) | 0 (0.0%) |
| Health Diagnosing & Treating | 5 (15.6%) | 27 (84.4%) |
| Health Technologists | 0 (0.0%) | 21 (100.0%) |
| Total (Category) | 40 (38.5%) | 64 (61.5%) |
| Total (Overall) | 266 (54.3%) | 224 (45.7%) |
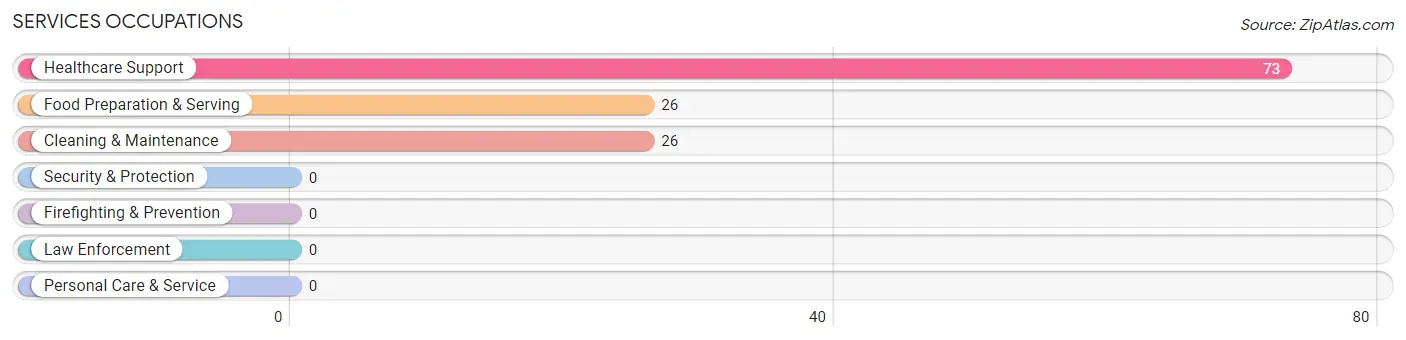
Services Occupations
The most common Services occupations in Burkesville are Healthcare Support (73 | 14.9%), Food Preparation & Serving (26 | 5.3%), and Cleaning & Maintenance (26 | 5.3%).
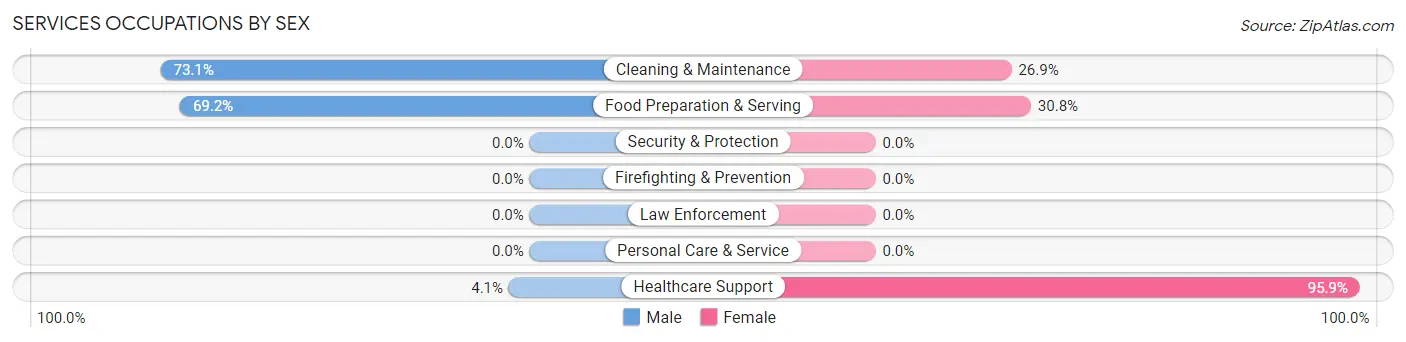
Services Occupations by Sex
Within the Services occupations in Burkesville, the most male-oriented occupations are Cleaning & Maintenance (73.1%), Food Preparation & Serving (69.2%), and Healthcare Support (4.1%), while the most female-oriented occupations are Healthcare Support (95.9%), Food Preparation & Serving (30.8%), and Cleaning & Maintenance (26.9%).
| Occupation | Male | Female |
| Healthcare Support | 3 (4.1%) | 70 (95.9%) |
| Security & Protection | 0 (0.0%) | 0 (0.0%) |
| Firefighting & Prevention | 0 (0.0%) | 0 (0.0%) |
| Law Enforcement | 0 (0.0%) | 0 (0.0%) |
| Food Preparation & Serving | 18 (69.2%) | 8 (30.8%) |
| Cleaning & Maintenance | 19 (73.1%) | 7 (26.9%) |
| Personal Care & Service | 0 (0.0%) | 0 (0.0%) |
| Total (Category) | 40 (32.0%) | 85 (68.0%) |
| Total (Overall) | 266 (54.3%) | 224 (45.7%) |
Sales and Office Occupations
The most common Sales and Office occupations in Burkesville are Office & Administration (33 | 6.7%), and Sales & Related (31 | 6.3%).

Sales and Office Occupations by Sex
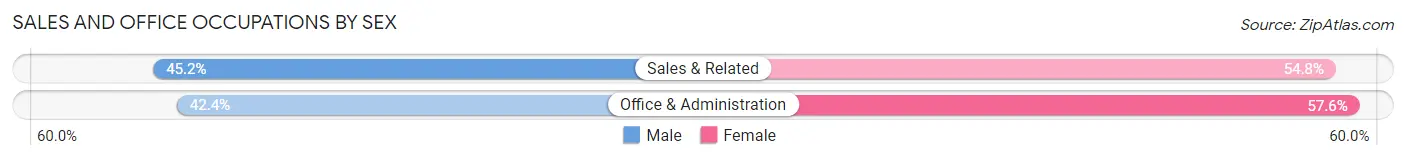
| Occupation | Male | Female |
| Sales & Related | 14 (45.2%) | 17 (54.8%) |
| Office & Administration | 14 (42.4%) | 19 (57.6%) |
| Total (Category) | 28 (43.8%) | 36 (56.2%) |
| Total (Overall) | 266 (54.3%) | 224 (45.7%) |
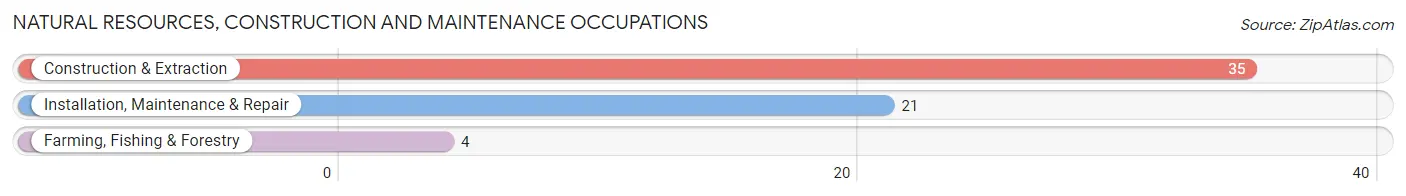
Natural Resources, Construction and Maintenance Occupations
The most common Natural Resources, Construction and Maintenance occupations in Burkesville are Construction & Extraction (35 | 7.1%), Installation, Maintenance & Repair (21 | 4.3%), and Farming, Fishing & Forestry (4 | 0.8%).
Natural Resources, Construction and Maintenance Occupations by Sex
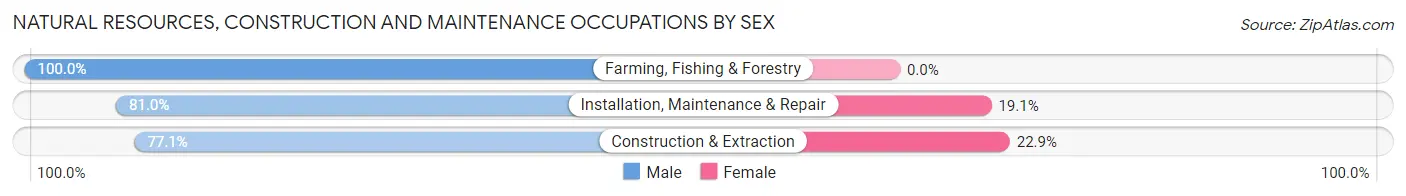
| Occupation | Male | Female |
| Farming, Fishing & Forestry | 4 (100.0%) | 0 (0.0%) |
| Construction & Extraction | 27 (77.1%) | 8 (22.9%) |
| Installation, Maintenance & Repair | 17 (80.9%) | 4 (19.1%) |
| Total (Category) | 48 (80.0%) | 12 (20.0%) |
| Total (Overall) | 266 (54.3%) | 224 (45.7%) |
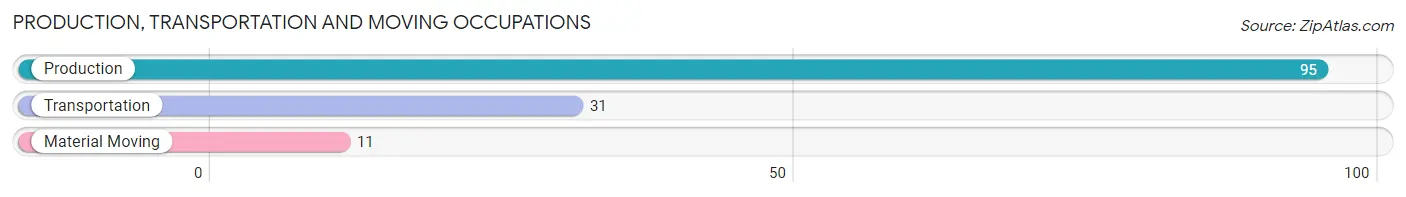
Production, Transportation and Moving Occupations
The most common Production, Transportation and Moving occupations in Burkesville are Production (95 | 19.4%), Transportation (31 | 6.3%), and Material Moving (11 | 2.2%).
Production, Transportation and Moving Occupations by Sex
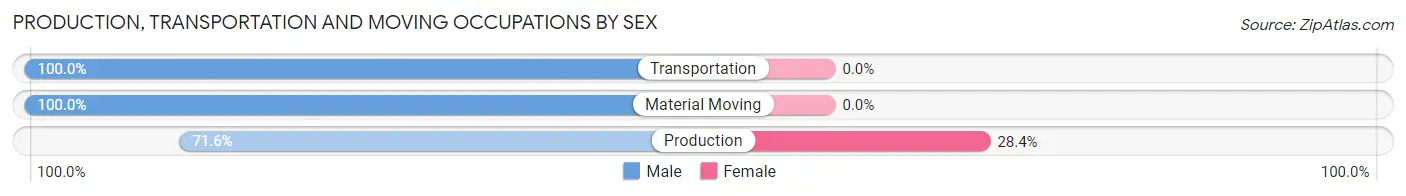
| Occupation | Male | Female |
| Production | 68 (71.6%) | 27 (28.4%) |
| Transportation | 31 (100.0%) | 0 (0.0%) |
| Material Moving | 11 (100.0%) | 0 (0.0%) |
| Total (Category) | 110 (80.3%) | 27 (19.7%) |
| Total (Overall) | 266 (54.3%) | 224 (45.7%) |
Employment Industries by Sex in Burkesville
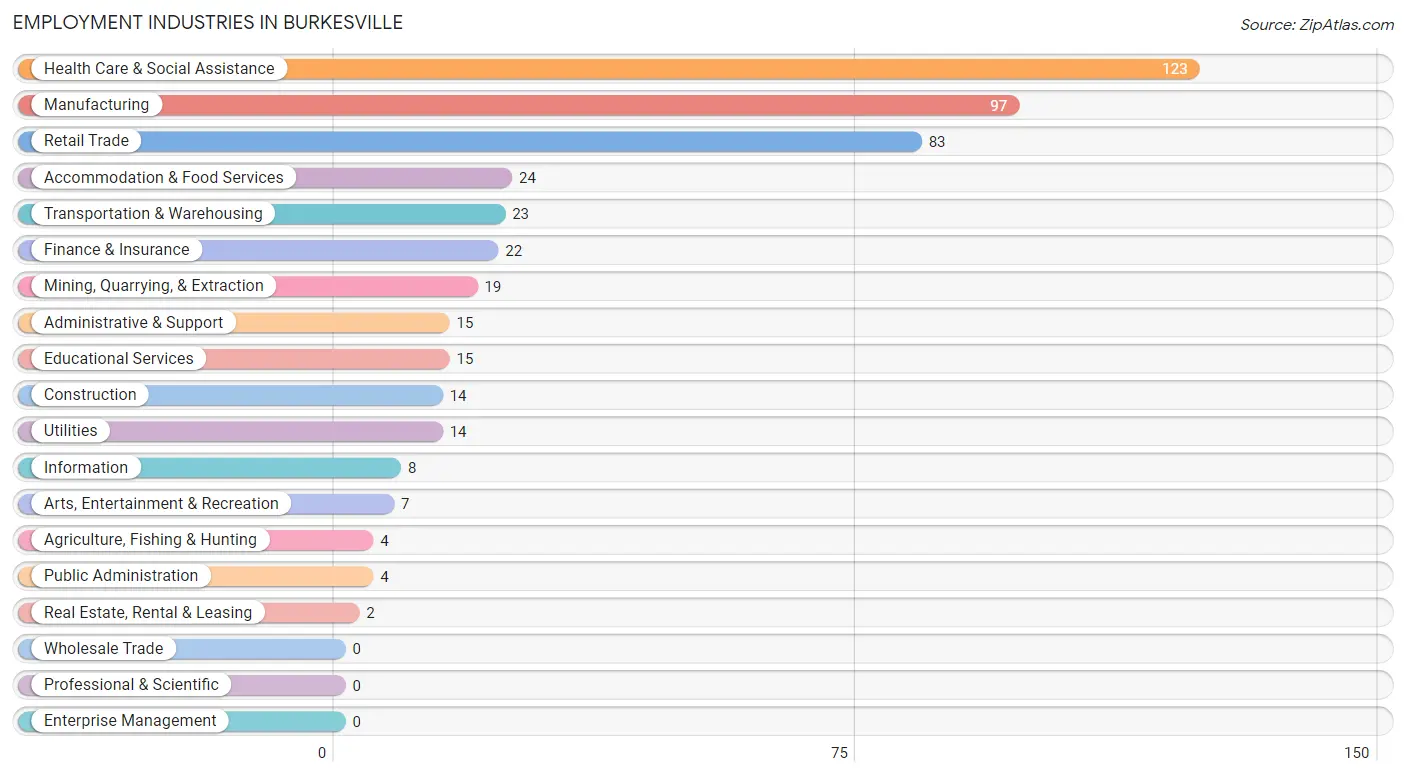
Employment Industries in Burkesville
The major employment industries in Burkesville include Health Care & Social Assistance (123 | 25.1%), Manufacturing (97 | 19.8%), Retail Trade (83 | 16.9%), Accommodation & Food Services (24 | 4.9%), and Transportation & Warehousing (23 | 4.7%).
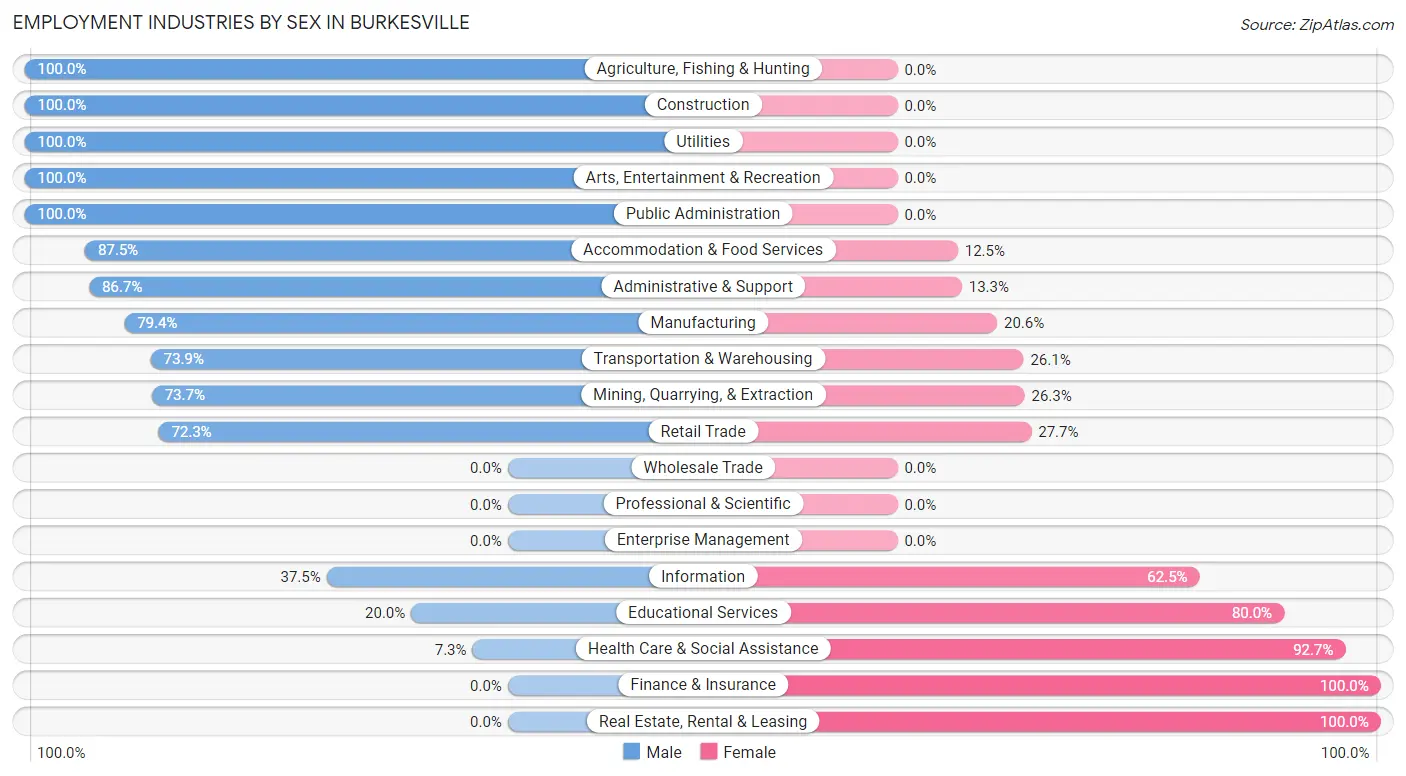
Employment Industries by Sex in Burkesville
The Burkesville industries that see more men than women are Agriculture, Fishing & Hunting (100.0%), Construction (100.0%), and Utilities (100.0%), whereas the industries that tend to have a higher number of women are Finance & Insurance (100.0%), Real Estate, Rental & Leasing (100.0%), and Health Care & Social Assistance (92.7%).
| Industry | Male | Female |
| Agriculture, Fishing & Hunting | 4 (100.0%) | 0 (0.0%) |
| Mining, Quarrying, & Extraction | 14 (73.7%) | 5 (26.3%) |
| Construction | 14 (100.0%) | 0 (0.0%) |
| Manufacturing | 77 (79.4%) | 20 (20.6%) |
| Wholesale Trade | 0 (0.0%) | 0 (0.0%) |
| Retail Trade | 60 (72.3%) | 23 (27.7%) |
| Transportation & Warehousing | 17 (73.9%) | 6 (26.1%) |
| Utilities | 14 (100.0%) | 0 (0.0%) |
| Information | 3 (37.5%) | 5 (62.5%) |
| Finance & Insurance | 0 (0.0%) | 22 (100.0%) |
| Real Estate, Rental & Leasing | 0 (0.0%) | 2 (100.0%) |
| Professional & Scientific | 0 (0.0%) | 0 (0.0%) |
| Enterprise Management | 0 (0.0%) | 0 (0.0%) |
| Administrative & Support | 13 (86.7%) | 2 (13.3%) |
| Educational Services | 3 (20.0%) | 12 (80.0%) |
| Health Care & Social Assistance | 9 (7.3%) | 114 (92.7%) |
| Arts, Entertainment & Recreation | 7 (100.0%) | 0 (0.0%) |
| Accommodation & Food Services | 21 (87.5%) | 3 (12.5%) |
| Public Administration | 4 (100.0%) | 0 (0.0%) |
| Total | 266 (54.3%) | 224 (45.7%) |
Education in Burkesville
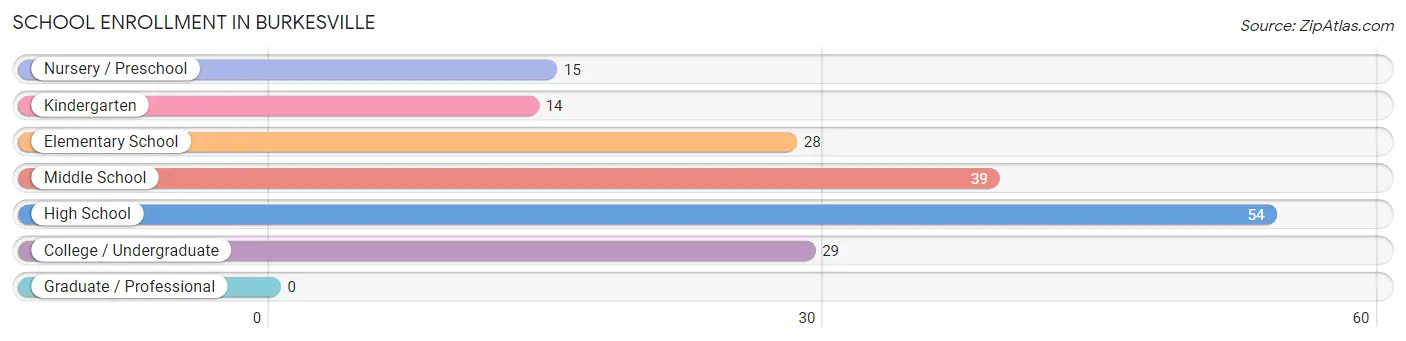
School Enrollment in Burkesville
The most common levels of schooling among the 179 students in Burkesville are high school (54 | 30.2%), middle school (39 | 21.8%), and college / undergraduate (29 | 16.2%).
| School Level | # Students | % Students |
| Nursery / Preschool | 15 | 8.4% |
| Kindergarten | 14 | 7.8% |
| Elementary School | 28 | 15.6% |
| Middle School | 39 | 21.8% |
| High School | 54 | 30.2% |
| College / Undergraduate | 29 | 16.2% |
| Graduate / Professional | 0 | 0.0% |
| Total | 179 | 100.0% |
School Enrollment by Age by Funding Source in Burkesville
Out of a total of 179 students who are enrolled in schools in Burkesville, 1 (0.6%) attend a private institution, while the remaining 178 (99.4%) are enrolled in public schools. The age group of 5 to 9 year old has the highest likelihood of being enrolled in private schools, with 1 (1.9% in the age bracket) enrolled. Conversely, the age group of 3 to 4 year olds has the lowest likelihood of being enrolled in a private school, with 3 (100.0% in the age bracket) attending a public institution.
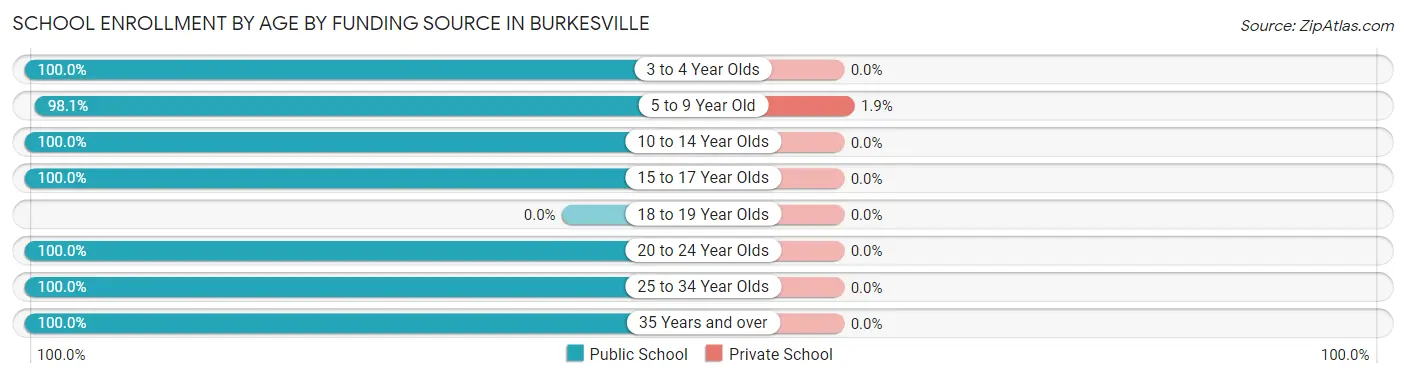
| Age Bracket | Public School | Private School |
| 3 to 4 Year Olds | 3 (100.0%) | 0 (0.0%) |
| 5 to 9 Year Old | 51 (98.1%) | 1 (1.9%) |
| 10 to 14 Year Olds | 63 (100.0%) | 0 (0.0%) |
| 15 to 17 Year Olds | 29 (100.0%) | 0 (0.0%) |
| 18 to 19 Year Olds | 0 (0.0%) | 0 (0.0%) |
| 20 to 24 Year Olds | 25 (100.0%) | 0 (0.0%) |
| 25 to 34 Year Olds | 3 (100.0%) | 0 (0.0%) |
| 35 Years and over | 4 (100.0%) | 0 (0.0%) |
| Total | 178 (99.4%) | 1 (0.6%) |
Educational Attainment by Field of Study in Burkesville
Education (37 | 51.4%), science & technology (20 | 27.8%), engineering (7 | 9.7%), psychology (4 | 5.6%), and arts & humanities (4 | 5.6%) are the most common fields of study among 72 individuals in Burkesville who have obtained a bachelor's degree or higher.
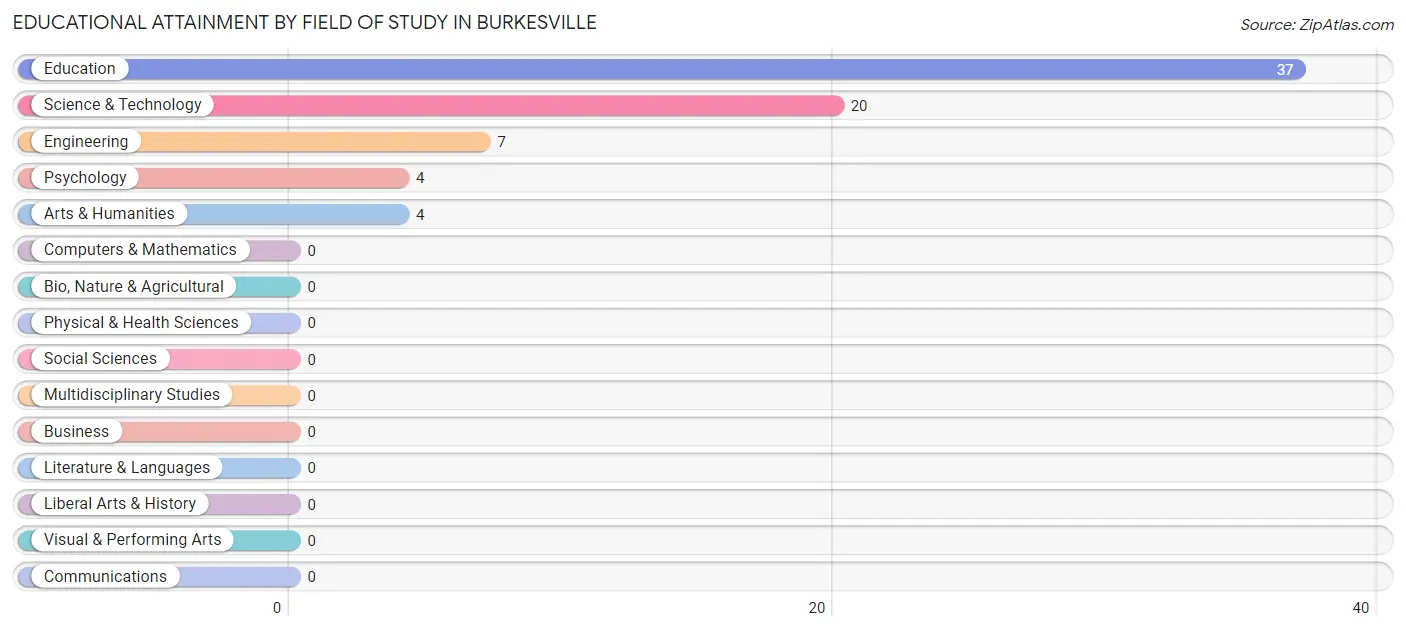
| Field of Study | # Graduates | % Graduates |
| Computers & Mathematics | 0 | 0.0% |
| Bio, Nature & Agricultural | 0 | 0.0% |
| Physical & Health Sciences | 0 | 0.0% |
| Psychology | 4 | 5.6% |
| Social Sciences | 0 | 0.0% |
| Engineering | 7 | 9.7% |
| Multidisciplinary Studies | 0 | 0.0% |
| Science & Technology | 20 | 27.8% |
| Business | 0 | 0.0% |
| Education | 37 | 51.4% |
| Literature & Languages | 0 | 0.0% |
| Liberal Arts & History | 0 | 0.0% |
| Visual & Performing Arts | 0 | 0.0% |
| Communications | 0 | 0.0% |
| Arts & Humanities | 4 | 5.6% |
| Total | 72 | 100.0% |
Transportation & Commute in Burkesville
Vehicle Availability by Sex in Burkesville
The most prevalent vehicle ownership categories in Burkesville are males with 3 vehicles (99, accounting for 37.2%) and females with 3 vehicles (77, making up 55.3%).
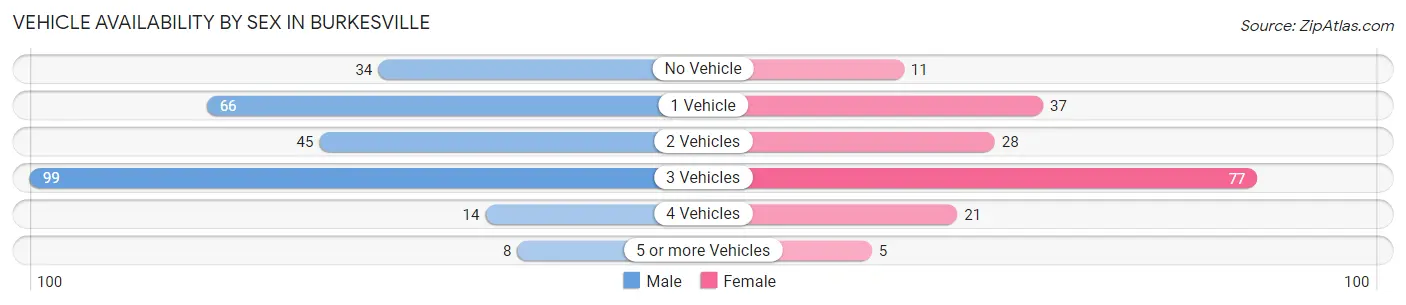
| Vehicles Available | Male | Female |
| No Vehicle | 34 (12.8%) | 11 (6.1%) |
| 1 Vehicle | 66 (24.8%) | 37 (20.7%) |
| 2 Vehicles | 45 (16.9%) | 28 (15.6%) |
| 3 Vehicles | 99 (37.2%) | 77 (43.0%) |
| 4 Vehicles | 14 (5.3%) | 21 (11.7%) |
| 5 or more Vehicles | 8 (3.0%) | 5 (2.8%) |
| Total | 266 (100.0%) | 179 (100.0%) |
Commute Time in Burkesville
The most frequently occuring commute durations in Burkesville are less than 5 minutes (86 commuters, 20.1%), 5 to 9 minutes (82 commuters, 19.2%), and 10 to 14 minutes (73 commuters, 17.1%).
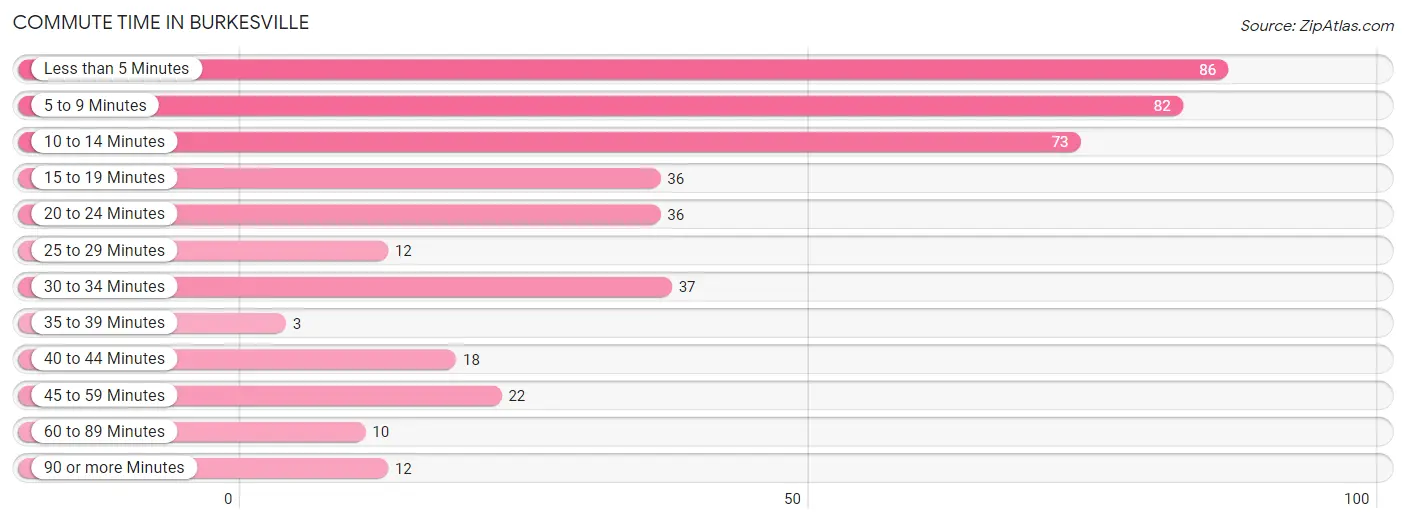
| Commute Time | # Commuters | % Commuters |
| Less than 5 Minutes | 86 | 20.1% |
| 5 to 9 Minutes | 82 | 19.2% |
| 10 to 14 Minutes | 73 | 17.1% |
| 15 to 19 Minutes | 36 | 8.4% |
| 20 to 24 Minutes | 36 | 8.4% |
| 25 to 29 Minutes | 12 | 2.8% |
| 30 to 34 Minutes | 37 | 8.7% |
| 35 to 39 Minutes | 3 | 0.7% |
| 40 to 44 Minutes | 18 | 4.2% |
| 45 to 59 Minutes | 22 | 5.1% |
| 60 to 89 Minutes | 10 | 2.3% |
| 90 or more Minutes | 12 | 2.8% |
Commute Time by Sex in Burkesville
The most common commute times in Burkesville are 10 to 14 minutes (51 commuters, 20.0%) for males and 5 to 9 minutes (61 commuters, 35.5%) for females.
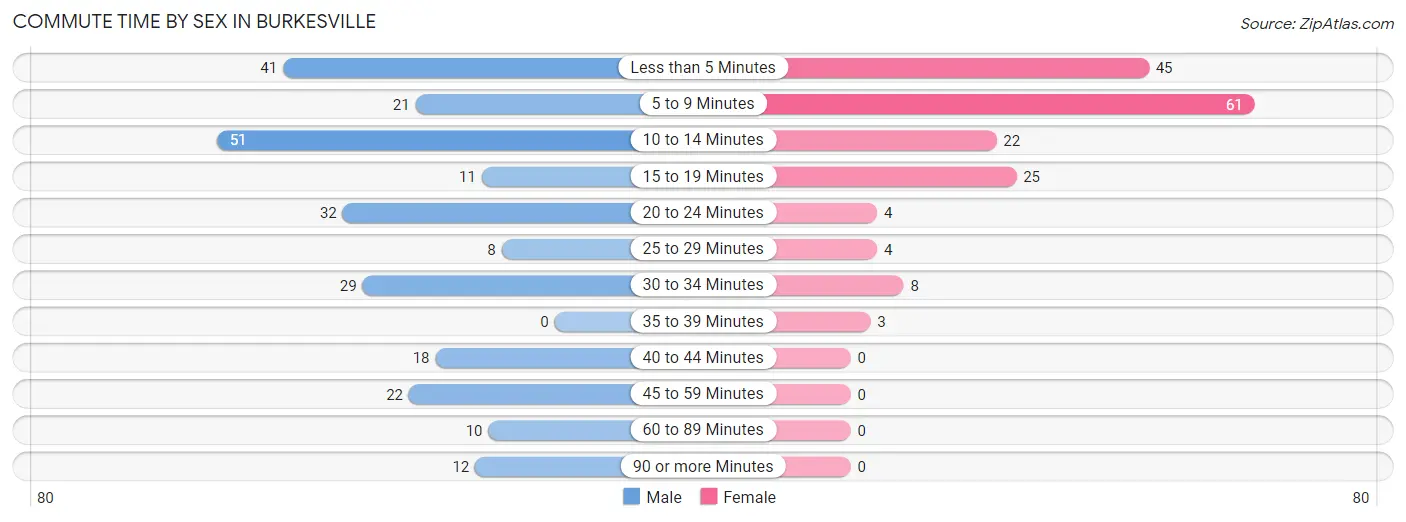
| Commute Time | Male | Female |
| Less than 5 Minutes | 41 (16.1%) | 45 (26.2%) |
| 5 to 9 Minutes | 21 (8.2%) | 61 (35.5%) |
| 10 to 14 Minutes | 51 (20.0%) | 22 (12.8%) |
| 15 to 19 Minutes | 11 (4.3%) | 25 (14.5%) |
| 20 to 24 Minutes | 32 (12.6%) | 4 (2.3%) |
| 25 to 29 Minutes | 8 (3.1%) | 4 (2.3%) |
| 30 to 34 Minutes | 29 (11.4%) | 8 (4.6%) |
| 35 to 39 Minutes | 0 (0.0%) | 3 (1.7%) |
| 40 to 44 Minutes | 18 (7.1%) | 0 (0.0%) |
| 45 to 59 Minutes | 22 (8.6%) | 0 (0.0%) |
| 60 to 89 Minutes | 10 (3.9%) | 0 (0.0%) |
| 90 or more Minutes | 12 (4.7%) | 0 (0.0%) |
Time of Departure to Work by Sex in Burkesville
The most frequent times of departure to work in Burkesville are 5:30 AM to 5:59 AM (55, 21.6%) for males and 7:30 AM to 7:59 AM (43, 25.0%) for females.
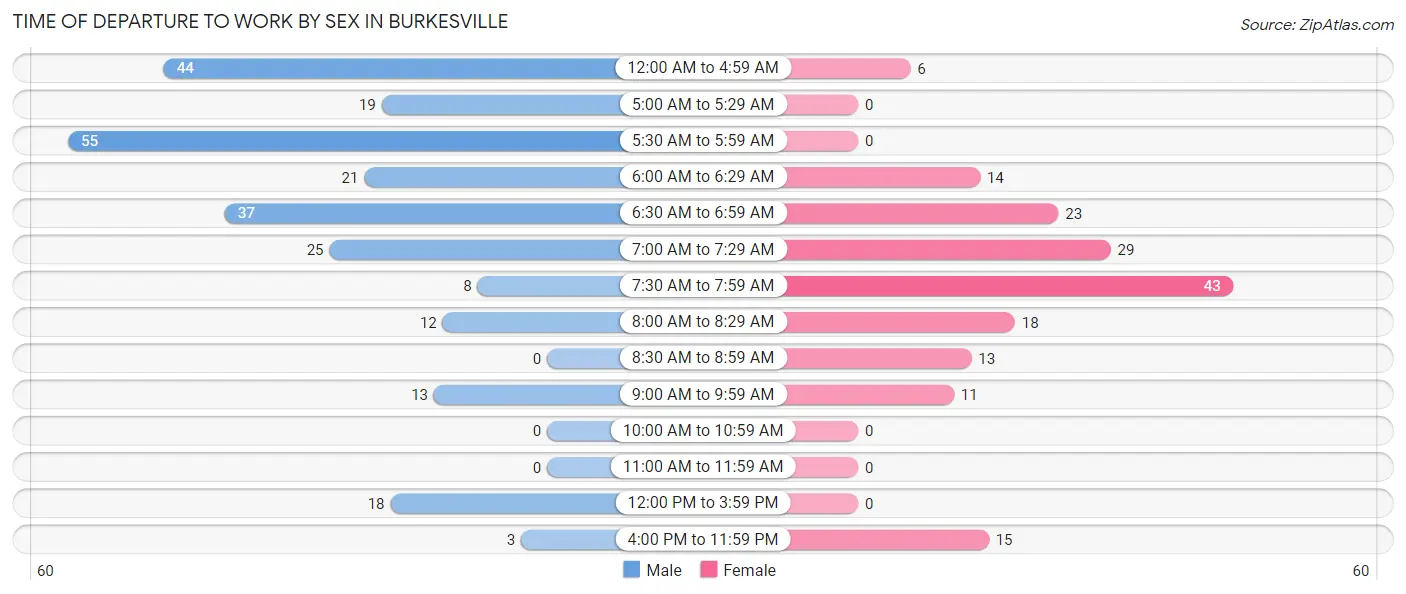
| Time of Departure | Male | Female |
| 12:00 AM to 4:59 AM | 44 (17.2%) | 6 (3.5%) |
| 5:00 AM to 5:29 AM | 19 (7.4%) | 0 (0.0%) |
| 5:30 AM to 5:59 AM | 55 (21.6%) | 0 (0.0%) |
| 6:00 AM to 6:29 AM | 21 (8.2%) | 14 (8.1%) |
| 6:30 AM to 6:59 AM | 37 (14.5%) | 23 (13.4%) |
| 7:00 AM to 7:29 AM | 25 (9.8%) | 29 (16.9%) |
| 7:30 AM to 7:59 AM | 8 (3.1%) | 43 (25.0%) |
| 8:00 AM to 8:29 AM | 12 (4.7%) | 18 (10.5%) |
| 8:30 AM to 8:59 AM | 0 (0.0%) | 13 (7.6%) |
| 9:00 AM to 9:59 AM | 13 (5.1%) | 11 (6.4%) |
| 10:00 AM to 10:59 AM | 0 (0.0%) | 0 (0.0%) |
| 11:00 AM to 11:59 AM | 0 (0.0%) | 0 (0.0%) |
| 12:00 PM to 3:59 PM | 18 (7.1%) | 0 (0.0%) |
| 4:00 PM to 11:59 PM | 3 (1.2%) | 15 (8.7%) |
| Total | 255 (100.0%) | 172 (100.0%) |
Housing Occupancy in Burkesville
Occupancy by Ownership in Burkesville
Of the total 737 dwellings in Burkesville, owner-occupied units account for 366 (49.7%), while renter-occupied units make up 371 (50.3%).
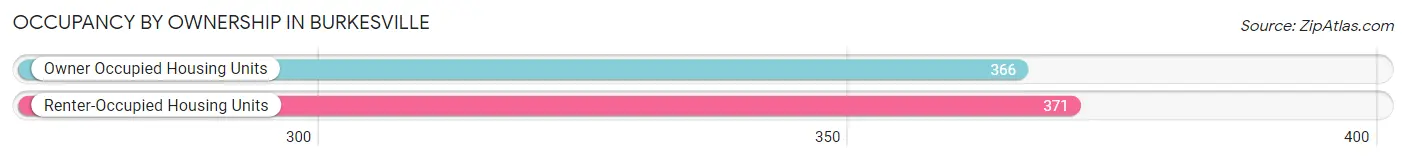
| Occupancy | # Housing Units | % Housing Units |
| Owner Occupied Housing Units | 366 | 49.7% |
| Renter-Occupied Housing Units | 371 | 50.3% |
| Total Occupied Housing Units | 737 | 100.0% |
Occupancy by Household Size in Burkesville
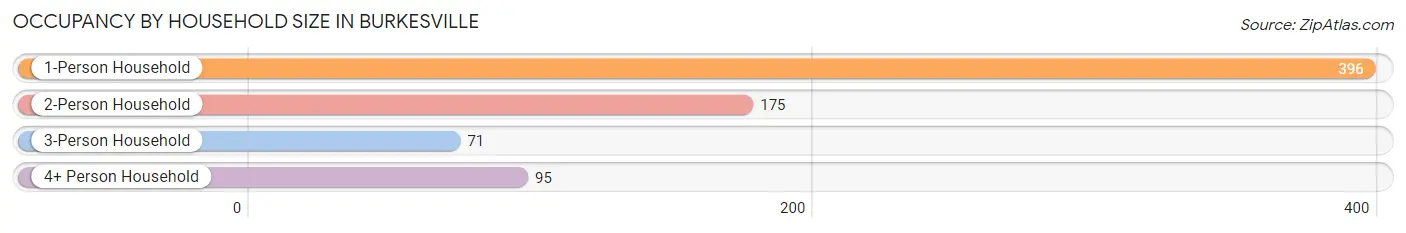
| Household Size | # Housing Units | % Housing Units |
| 1-Person Household | 396 | 53.7% |
| 2-Person Household | 175 | 23.7% |
| 3-Person Household | 71 | 9.6% |
| 4+ Person Household | 95 | 12.9% |
| Total Housing Units | 737 | 100.0% |
Occupancy by Ownership by Household Size in Burkesville
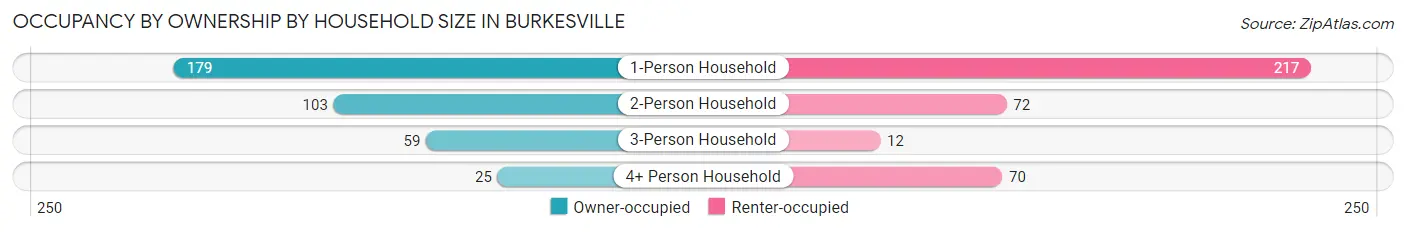
| Household Size | Owner-occupied | Renter-occupied |
| 1-Person Household | 179 (45.2%) | 217 (54.8%) |
| 2-Person Household | 103 (58.9%) | 72 (41.1%) |
| 3-Person Household | 59 (83.1%) | 12 (16.9%) |
| 4+ Person Household | 25 (26.3%) | 70 (73.7%) |
| Total Housing Units | 366 (49.7%) | 371 (50.3%) |
Occupancy by Educational Attainment in Burkesville
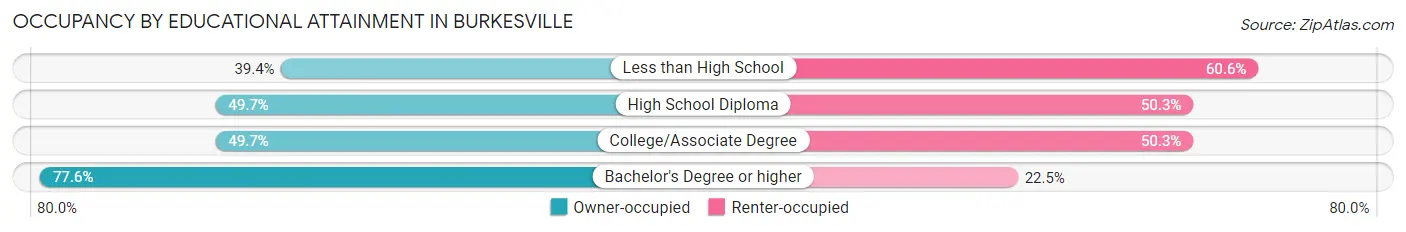
| Household Size | Owner-occupied | Renter-occupied |
| Less than High School | 54 (39.4%) | 83 (60.6%) |
| High School Diploma | 183 (49.7%) | 185 (50.3%) |
| College/Associate Degree | 91 (49.7%) | 92 (50.3%) |
| Bachelor's Degree or higher | 38 (77.5%) | 11 (22.5%) |
Occupancy by Age of Householder in Burkesville
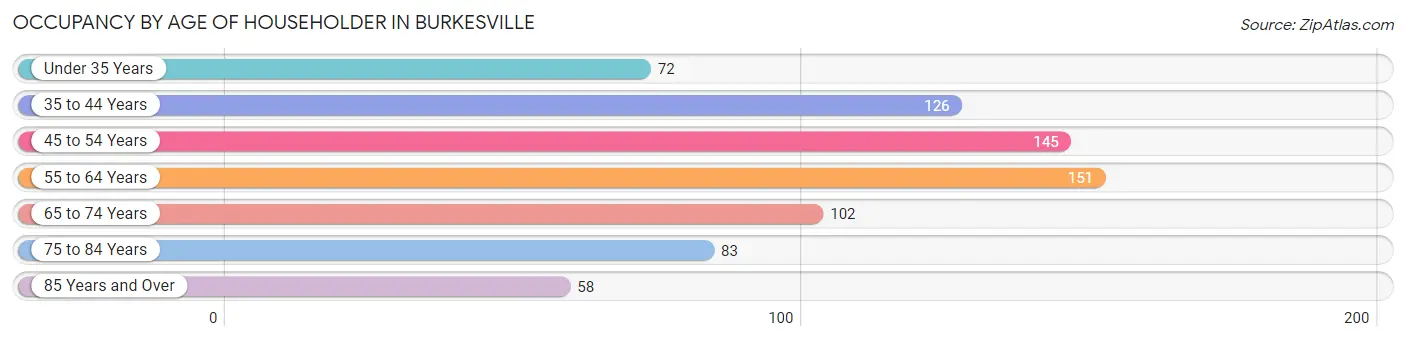
| Age Bracket | # Households | % Households |
| Under 35 Years | 72 | 9.8% |
| 35 to 44 Years | 126 | 17.1% |
| 45 to 54 Years | 145 | 19.7% |
| 55 to 64 Years | 151 | 20.5% |
| 65 to 74 Years | 102 | 13.8% |
| 75 to 84 Years | 83 | 11.3% |
| 85 Years and Over | 58 | 7.9% |
| Total | 737 | 100.0% |
Housing Finances in Burkesville
Median Income by Occupancy in Burkesville
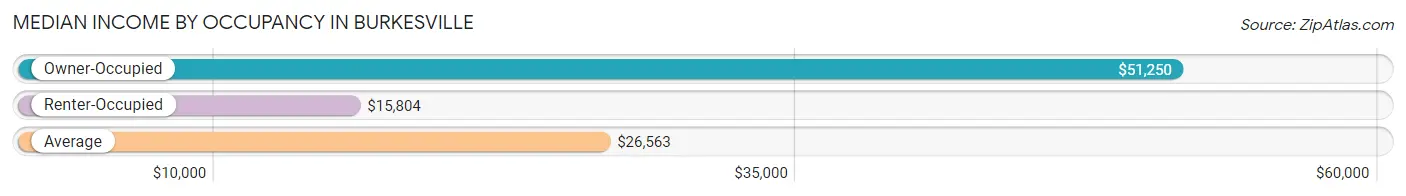
| Occupancy Type | # Households | Median Income |
| Owner-Occupied | 366 (49.7%) | $51,250 |
| Renter-Occupied | 371 (50.3%) | $15,804 |
| Average | 737 (100.0%) | $26,563 |
Occupancy by Householder Income Bracket in Burkesville
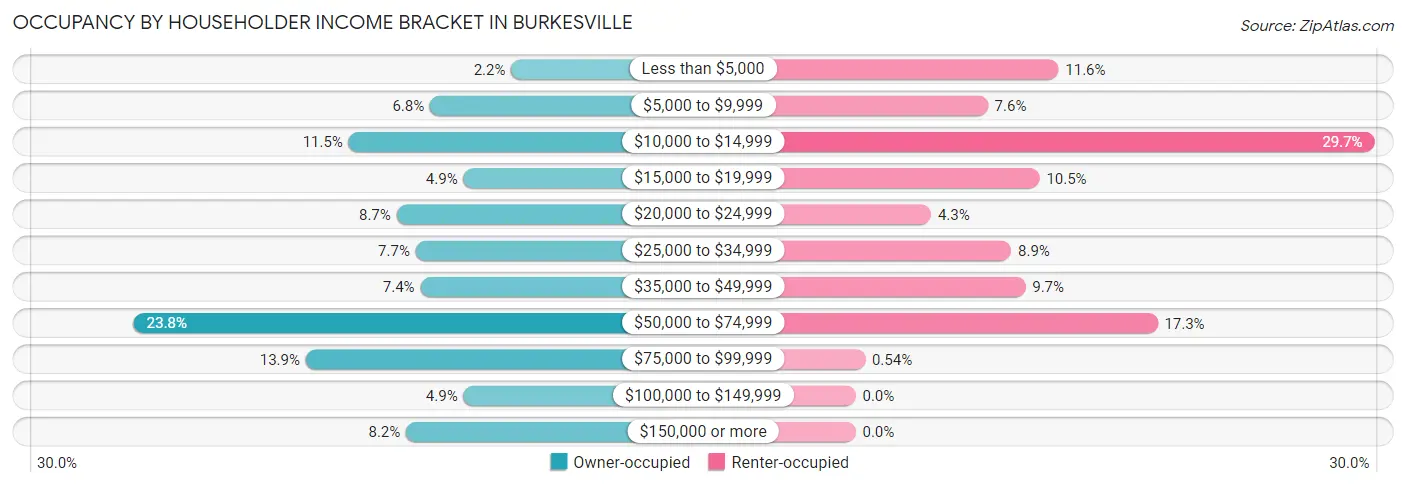
| Income Bracket | Owner-occupied | Renter-occupied |
| Less than $5,000 | 8 (2.2%) | 43 (11.6%) |
| $5,000 to $9,999 | 25 (6.8%) | 28 (7.5%) |
| $10,000 to $14,999 | 42 (11.5%) | 110 (29.6%) |
| $15,000 to $19,999 | 18 (4.9%) | 39 (10.5%) |
| $20,000 to $24,999 | 32 (8.7%) | 16 (4.3%) |
| $25,000 to $34,999 | 28 (7.6%) | 33 (8.9%) |
| $35,000 to $49,999 | 27 (7.4%) | 36 (9.7%) |
| $50,000 to $74,999 | 87 (23.8%) | 64 (17.2%) |
| $75,000 to $99,999 | 51 (13.9%) | 2 (0.5%) |
| $100,000 to $149,999 | 18 (4.9%) | 0 (0.0%) |
| $150,000 or more | 30 (8.2%) | 0 (0.0%) |
| Total | 366 (100.0%) | 371 (100.0%) |
Monthly Housing Cost Tiers in Burkesville
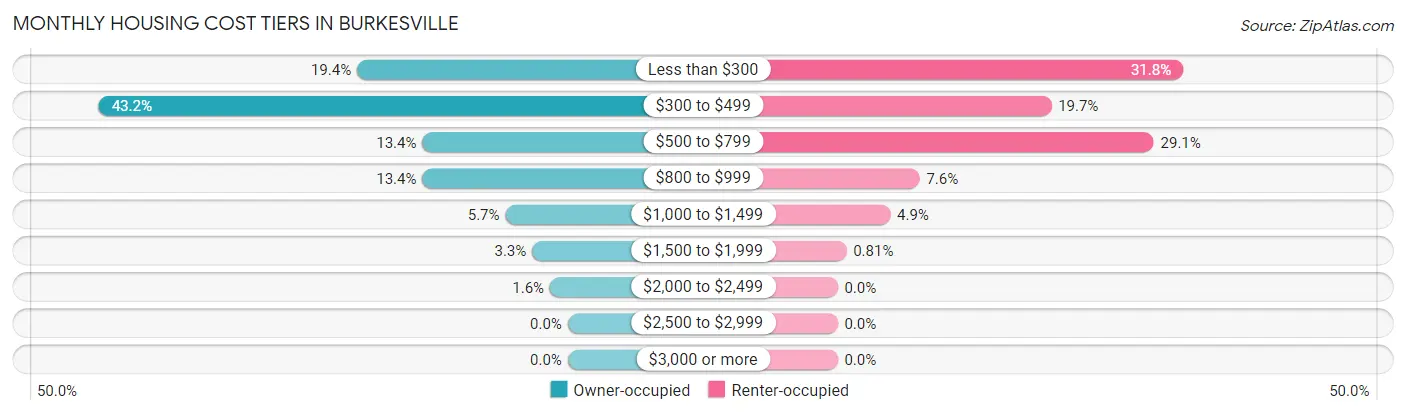
| Monthly Cost | Owner-occupied | Renter-occupied |
| Less than $300 | 71 (19.4%) | 118 (31.8%) |
| $300 to $499 | 158 (43.2%) | 73 (19.7%) |
| $500 to $799 | 49 (13.4%) | 108 (29.1%) |
| $800 to $999 | 49 (13.4%) | 28 (7.5%) |
| $1,000 to $1,499 | 21 (5.7%) | 18 (4.9%) |
| $1,500 to $1,999 | 12 (3.3%) | 3 (0.8%) |
| $2,000 to $2,499 | 6 (1.6%) | 0 (0.0%) |
| $2,500 to $2,999 | 0 (0.0%) | 0 (0.0%) |
| $3,000 or more | 0 (0.0%) | 0 (0.0%) |
| Total | 366 (100.0%) | 371 (100.0%) |
Physical Housing Characteristics in Burkesville
Housing Structures in Burkesville
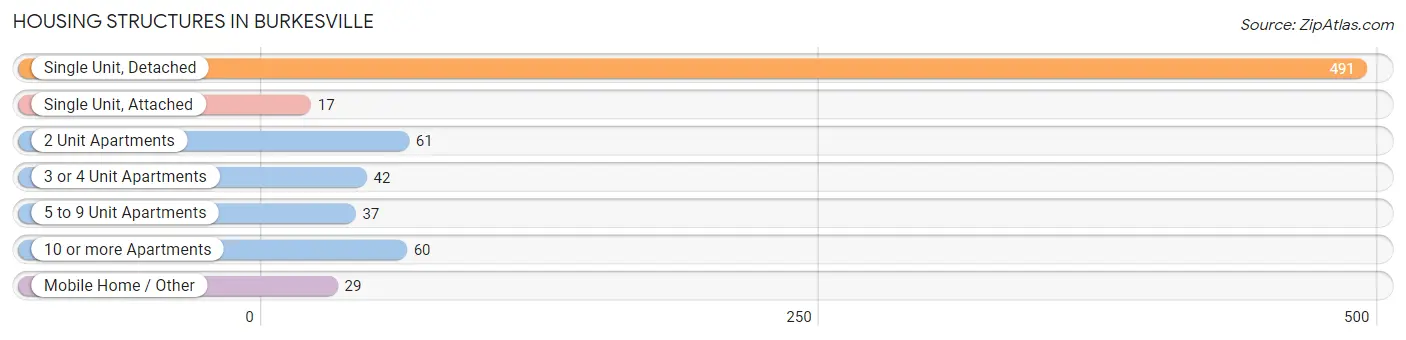
| Structure Type | # Housing Units | % Housing Units |
| Single Unit, Detached | 491 | 66.6% |
| Single Unit, Attached | 17 | 2.3% |
| 2 Unit Apartments | 61 | 8.3% |
| 3 or 4 Unit Apartments | 42 | 5.7% |
| 5 to 9 Unit Apartments | 37 | 5.0% |
| 10 or more Apartments | 60 | 8.1% |
| Mobile Home / Other | 29 | 3.9% |
| Total | 737 | 100.0% |
Housing Structures by Occupancy in Burkesville
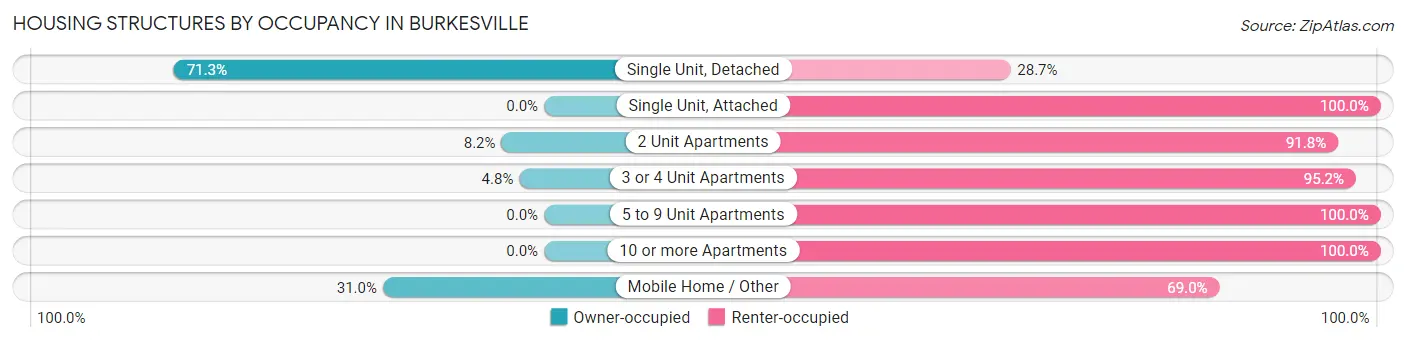
| Structure Type | Owner-occupied | Renter-occupied |
| Single Unit, Detached | 350 (71.3%) | 141 (28.7%) |
| Single Unit, Attached | 0 (0.0%) | 17 (100.0%) |
| 2 Unit Apartments | 5 (8.2%) | 56 (91.8%) |
| 3 or 4 Unit Apartments | 2 (4.8%) | 40 (95.2%) |
| 5 to 9 Unit Apartments | 0 (0.0%) | 37 (100.0%) |
| 10 or more Apartments | 0 (0.0%) | 60 (100.0%) |
| Mobile Home / Other | 9 (31.0%) | 20 (69.0%) |
| Total | 366 (49.7%) | 371 (50.3%) |
Housing Structures by Number of Rooms in Burkesville
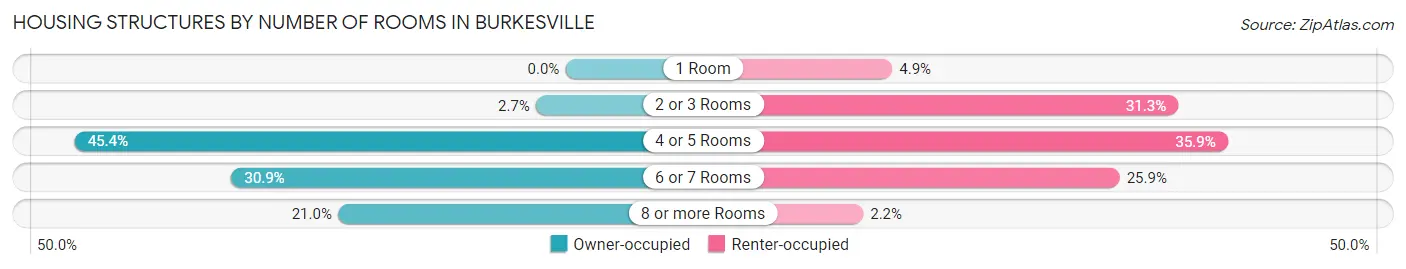
| Number of Rooms | Owner-occupied | Renter-occupied |
| 1 Room | 0 (0.0%) | 18 (4.9%) |
| 2 or 3 Rooms | 10 (2.7%) | 116 (31.3%) |
| 4 or 5 Rooms | 166 (45.4%) | 133 (35.8%) |
| 6 or 7 Rooms | 113 (30.9%) | 96 (25.9%) |
| 8 or more Rooms | 77 (21.0%) | 8 (2.2%) |
| Total | 366 (100.0%) | 371 (100.0%) |
Housing Structure by Heating Type in Burkesville
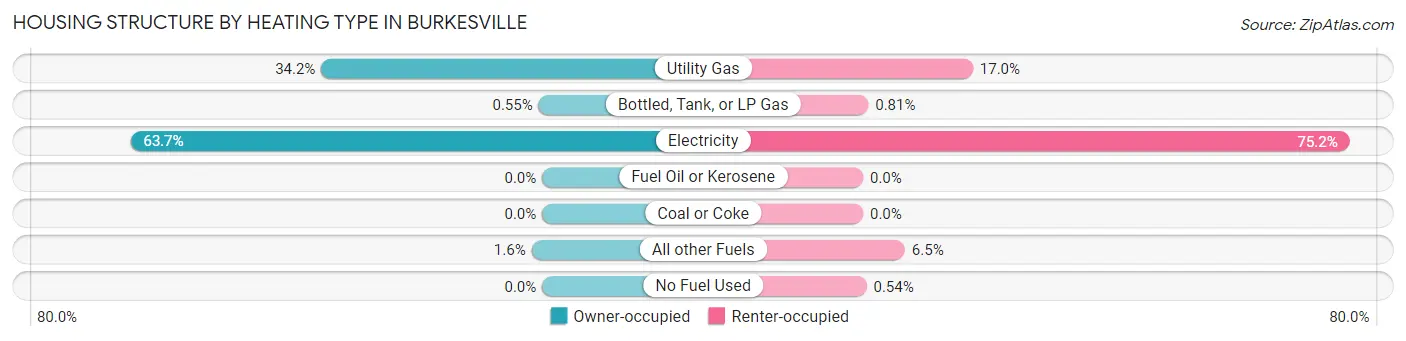
| Heating Type | Owner-occupied | Renter-occupied |
| Utility Gas | 125 (34.2%) | 63 (17.0%) |
| Bottled, Tank, or LP Gas | 2 (0.5%) | 3 (0.8%) |
| Electricity | 233 (63.7%) | 279 (75.2%) |
| Fuel Oil or Kerosene | 0 (0.0%) | 0 (0.0%) |
| Coal or Coke | 0 (0.0%) | 0 (0.0%) |
| All other Fuels | 6 (1.6%) | 24 (6.5%) |
| No Fuel Used | 0 (0.0%) | 2 (0.5%) |
| Total | 366 (100.0%) | 371 (100.0%) |
Household Vehicle Usage in Burkesville
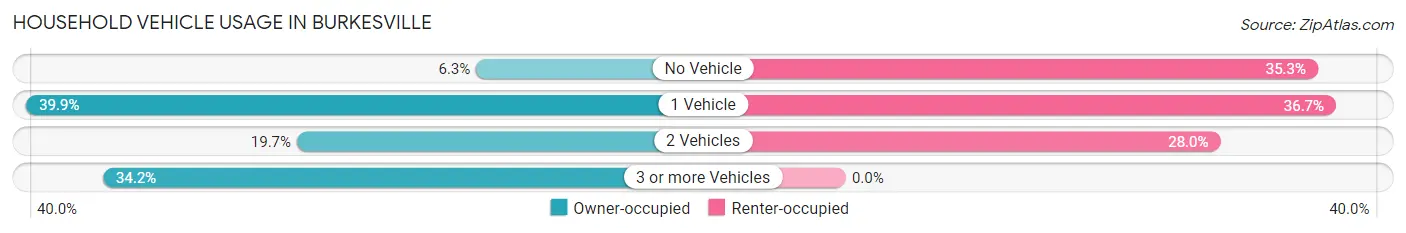
| Vehicles per Household | Owner-occupied | Renter-occupied |
| No Vehicle | 23 (6.3%) | 131 (35.3%) |
| 1 Vehicle | 146 (39.9%) | 136 (36.7%) |
| 2 Vehicles | 72 (19.7%) | 104 (28.0%) |
| 3 or more Vehicles | 125 (34.2%) | 0 (0.0%) |
| Total | 366 (100.0%) | 371 (100.0%) |
Real Estate & Mortgages in Burkesville
Real Estate and Mortgage Overview in Burkesville
| Characteristic | Without Mortgage | With Mortgage |
| Housing Units | 202 | 164 |
| Median Property Value | $108,100 | $104,100 |
| Median Household Income | $48,214 | $0 |
| Monthly Housing Costs | $329 | $0 |
| Real Estate Taxes | $397 | $25 |
Property Value by Mortgage Status in Burkesville
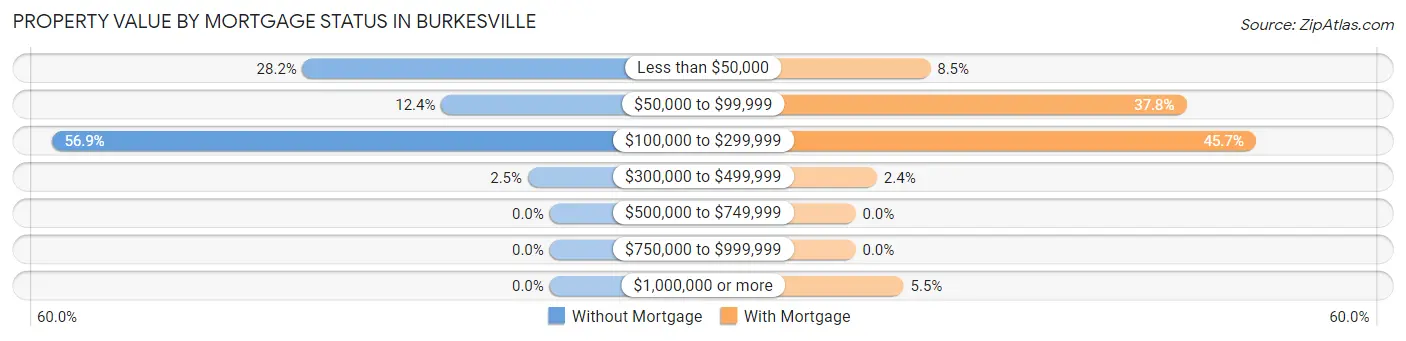
| Property Value | Without Mortgage | With Mortgage |
| Less than $50,000 | 57 (28.2%) | 14 (8.5%) |
| $50,000 to $99,999 | 25 (12.4%) | 62 (37.8%) |
| $100,000 to $299,999 | 115 (56.9%) | 75 (45.7%) |
| $300,000 to $499,999 | 5 (2.5%) | 4 (2.4%) |
| $500,000 to $749,999 | 0 (0.0%) | 0 (0.0%) |
| $750,000 to $999,999 | 0 (0.0%) | 0 (0.0%) |
| $1,000,000 or more | 0 (0.0%) | 9 (5.5%) |
| Total | 202 (100.0%) | 164 (100.0%) |
Household Income by Mortgage Status in Burkesville
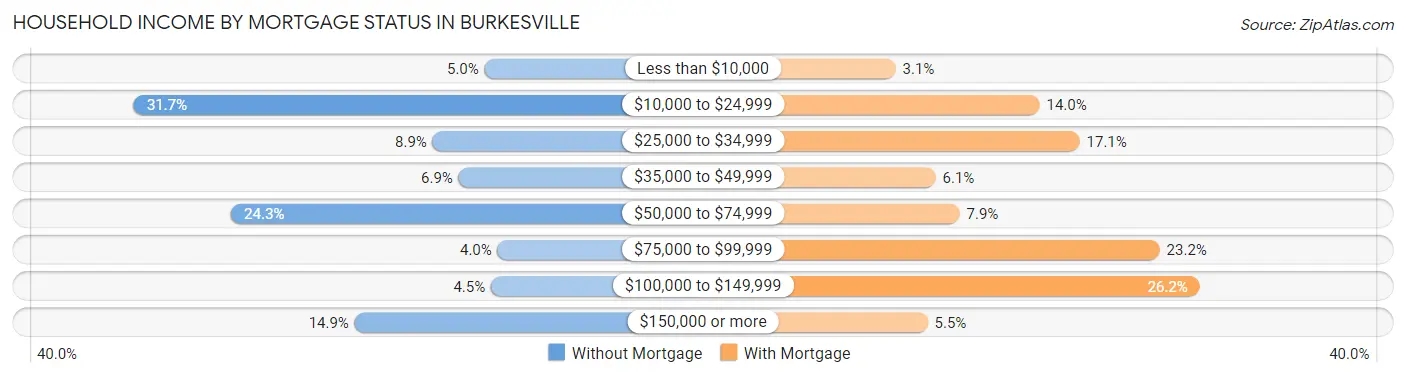
| Household Income | Without Mortgage | With Mortgage |
| Less than $10,000 | 10 (5.0%) | 5 (3.0%) |
| $10,000 to $24,999 | 64 (31.7%) | 23 (14.0%) |
| $25,000 to $34,999 | 18 (8.9%) | 28 (17.1%) |
| $35,000 to $49,999 | 14 (6.9%) | 10 (6.1%) |
| $50,000 to $74,999 | 49 (24.3%) | 13 (7.9%) |
| $75,000 to $99,999 | 8 (4.0%) | 38 (23.2%) |
| $100,000 to $149,999 | 9 (4.5%) | 43 (26.2%) |
| $150,000 or more | 30 (14.8%) | 9 (5.5%) |
| Total | 202 (100.0%) | 164 (100.0%) |
Property Value to Household Income Ratio in Burkesville
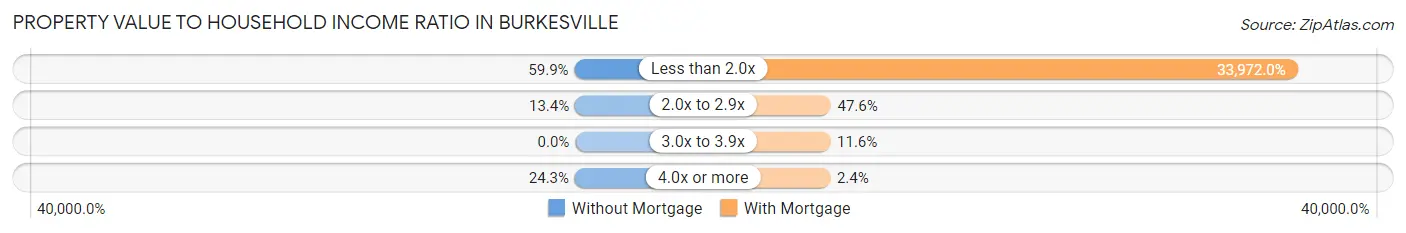
| Value-to-Income Ratio | Without Mortgage | With Mortgage |
| Less than 2.0x | 121 (59.9%) | 55,714 (33,971.9%) |
| 2.0x to 2.9x | 27 (13.4%) | 78 (47.6%) |
| 3.0x to 3.9x | 0 (0.0%) | 19 (11.6%) |
| 4.0x or more | 49 (24.3%) | 4 (2.4%) |
| Total | 202 (100.0%) | 164 (100.0%) |
Real Estate Taxes by Mortgage Status in Burkesville
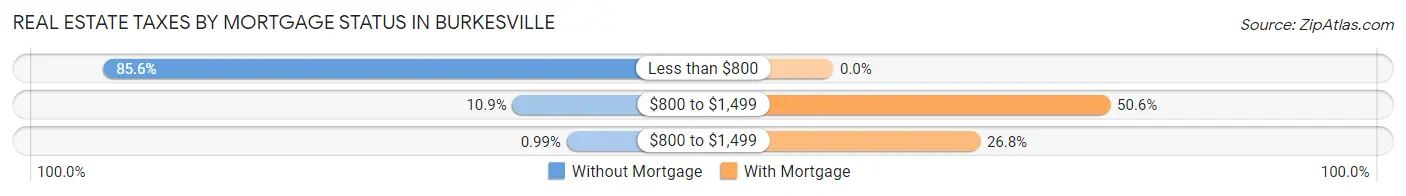
| Property Taxes | Without Mortgage | With Mortgage |
| Less than $800 | 173 (85.6%) | 0 (0.0%) |
| $800 to $1,499 | 22 (10.9%) | 83 (50.6%) |
| $800 to $1,499 | 2 (1.0%) | 44 (26.8%) |
| Total | 202 (100.0%) | 164 (100.0%) |
Health & Disability in Burkesville
Health Insurance Coverage by Age in Burkesville
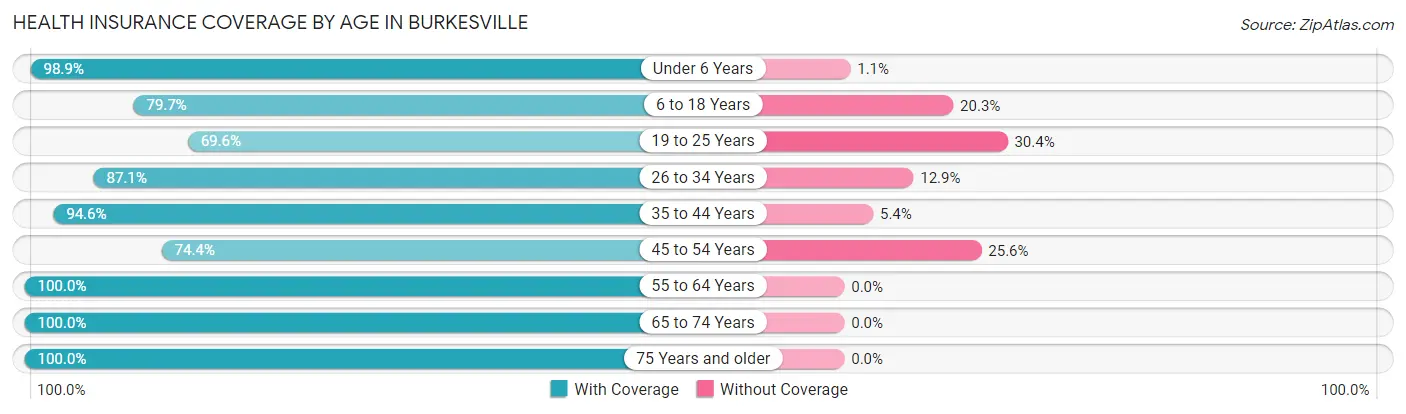
| Age Bracket | With Coverage | Without Coverage |
| Under 6 Years | 88 (98.9%) | 1 (1.1%) |
| 6 to 18 Years | 106 (79.7%) | 27 (20.3%) |
| 19 to 25 Years | 64 (69.6%) | 28 (30.4%) |
| 26 to 34 Years | 88 (87.1%) | 13 (12.9%) |
| 35 to 44 Years | 159 (94.6%) | 9 (5.4%) |
| 45 to 54 Years | 134 (74.4%) | 46 (25.6%) |
| 55 to 64 Years | 275 (100.0%) | 0 (0.0%) |
| 65 to 74 Years | 157 (100.0%) | 0 (0.0%) |
| 75 Years and older | 147 (100.0%) | 0 (0.0%) |
| Total | 1,218 (90.8%) | 124 (9.2%) |
Health Insurance Coverage by Citizenship Status in Burkesville
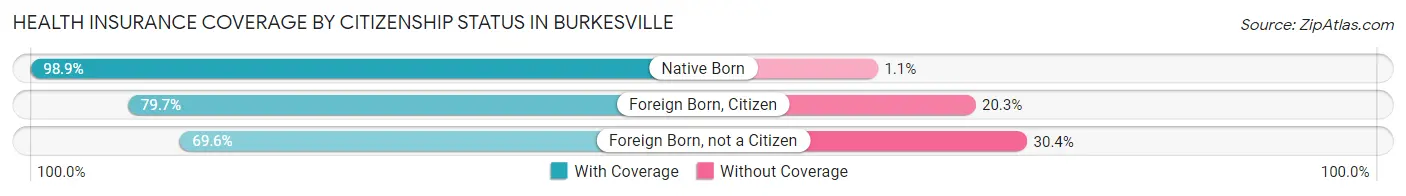
| Citizenship Status | With Coverage | Without Coverage |
| Native Born | 88 (98.9%) | 1 (1.1%) |
| Foreign Born, Citizen | 106 (79.7%) | 27 (20.3%) |
| Foreign Born, not a Citizen | 64 (69.6%) | 28 (30.4%) |
Health Insurance Coverage by Household Income in Burkesville
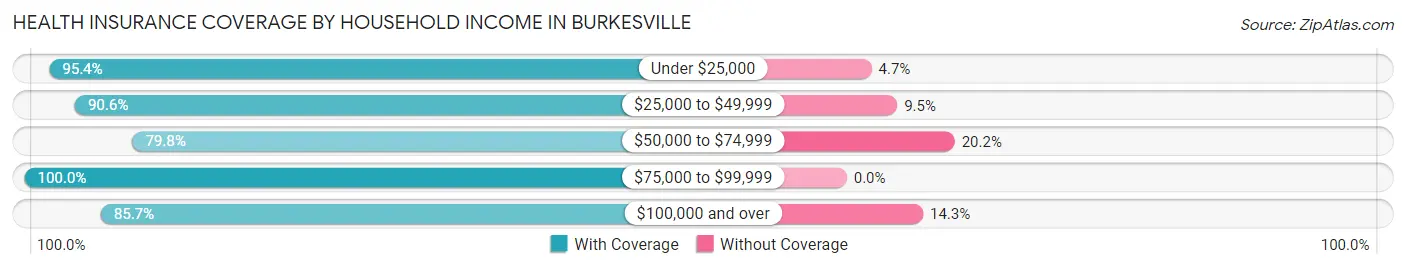
| Household Income | With Coverage | Without Coverage |
| Under $25,000 | 492 (95.4%) | 24 (4.6%) |
| $25,000 to $49,999 | 230 (90.5%) | 24 (9.5%) |
| $50,000 to $74,999 | 217 (79.8%) | 55 (20.2%) |
| $75,000 to $99,999 | 153 (100.0%) | 0 (0.0%) |
| $100,000 and over | 126 (85.7%) | 21 (14.3%) |
Public vs Private Health Insurance Coverage by Age in Burkesville
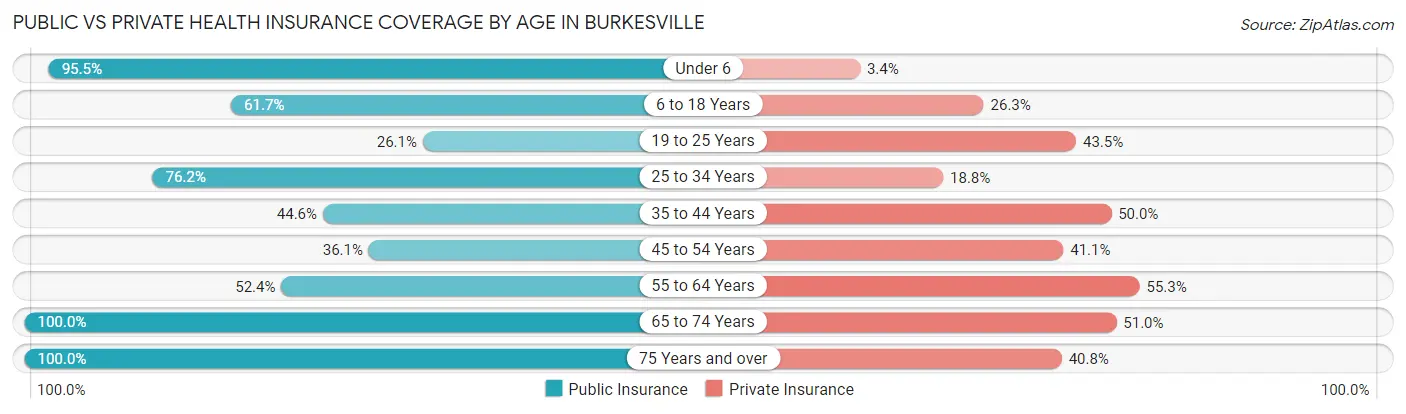
| Age Bracket | Public Insurance | Private Insurance |
| Under 6 | 85 (95.5%) | 3 (3.4%) |
| 6 to 18 Years | 82 (61.7%) | 35 (26.3%) |
| 19 to 25 Years | 24 (26.1%) | 40 (43.5%) |
| 25 to 34 Years | 77 (76.2%) | 19 (18.8%) |
| 35 to 44 Years | 75 (44.6%) | 84 (50.0%) |
| 45 to 54 Years | 65 (36.1%) | 74 (41.1%) |
| 55 to 64 Years | 144 (52.4%) | 152 (55.3%) |
| 65 to 74 Years | 157 (100.0%) | 80 (51.0%) |
| 75 Years and over | 147 (100.0%) | 60 (40.8%) |
| Total | 856 (63.8%) | 547 (40.8%) |
Disability Status by Sex by Age in Burkesville
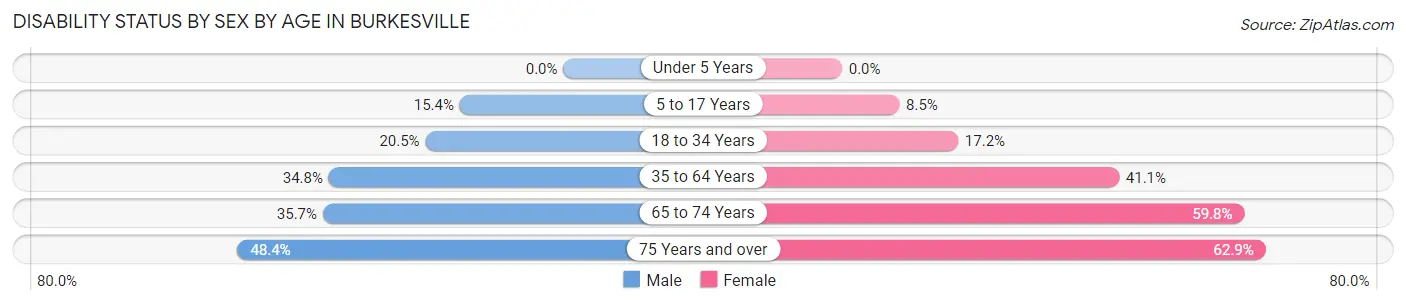
| Age Bracket | Male | Female |
| Under 5 Years | 0 (0.0%) | 0 (0.0%) |
| 5 to 17 Years | 12 (15.4%) | 8 (8.5%) |
| 18 to 34 Years | 17 (20.5%) | 20 (17.2%) |
| 35 to 64 Years | 101 (34.8%) | 137 (41.1%) |
| 65 to 74 Years | 25 (35.7%) | 52 (59.8%) |
| 75 Years and over | 15 (48.4%) | 73 (62.9%) |
Disability Class by Sex by Age in Burkesville
Disability Class: Hearing Difficulty
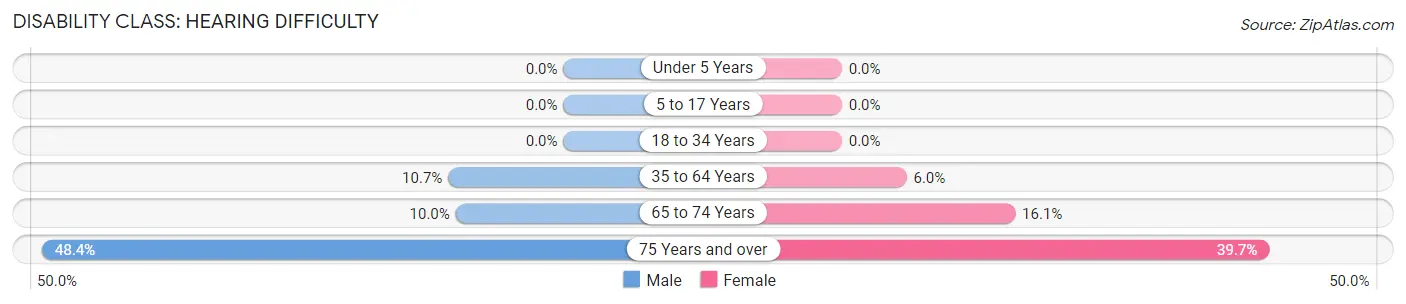
| Age Bracket | Male | Female |
| Under 5 Years | 0 (0.0%) | 0 (0.0%) |
| 5 to 17 Years | 0 (0.0%) | 0 (0.0%) |
| 18 to 34 Years | 0 (0.0%) | 0 (0.0%) |
| 35 to 64 Years | 31 (10.7%) | 20 (6.0%) |
| 65 to 74 Years | 7 (10.0%) | 14 (16.1%) |
| 75 Years and over | 15 (48.4%) | 46 (39.7%) |
Disability Class: Vision Difficulty
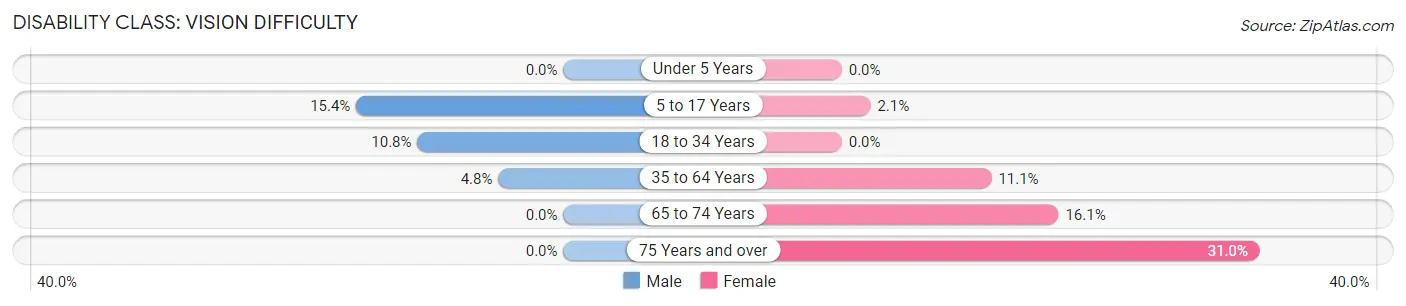
| Age Bracket | Male | Female |
| Under 5 Years | 0 (0.0%) | 0 (0.0%) |
| 5 to 17 Years | 12 (15.4%) | 2 (2.1%) |
| 18 to 34 Years | 9 (10.8%) | 0 (0.0%) |
| 35 to 64 Years | 14 (4.8%) | 37 (11.1%) |
| 65 to 74 Years | 0 (0.0%) | 14 (16.1%) |
| 75 Years and over | 0 (0.0%) | 36 (31.0%) |
Disability Class: Cognitive Difficulty
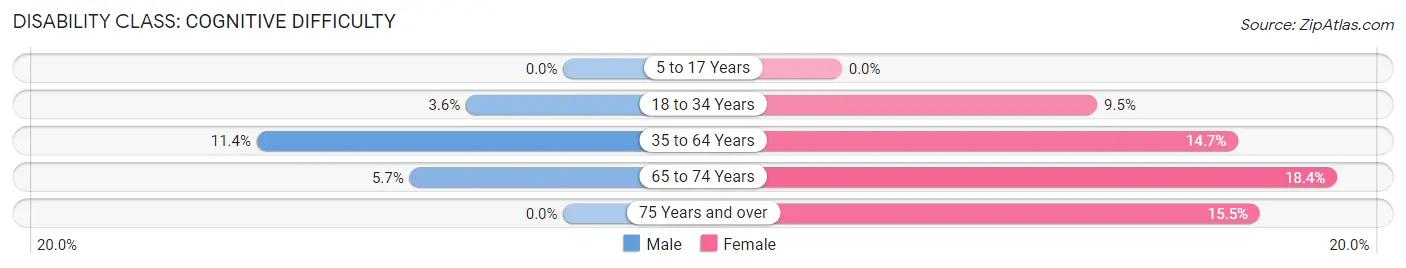
| Age Bracket | Male | Female |
| 5 to 17 Years | 0 (0.0%) | 0 (0.0%) |
| 18 to 34 Years | 3 (3.6%) | 11 (9.5%) |
| 35 to 64 Years | 33 (11.4%) | 49 (14.7%) |
| 65 to 74 Years | 4 (5.7%) | 16 (18.4%) |
| 75 Years and over | 0 (0.0%) | 18 (15.5%) |
Disability Class: Ambulatory Difficulty
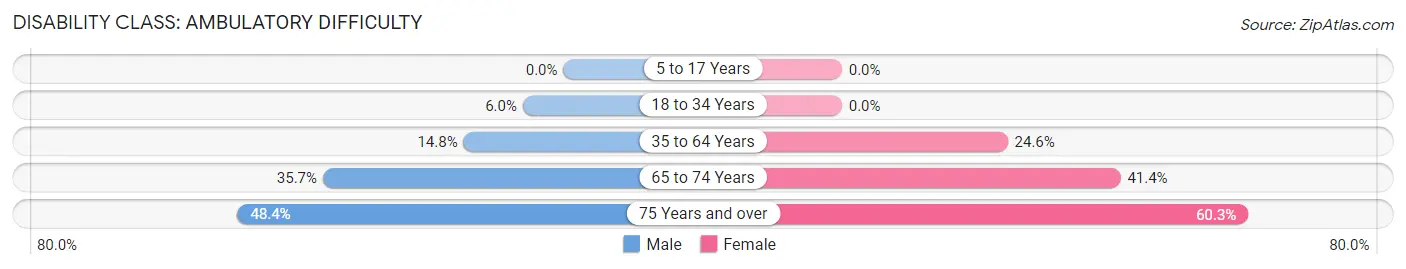
| Age Bracket | Male | Female |
| 5 to 17 Years | 0 (0.0%) | 0 (0.0%) |
| 18 to 34 Years | 5 (6.0%) | 0 (0.0%) |
| 35 to 64 Years | 43 (14.8%) | 82 (24.6%) |
| 65 to 74 Years | 25 (35.7%) | 36 (41.4%) |
| 75 Years and over | 15 (48.4%) | 70 (60.3%) |
Disability Class: Self-Care Difficulty
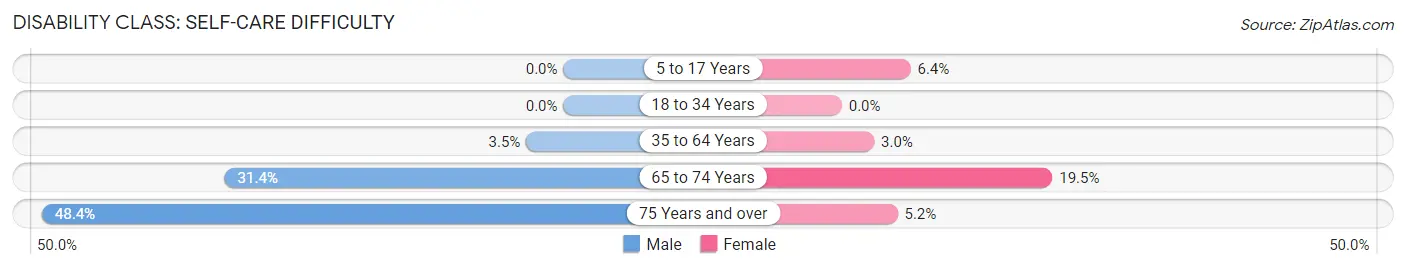
| Age Bracket | Male | Female |
| 5 to 17 Years | 0 (0.0%) | 6 (6.4%) |
| 18 to 34 Years | 0 (0.0%) | 0 (0.0%) |
| 35 to 64 Years | 10 (3.5%) | 10 (3.0%) |
| 65 to 74 Years | 22 (31.4%) | 17 (19.5%) |
| 75 Years and over | 15 (48.4%) | 6 (5.2%) |
Technology Access in Burkesville
Computing Device Access in Burkesville
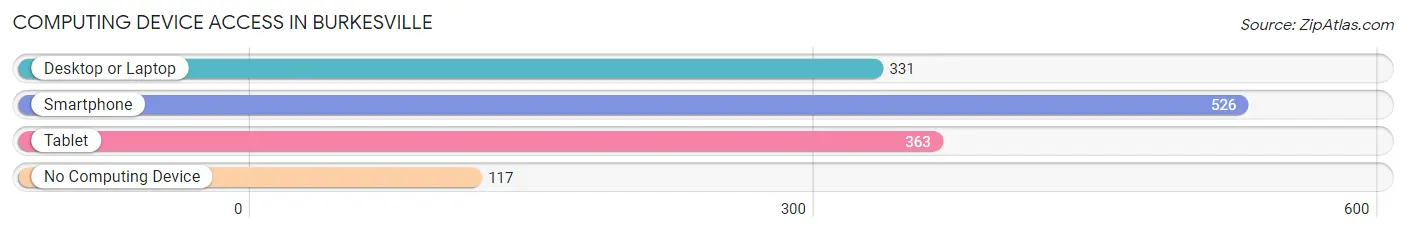
| Device Type | # Households | % Households |
| Desktop or Laptop | 331 | 44.9% |
| Smartphone | 526 | 71.4% |
| Tablet | 363 | 49.2% |
| No Computing Device | 117 | 15.9% |
| Total | 737 | 100.0% |
Internet Access in Burkesville
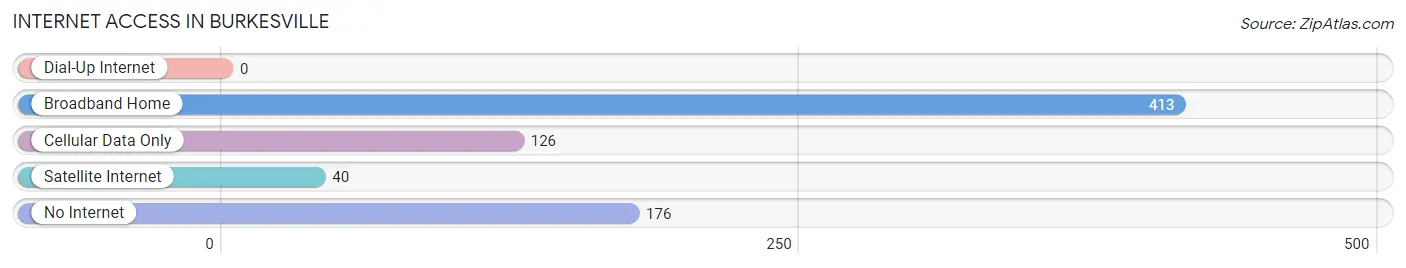
| Internet Type | # Households | % Households |
| Dial-Up Internet | 0 | 0.0% |
| Broadband Home | 413 | 56.0% |
| Cellular Data Only | 126 | 17.1% |
| Satellite Internet | 40 | 5.4% |
| No Internet | 176 | 23.9% |
| Total | 737 | 100.0% |
Burkesville Summary
Burkesville, Kentucky is a small town located in Cumberland County, Kentucky. It is the county seat of Cumberland County and is located in the south-central part of the state. The population of Burkesville was 1,717 at the 2010 census.
History
Burkesville was founded in 1810 by William Burke, a Revolutionary War veteran. The town was named after him and was originally known as Burke's Station. The town was incorporated in 1820 and was the first county seat of Cumberland County.
Burkesville was an important stop on the stagecoach route between Nashville and Louisville. It was also a major trading center for the surrounding area. During the Civil War, Burkesville was the site of a major battle between Confederate and Union forces. The Battle of Burkesville was fought on October 8, 1862 and resulted in a Confederate victory.
Geography
Burkesville is located at the intersection of US Highway 127 and Kentucky Route 61. It is situated in the rolling hills of south-central Kentucky, about 30 miles north of the Tennessee border. The town is surrounded by farmland and is located near the Cumberland River.
The climate in Burkesville is humid subtropical, with hot summers and mild winters. The average annual temperature is around 60°F (15°C). The average annual precipitation is around 45 inches (114 cm).
Economy
The economy of Burkesville is largely based on agriculture. The town is home to several farms, including cattle, poultry, and dairy farms. The town is also home to several manufacturing companies, including a furniture factory and a woodworking plant.
Burkesville is also home to several small businesses, including restaurants, shops, and services. The town is also home to a branch of the Cumberland County Public Library.
Demographics
As of the 2010 census, the population of Burkesville was 1,717. The racial makeup of the town was 97.2% White, 0.9% African American, 0.2% Native American, 0.2% Asian, 0.1% Pacific Islander, 0.3% from other races, and 0.9% from two or more races. Hispanic or Latino of any race were 1.2% of the population.
The median household income in Burkesville was $30,938, and the median family income was $37,813. The per capita income for the town was $17,845. About 17.2% of families and 20.2% of the population were below the poverty line, including 28.3% of those under age 18 and 16.2% of those age 65 or over.
Burkesville is served by the Cumberland County School District. The town is home to Burkesville Elementary School, Burkesville Middle School, and Burkesville High School. The town is also home to a branch of the University of the Cumberlands.
Common Questions
What is Per Capita Income in Burkesville?
Per Capita income in Burkesville is $22,422.
What is the Median Family Income in Burkesville?
Median Family Income in Burkesville is $34,974.
What is the Median Household income in Burkesville?
Median Household Income in Burkesville is $26,563.
What is Income or Wage Gap in Burkesville?
Income or Wage Gap in Burkesville is 21.0%.
Women in Burkesville earn 79.0 cents for every dollar earned by a man.
What is Inequality or Gini Index in Burkesville?
Inequality or Gini Index in Burkesville is 0.50.
What is the Total Population of Burkesville?
Total Population of Burkesville is 1,423.
What is the Total Male Population of Burkesville?
Total Male Population of Burkesville is 584.
What is the Total Female Population of Burkesville?
Total Female Population of Burkesville is 839.
What is the Ratio of Males per 100 Females in Burkesville?
There are 69.61 Males per 100 Females in Burkesville.
What is the Ratio of Females per 100 Males in Burkesville?
There are 143.66 Females per 100 Males in Burkesville.
What is the Median Population Age in Burkesville?
Median Population Age in Burkesville is 51.6 Years.
What is the Average Family Size in Burkesville
Average Family Size in Burkesville is 2.7 People.
What is the Average Household Size in Burkesville
Average Household Size in Burkesville is 1.8 People.
How Large is the Labor Force in Burkesville?
There are 502 People in the Labor Forcein in Burkesville.
What is the Percentage of People in the Labor Force in Burkesville?
40.9% of People are in the Labor Force in Burkesville.
What is the Unemployment Rate in Burkesville?
Unemployment Rate in Burkesville is 2.4%.