Jeffersonville, KY Map & Demographics
Jeffersonville Map
Jeffersonville Overview
$22,598
PER CAPITA INCOME
$61,500
AVG FAMILY INCOME
$52,031
AVG HOUSEHOLD INCOME
12.4%
WAGE / INCOME GAP [ % ]
87.6¢/ $1
WAGE / INCOME GAP [ $ ]
0.42
INEQUALITY / GINI INDEX
1,833
TOTAL POPULATION
968
MALE POPULATION
865
FEMALE POPULATION
111.91
MALES / 100 FEMALES
89.36
FEMALES / 100 MALES
36.0
MEDIAN AGE
3.1
AVG FAMILY SIZE
2.9
AVG HOUSEHOLD SIZE
867
LABOR FORCE [ PEOPLE ]
61.8%
PERCENT IN LABOR FORCE
8.8%
UNEMPLOYMENT RATE
Jeffersonville Zip Codes
Jeffersonville Area Codes
Income in Jeffersonville
Income Overview in Jeffersonville
Per Capita Income in Jeffersonville is $22,598, while median incomes of families and households are $61,500 and $52,031 respectively.
| Characteristic | Number | Measure |
| Per Capita Income | 1,833 | $22,598 |
| Median Family Income | 496 | $61,500 |
| Mean Family Income | 496 | $70,254 |
| Median Household Income | 628 | $52,031 |
| Mean Household Income | 628 | $62,768 |
| Income Deficit | 496 | $0 |
| Wage / Income Gap (%) | 1,833 | 12.42% |
| Wage / Income Gap ($) | 1,833 | 87.58¢ per $1 |
| Gini / Inequality Index | 1,833 | 0.42 |
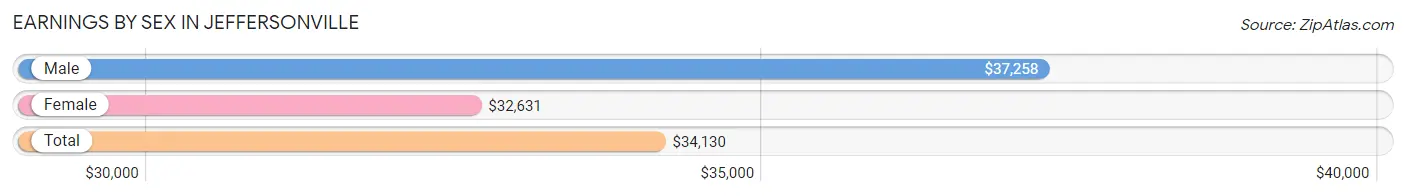
Earnings by Sex in Jeffersonville
Average Earnings in Jeffersonville are $34,130, $37,258 for men and $32,631 for women, a difference of 12.4%.
| Sex | Number | Average Earnings |
| Male | 434 (51.0%) | $37,258 |
| Female | 417 (49.0%) | $32,631 |
| Total | 851 (100.0%) | $34,130 |
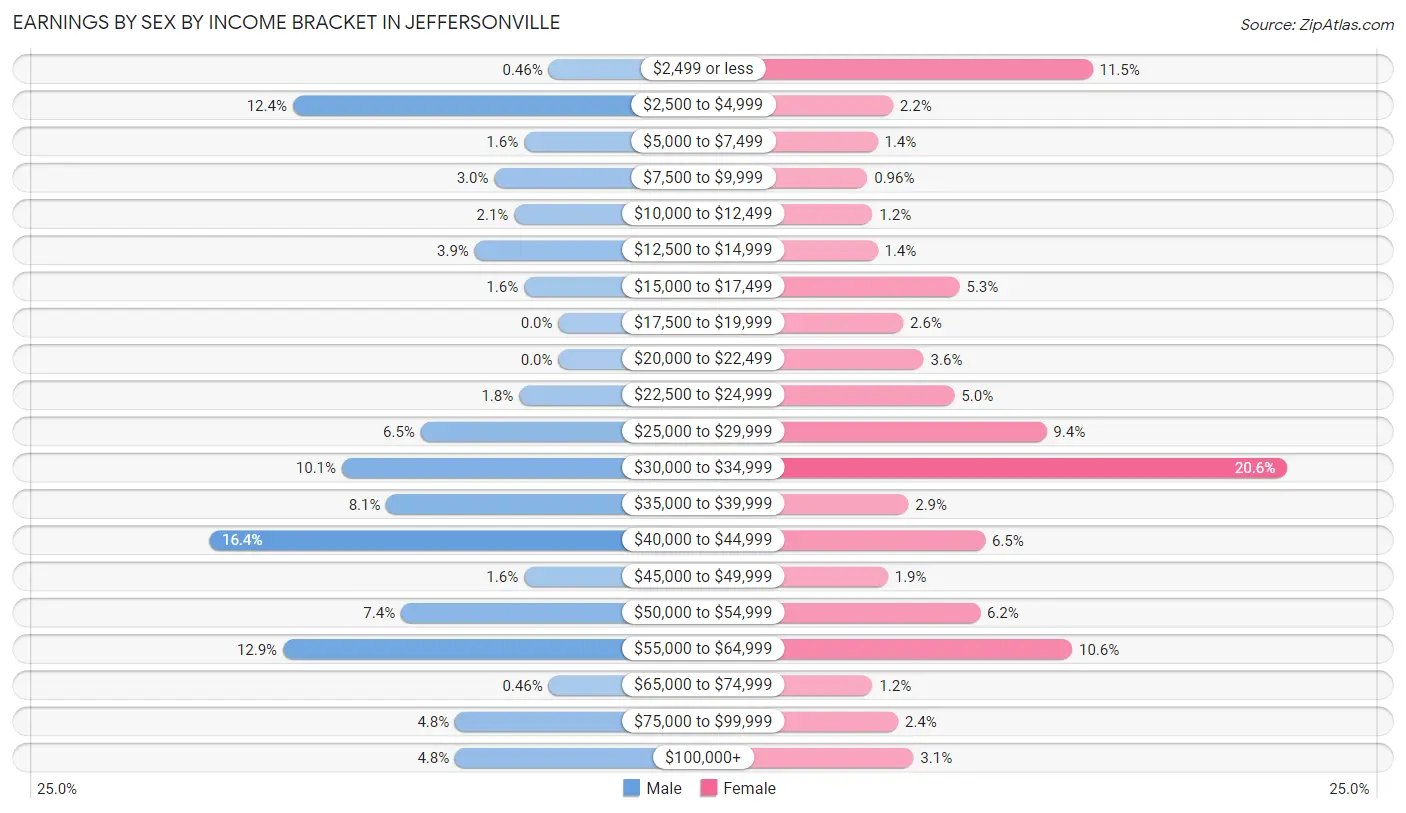
Earnings by Sex by Income Bracket in Jeffersonville
The most common earnings brackets in Jeffersonville are $40,000 to $44,999 for men (71 | 16.4%) and $30,000 to $34,999 for women (86 | 20.6%).
| Income | Male | Female |
| $2,499 or less | 2 (0.5%) | 48 (11.5%) |
| $2,500 to $4,999 | 54 (12.4%) | 9 (2.2%) |
| $5,000 to $7,499 | 7 (1.6%) | 6 (1.4%) |
| $7,500 to $9,999 | 13 (3.0%) | 4 (1.0%) |
| $10,000 to $12,499 | 9 (2.1%) | 5 (1.2%) |
| $12,500 to $14,999 | 17 (3.9%) | 6 (1.4%) |
| $15,000 to $17,499 | 7 (1.6%) | 22 (5.3%) |
| $17,500 to $19,999 | 0 (0.0%) | 11 (2.6%) |
| $20,000 to $22,499 | 0 (0.0%) | 15 (3.6%) |
| $22,500 to $24,999 | 8 (1.8%) | 21 (5.0%) |
| $25,000 to $29,999 | 28 (6.5%) | 39 (9.3%) |
| $30,000 to $34,999 | 44 (10.1%) | 86 (20.6%) |
| $35,000 to $39,999 | 35 (8.1%) | 12 (2.9%) |
| $40,000 to $44,999 | 71 (16.4%) | 27 (6.5%) |
| $45,000 to $49,999 | 7 (1.6%) | 8 (1.9%) |
| $50,000 to $54,999 | 32 (7.4%) | 26 (6.2%) |
| $55,000 to $64,999 | 56 (12.9%) | 44 (10.5%) |
| $65,000 to $74,999 | 2 (0.5%) | 5 (1.2%) |
| $75,000 to $99,999 | 21 (4.8%) | 10 (2.4%) |
| $100,000+ | 21 (4.8%) | 13 (3.1%) |
| Total | 434 (100.0%) | 417 (100.0%) |
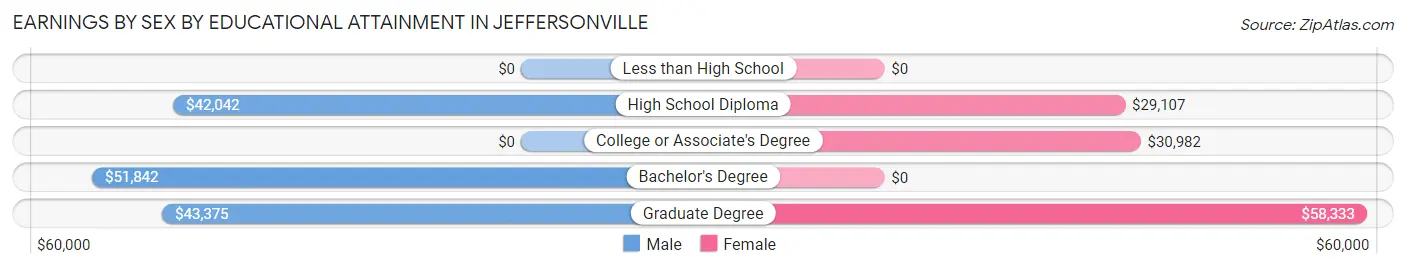
Earnings by Sex by Educational Attainment in Jeffersonville
Average earnings in Jeffersonville are $38,750 for men and $33,078 for women, a difference of 14.6%. Men with an educational attainment of bachelor's degree enjoy the highest average annual earnings of $51,842, while those with high school diploma education earn the least with $42,042. Women with an educational attainment of graduate degree earn the most with the average annual earnings of $58,333, while those with high school diploma education have the smallest earnings of $29,107.
| Educational Attainment | Male Income | Female Income |
| Less than High School | - | - |
| High School Diploma | $42,042 | $29,107 |
| College or Associate's Degree | - | - |
| Bachelor's Degree | $51,842 | $0 |
| Graduate Degree | $43,375 | $58,333 |
| Total | $38,750 | $33,078 |
Family Income in Jeffersonville
Family Income Brackets in Jeffersonville
According to the Jeffersonville family income data, there are 102 families falling into the $100,000 to $149,999 income range, which is the most common income bracket and makes up 20.6% of all families. Conversely, the $10,000 to $14,999 income bracket is the least frequent group with only 7 families (1.4%) belonging to this category.
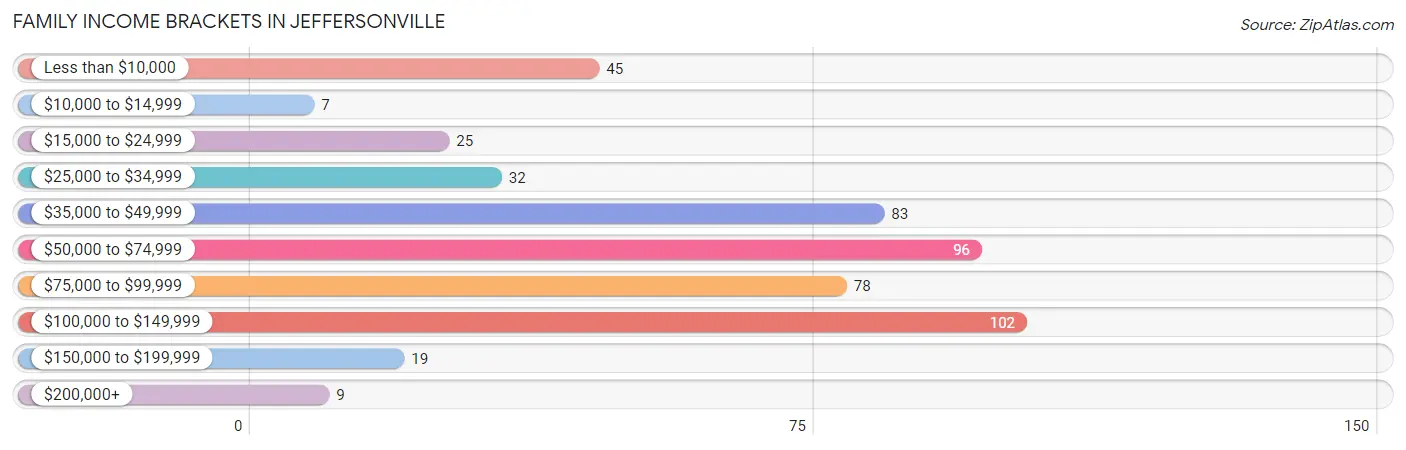
| Income Bracket | # Families | % Families |
| Less than $10,000 | 45 | 9.1% |
| $10,000 to $14,999 | 7 | 1.4% |
| $15,000 to $24,999 | 25 | 5.0% |
| $25,000 to $34,999 | 32 | 6.5% |
| $35,000 to $49,999 | 83 | 16.7% |
| $50,000 to $74,999 | 96 | 19.4% |
| $75,000 to $99,999 | 78 | 15.7% |
| $100,000 to $149,999 | 102 | 20.6% |
| $150,000 to $199,999 | 19 | 3.8% |
| $200,000+ | 9 | 1.8% |
Family Income by Famaliy Size in Jeffersonville
4-person families (68 | 13.7%) account for the highest median family income in Jeffersonville with $105,000 per family, while 4-person families (68 | 13.7%) have the highest median income of $26,250 per family member.
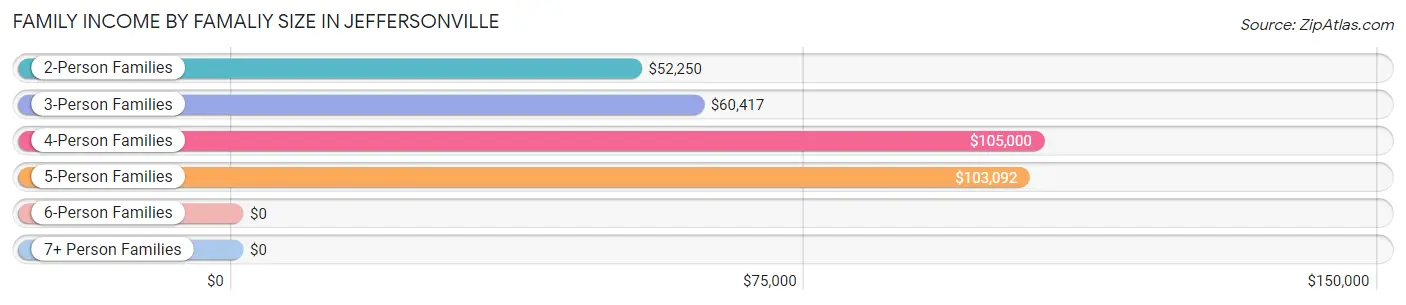
| Income Bracket | # Families | Median Income |
| 2-Person Families | 244 (49.2%) | $52,250 |
| 3-Person Families | 127 (25.6%) | $60,417 |
| 4-Person Families | 68 (13.7%) | $105,000 |
| 5-Person Families | 45 (9.1%) | $103,092 |
| 6-Person Families | 6 (1.2%) | $0 |
| 7+ Person Families | 6 (1.2%) | $0 |
| Total | 496 (100.0%) | $61,500 |
Family Income by Number of Earners in Jeffersonville
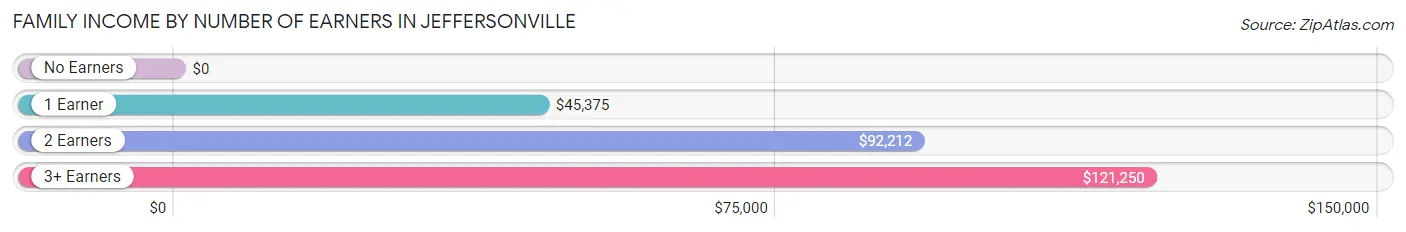
| Number of Earners | # Families | Median Income |
| No Earners | 113 (22.8%) | $0 |
| 1 Earner | 143 (28.8%) | $45,375 |
| 2 Earners | 199 (40.1%) | $92,212 |
| 3+ Earners | 41 (8.3%) | $121,250 |
| Total | 496 (100.0%) | $61,500 |
Household Income in Jeffersonville
Household Income Brackets in Jeffersonville
With 111 households falling in the category, the $50,000 to $74,999 income range is the most frequent in Jeffersonville, accounting for 17.7% of all households. In contrast, only 9 households (1.4%) fall into the $200,000+ income bracket, making it the least populous group.
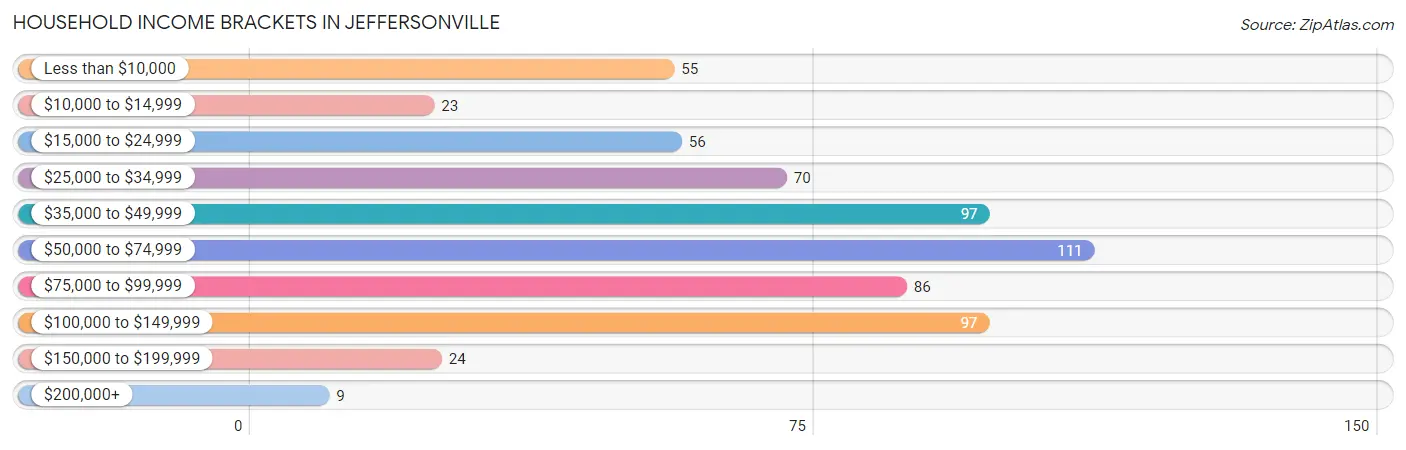
| Income Bracket | # Households | % Households |
| Less than $10,000 | 55 | 8.8% |
| $10,000 to $14,999 | 23 | 3.7% |
| $15,000 to $24,999 | 56 | 8.9% |
| $25,000 to $34,999 | 70 | 11.1% |
| $35,000 to $49,999 | 97 | 15.4% |
| $50,000 to $74,999 | 111 | 17.7% |
| $75,000 to $99,999 | 86 | 13.7% |
| $100,000 to $149,999 | 97 | 15.4% |
| $150,000 to $199,999 | 24 | 3.8% |
| $200,000+ | 9 | 1.4% |
Household Income by Householder Age in Jeffersonville
The median household income in Jeffersonville is $52,031, with the highest median household income of $66,339 found in the 45 to 64 years age bracket for the primary householder. A total of 237 households (37.7%) fall into this category. Meanwhile, the 15 to 24 years age bracket for the primary householder has the lowest median household income of $0, with 9 households (1.4%) in this group.
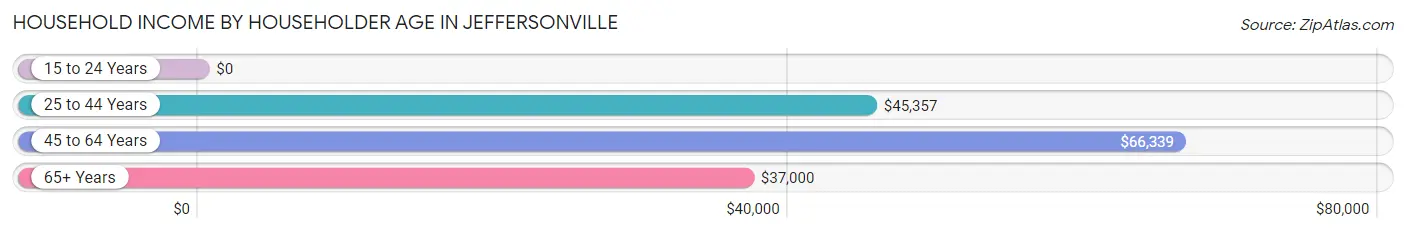
| Income Bracket | # Households | Median Income |
| 15 to 24 Years | 9 (1.4%) | $0 |
| 25 to 44 Years | 238 (37.9%) | $45,357 |
| 45 to 64 Years | 237 (37.7%) | $66,339 |
| 65+ Years | 144 (22.9%) | $37,000 |
| Total | 628 (100.0%) | $52,031 |
Poverty in Jeffersonville
Income Below Poverty by Sex and Age in Jeffersonville
With 18.0% poverty level for males and 15.8% for females among the residents of Jeffersonville, 12 to 14 year old males and 5 year old females are the most vulnerable to poverty, with 20 males (80.0%) and 3 females (75.0%) in their respective age groups living below the poverty level.
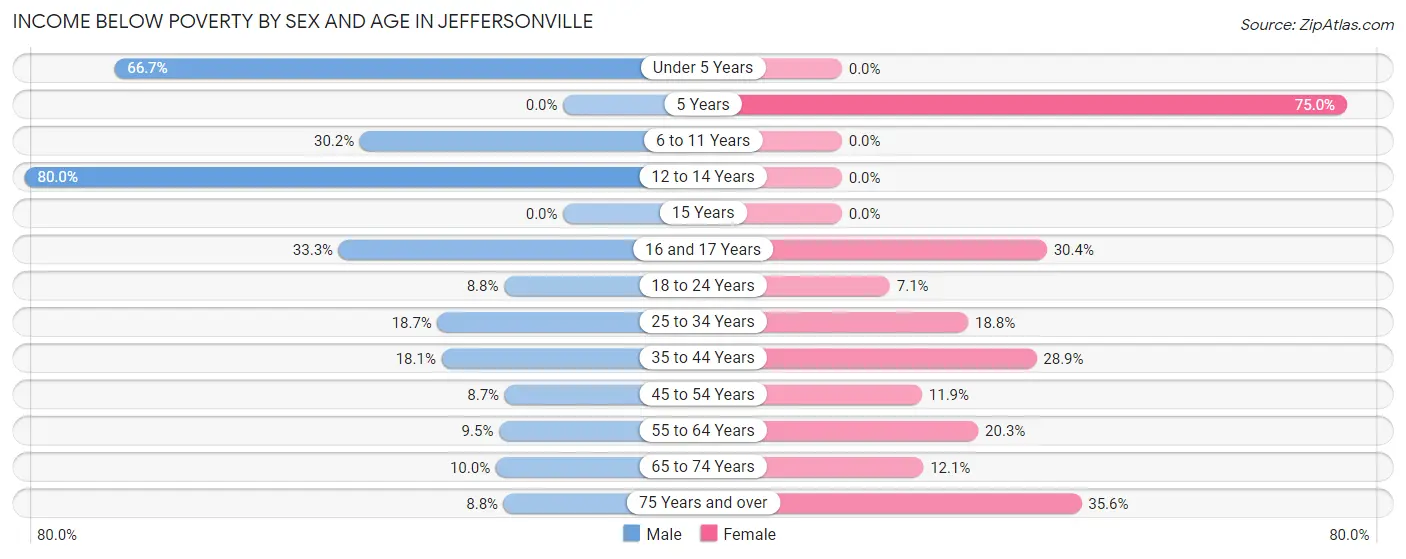
| Age Bracket | Male | Female |
| Under 5 Years | 12 (66.7%) | 0 (0.0%) |
| 5 Years | 0 (0.0%) | 3 (75.0%) |
| 6 to 11 Years | 32 (30.2%) | 0 (0.0%) |
| 12 to 14 Years | 20 (80.0%) | 0 (0.0%) |
| 15 Years | 0 (0.0%) | 0 (0.0%) |
| 16 and 17 Years | 7 (33.3%) | 7 (30.4%) |
| 18 to 24 Years | 5 (8.8%) | 2 (7.1%) |
| 25 to 34 Years | 25 (18.7%) | 39 (18.8%) |
| 35 to 44 Years | 26 (18.1%) | 26 (28.9%) |
| 45 to 54 Years | 15 (8.7%) | 17 (11.9%) |
| 55 to 64 Years | 6 (9.5%) | 16 (20.3%) |
| 65 to 74 Years | 7 (10.0%) | 11 (12.1%) |
| 75 Years and over | 3 (8.8%) | 16 (35.6%) |
| Total | 158 (18.0%) | 137 (15.8%) |
Income Above Poverty by Sex and Age in Jeffersonville
According to the poverty statistics in Jeffersonville, males aged 5 years and females aged under 5 years are the age groups that are most secure financially, with 100.0% of males and 100.0% of females in these age groups living above the poverty line.
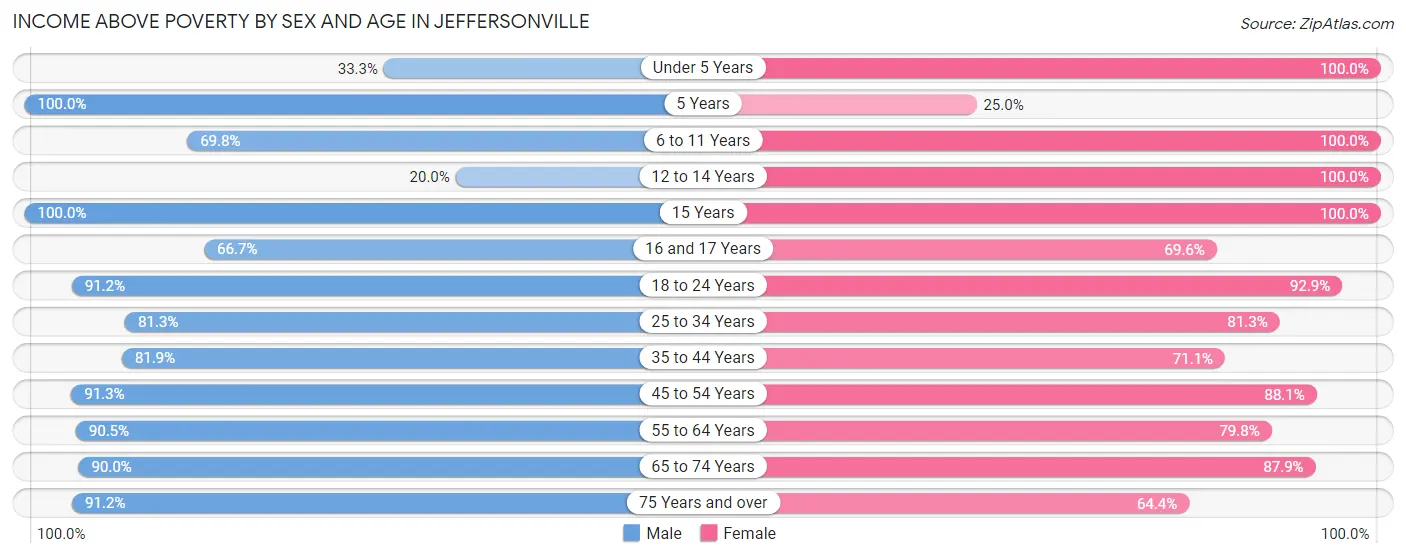
| Age Bracket | Male | Female |
| Under 5 Years | 6 (33.3%) | 22 (100.0%) |
| 5 Years | 18 (100.0%) | 1 (25.0%) |
| 6 to 11 Years | 74 (69.8%) | 89 (100.0%) |
| 12 to 14 Years | 5 (20.0%) | 31 (100.0%) |
| 15 Years | 14 (100.0%) | 12 (100.0%) |
| 16 and 17 Years | 14 (66.7%) | 16 (69.6%) |
| 18 to 24 Years | 52 (91.2%) | 26 (92.9%) |
| 25 to 34 Years | 109 (81.3%) | 169 (81.2%) |
| 35 to 44 Years | 118 (81.9%) | 64 (71.1%) |
| 45 to 54 Years | 158 (91.3%) | 126 (88.1%) |
| 55 to 64 Years | 57 (90.5%) | 63 (79.7%) |
| 65 to 74 Years | 63 (90.0%) | 80 (87.9%) |
| 75 Years and over | 31 (91.2%) | 29 (64.4%) |
| Total | 719 (82.0%) | 728 (84.2%) |
Income Below Poverty Among Married-Couple Families in Jeffersonville
The poverty statistics for married-couple families in Jeffersonville show that 10.5% or 37 of the total 352 families live below the poverty line. Families with 3 or 4 children have the highest poverty rate of 16.7%, comprising of 3 families. On the other hand, families with no children have the lowest poverty rate of 9.2%, which includes 18 families.
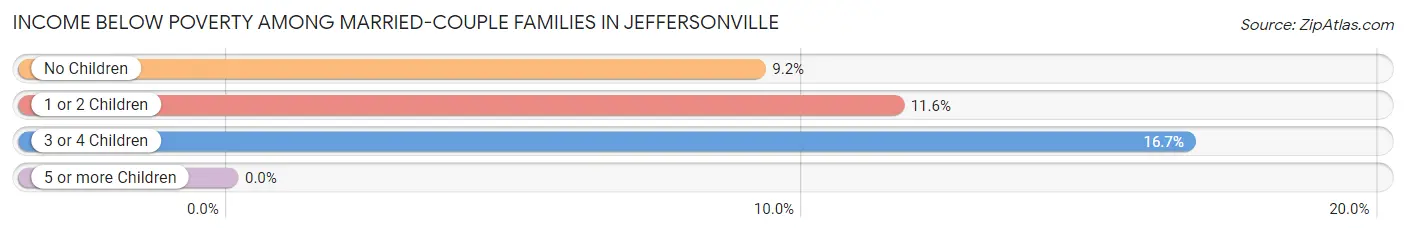
| Children | Above Poverty | Below Poverty |
| No Children | 178 (90.8%) | 18 (9.2%) |
| 1 or 2 Children | 122 (88.4%) | 16 (11.6%) |
| 3 or 4 Children | 15 (83.3%) | 3 (16.7%) |
| 5 or more Children | 0 (0.0%) | 0 (0.0%) |
| Total | 315 (89.5%) | 37 (10.5%) |
Income Below Poverty Among Single-Parent Households in Jeffersonville
According to the poverty data in Jeffersonville, 40.6% or 13 single-father households and 27.7% or 31 single-mother households are living below the poverty line. Among single-father households, those with no children have the highest poverty rate, with 4 households (57.1%) experiencing poverty. Likewise, among single-mother households, those with no children have the highest poverty rate, with 4 households (36.4%) falling below the poverty line.
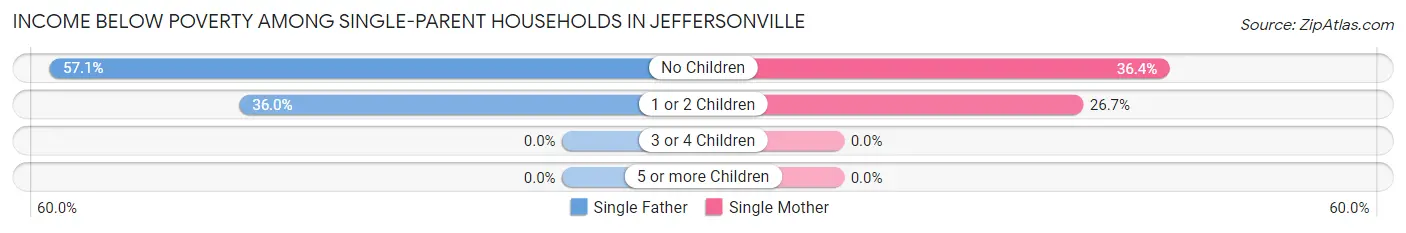
| Children | Single Father | Single Mother |
| No Children | 4 (57.1%) | 4 (36.4%) |
| 1 or 2 Children | 9 (36.0%) | 27 (26.7%) |
| 3 or 4 Children | 0 (0.0%) | 0 (0.0%) |
| 5 or more Children | 0 (0.0%) | 0 (0.0%) |
| Total | 13 (40.6%) | 31 (27.7%) |
Income Below Poverty Among Married-Couple vs Single-Parent Households in Jeffersonville
The poverty data for Jeffersonville shows that 37 of the married-couple family households (10.5%) and 44 of the single-parent households (30.6%) are living below the poverty level. Within the married-couple family households, those with 3 or 4 children have the highest poverty rate, with 3 households (16.7%) falling below the poverty line. Among the single-parent households, those with no children have the highest poverty rate, with 8 household (44.4%) living below poverty.
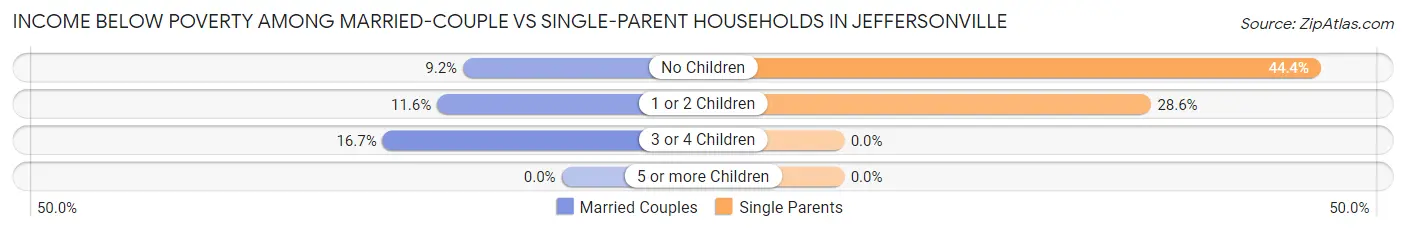
| Children | Married-Couple Families | Single-Parent Households |
| No Children | 18 (9.2%) | 8 (44.4%) |
| 1 or 2 Children | 16 (11.6%) | 36 (28.6%) |
| 3 or 4 Children | 3 (16.7%) | 0 (0.0%) |
| 5 or more Children | 0 (0.0%) | 0 (0.0%) |
| Total | 37 (10.5%) | 44 (30.6%) |
Race in Jeffersonville
The most populous races in Jeffersonville are White / Caucasian (1,707 | 93.1%), Hispanic or Latino (106 | 5.8%), and Some other Race (90 | 4.9%).
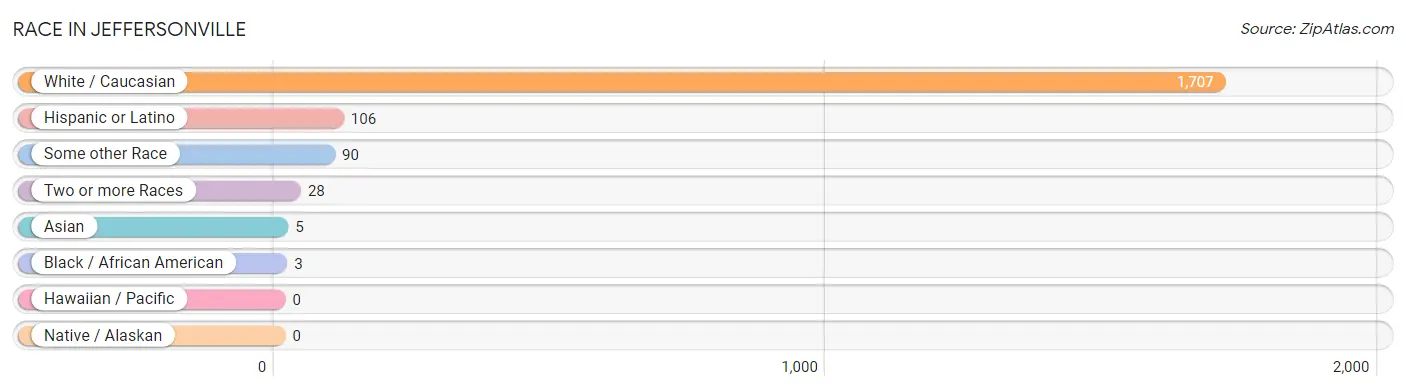
| Race | # Population | % Population |
| Asian | 5 | 0.3% |
| Black / African American | 3 | 0.2% |
| Hawaiian / Pacific | 0 | 0.0% |
| Hispanic or Latino | 106 | 5.8% |
| Native / Alaskan | 0 | 0.0% |
| White / Caucasian | 1,707 | 93.1% |
| Two or more Races | 28 | 1.5% |
| Some other Race | 90 | 4.9% |
| Total | 1,833 | 100.0% |
Ancestry in Jeffersonville
The most populous ancestries reported in Jeffersonville are American (616 | 33.6%), Irish (198 | 10.8%), English (144 | 7.9%), German (134 | 7.3%), and Mexican (90 | 4.9%), together accounting for 64.5% of all Jeffersonville residents.
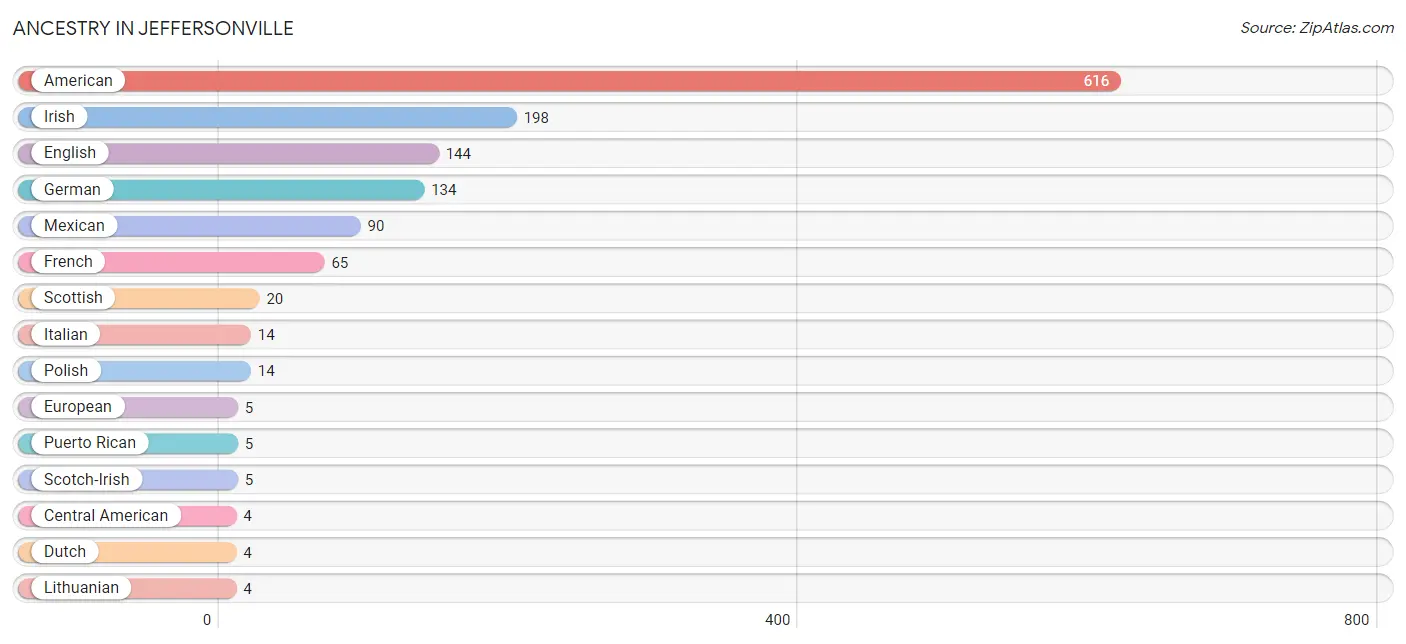
| Ancestry | # Population | % Population |
| American | 616 | 33.6% |
| Central American | 4 | 0.2% |
| Cherokee | 2 | 0.1% |
| Dutch | 4 | 0.2% |
| English | 144 | 7.9% |
| European | 5 | 0.3% |
| Filipino | 2 | 0.1% |
| Finnish | 3 | 0.2% |
| French | 65 | 3.5% |
| German | 134 | 7.3% |
| Irish | 198 | 10.8% |
| Italian | 14 | 0.8% |
| Lithuanian | 4 | 0.2% |
| Mexican | 90 | 4.9% |
| Panamanian | 4 | 0.2% |
| Polish | 14 | 0.8% |
| Puerto Rican | 5 | 0.3% |
| Russian | 1 | 0.1% |
| Scandinavian | 2 | 0.1% |
| Scotch-Irish | 5 | 0.3% |
| Scottish | 20 | 1.1% |
| Slovene | 4 | 0.2% |
| Thai | 3 | 0.2% |
| Welsh | 2 | 0.1% | View All 24 Rows |
Immigrants in Jeffersonville
The most numerous immigrant groups reported in Jeffersonville came from Europe (6 | 0.3%), Germany (6 | 0.3%), Western Europe (6 | 0.3%), Asia (5 | 0.3%), and Philippines (3 | 0.2%), together accounting for 1.4% of all Jeffersonville residents.
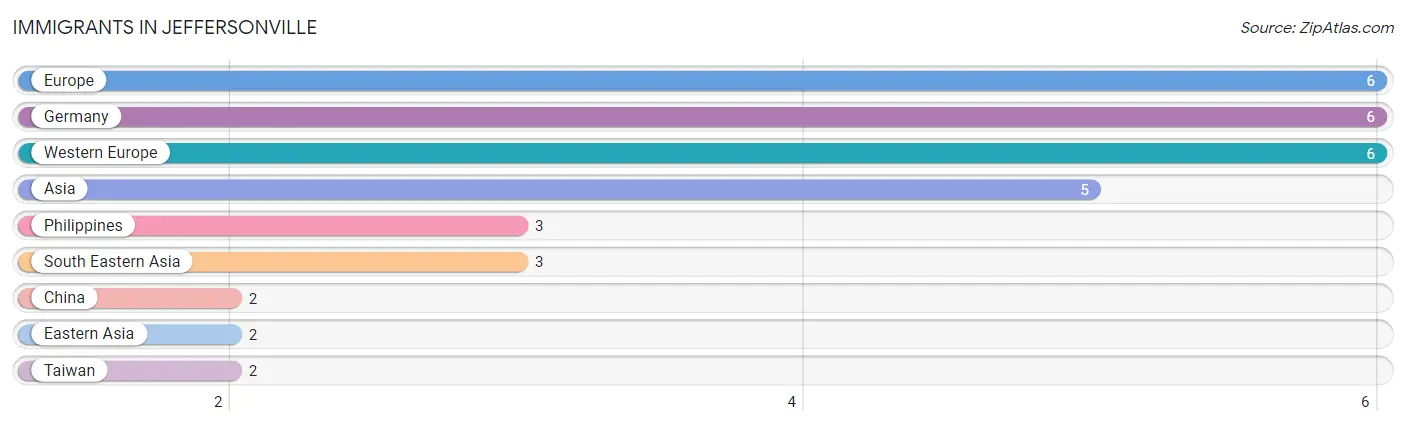
| Immigration Origin | # Population | % Population |
| Asia | 5 | 0.3% |
| China | 2 | 0.1% |
| Eastern Asia | 2 | 0.1% |
| Europe | 6 | 0.3% |
| Germany | 6 | 0.3% |
| Philippines | 3 | 0.2% |
| South Eastern Asia | 3 | 0.2% |
| Taiwan | 2 | 0.1% |
| Western Europe | 6 | 0.3% | View All 9 Rows |
Sex and Age in Jeffersonville
Sex and Age in Jeffersonville
The most populous age groups in Jeffersonville are 10 to 14 Years (131 | 13.5%) for men and 25 to 29 Years (108 | 12.5%) for women.
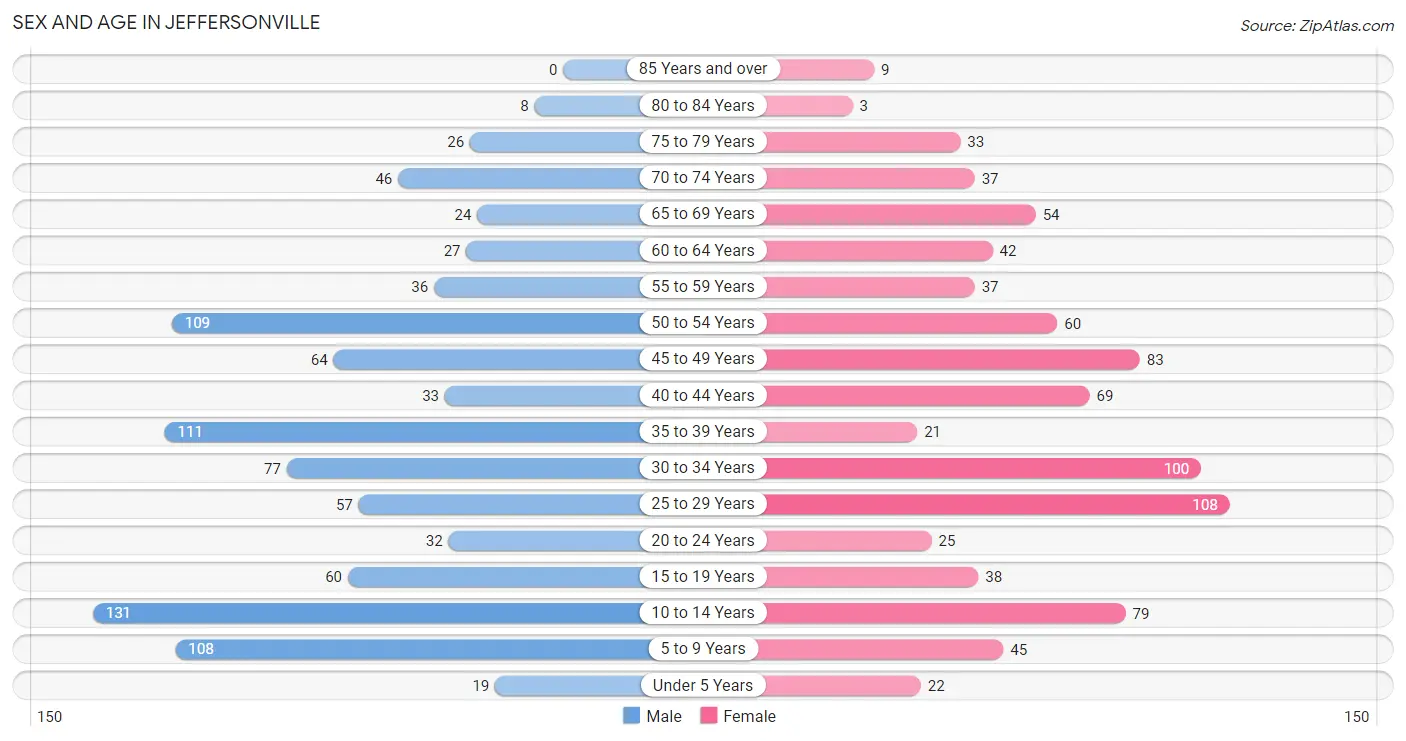
| Age Bracket | Male | Female |
| Under 5 Years | 19 (2.0%) | 22 (2.5%) |
| 5 to 9 Years | 108 (11.2%) | 45 (5.2%) |
| 10 to 14 Years | 131 (13.5%) | 79 (9.1%) |
| 15 to 19 Years | 60 (6.2%) | 38 (4.4%) |
| 20 to 24 Years | 32 (3.3%) | 25 (2.9%) |
| 25 to 29 Years | 57 (5.9%) | 108 (12.5%) |
| 30 to 34 Years | 77 (8.0%) | 100 (11.6%) |
| 35 to 39 Years | 111 (11.5%) | 21 (2.4%) |
| 40 to 44 Years | 33 (3.4%) | 69 (8.0%) |
| 45 to 49 Years | 64 (6.6%) | 83 (9.6%) |
| 50 to 54 Years | 109 (11.3%) | 60 (6.9%) |
| 55 to 59 Years | 36 (3.7%) | 37 (4.3%) |
| 60 to 64 Years | 27 (2.8%) | 42 (4.9%) |
| 65 to 69 Years | 24 (2.5%) | 54 (6.2%) |
| 70 to 74 Years | 46 (4.8%) | 37 (4.3%) |
| 75 to 79 Years | 26 (2.7%) | 33 (3.8%) |
| 80 to 84 Years | 8 (0.8%) | 3 (0.4%) |
| 85 Years and over | 0 (0.0%) | 9 (1.0%) |
| Total | 968 (100.0%) | 865 (100.0%) |
Families and Households in Jeffersonville
Median Family Size in Jeffersonville
The median family size in Jeffersonville is 3.12 persons per family, with single female/mother families (112 | 22.6%) accounting for the largest median family size of 3.47 persons per family. On the other hand, single male/father families (32 | 6.5%) represent the smallest median family size with 2.63 persons per family.
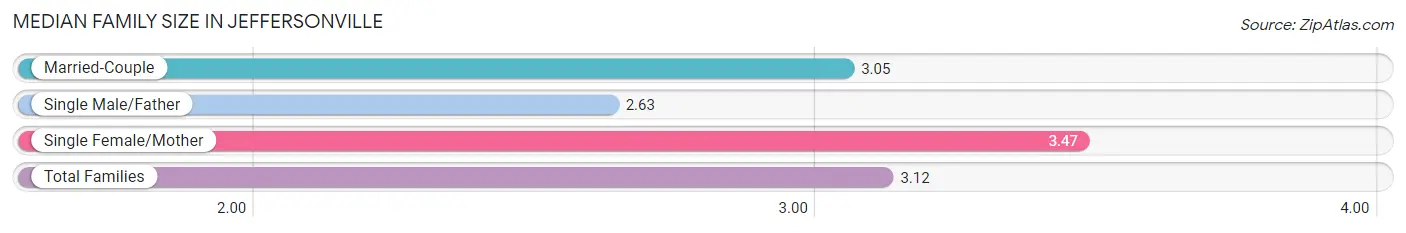
| Family Type | # Families | Family Size |
| Married-Couple | 352 (71.0%) | 3.05 |
| Single Male/Father | 32 (6.5%) | 2.63 |
| Single Female/Mother | 112 (22.6%) | 3.47 |
| Total Families | 496 (100.0%) | 3.12 |
Median Household Size in Jeffersonville
The median household size in Jeffersonville is 2.92 persons per household, with single female/mother households (112 | 17.8%) accounting for the largest median household size of 3.57 persons per household. non-family households (132 | 21.0%) represent the smallest median household size with 1.16 persons per household.
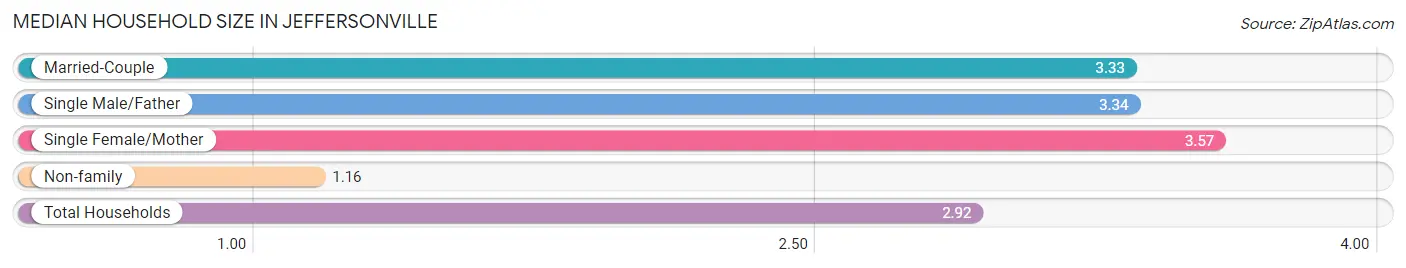
| Household Type | # Households | Household Size |
| Married-Couple | 352 (56.0%) | 3.33 |
| Single Male/Father | 32 (5.1%) | 3.34 |
| Single Female/Mother | 112 (17.8%) | 3.57 |
| Non-family | 132 (21.0%) | 1.16 |
| Total Households | 628 (100.0%) | 2.92 |
Household Size by Marriage Status in Jeffersonville
Out of a total of 628 households in Jeffersonville, 496 (79.0%) are family households, while 132 (21.0%) are nonfamily households. The most numerous type of family households are 2-person households, comprising 238, and the most common type of nonfamily households are 1-person households, comprising 113.
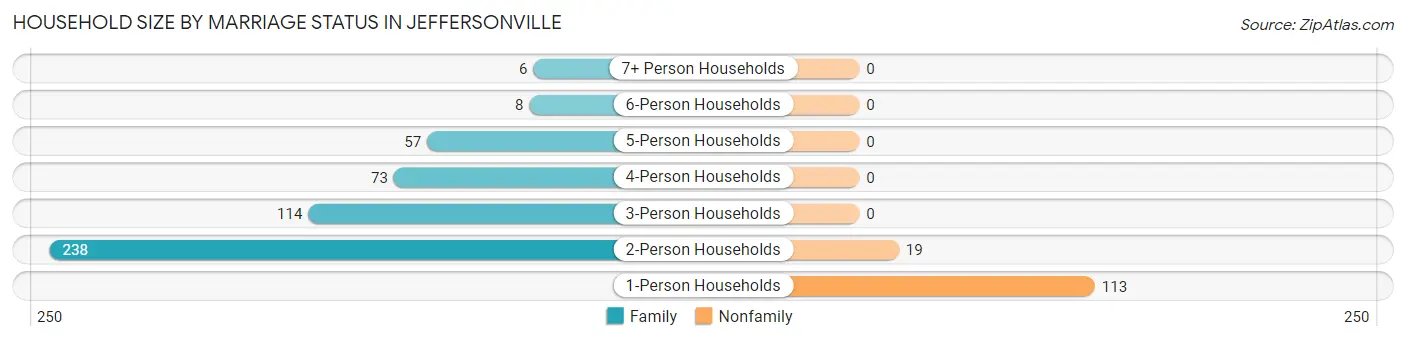
| Household Size | Family Households | Nonfamily Households |
| 1-Person Households | - | 113 (18.0%) |
| 2-Person Households | 238 (37.9%) | 19 (3.0%) |
| 3-Person Households | 114 (18.1%) | 0 (0.0%) |
| 4-Person Households | 73 (11.6%) | 0 (0.0%) |
| 5-Person Households | 57 (9.1%) | 0 (0.0%) |
| 6-Person Households | 8 (1.3%) | 0 (0.0%) |
| 7+ Person Households | 6 (1.0%) | 0 (0.0%) |
| Total | 496 (79.0%) | 132 (21.0%) |
Female Fertility in Jeffersonville
Fertility by Age in Jeffersonville
Average fertility rate in Jeffersonville is 25.0 births per 1,000 women. Women in the age bracket of 15 to 19 years have the highest fertility rate with 79.0 births per 1,000 women. Women in the age bracket of 20 to 34 years acount for 45.5% of all women with births.
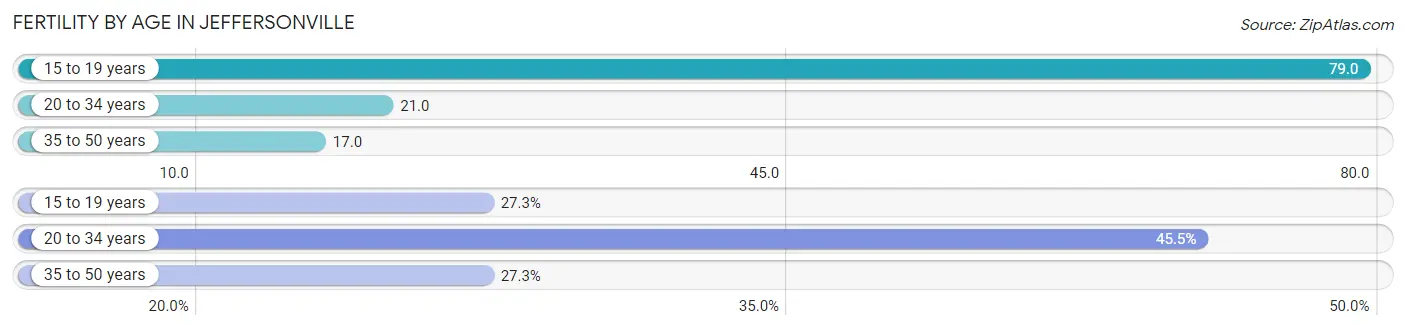
| Age Bracket | Women with Births | Births / 1,000 Women |
| 15 to 19 years | 3 (27.3%) | 79.0 |
| 20 to 34 years | 5 (45.5%) | 21.0 |
| 35 to 50 years | 3 (27.3%) | 17.0 |
| Total | 11 (100.0%) | 25.0 |
Fertility by Age by Marriage Status in Jeffersonville
45.5% of women with births (11) in Jeffersonville are married. The highest percentage of unmarried women with births falls into 15 to 19 years age bracket with 100.0% of them unmarried at the time of birth, while the lowest percentage of unmarried women with births belong to 20 to 34 years age bracket with 0.0% of them unmarried.
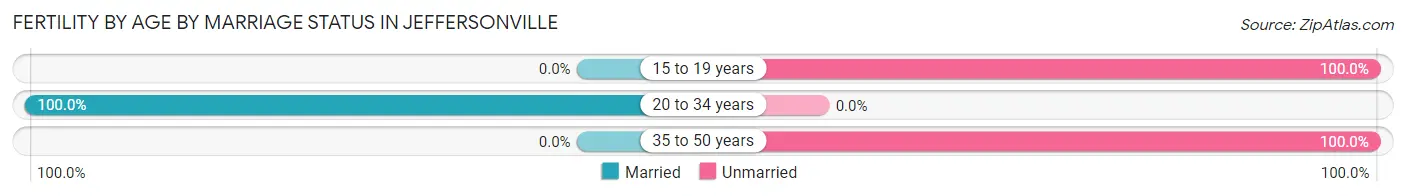
| Age Bracket | Married | Unmarried |
| 15 to 19 years | 0 (0.0%) | 3 (100.0%) |
| 20 to 34 years | 5 (100.0%) | 0 (0.0%) |
| 35 to 50 years | 0 (0.0%) | 3 (100.0%) |
| Total | 5 (45.5%) | 6 (54.5%) |
Fertility by Education in Jeffersonville
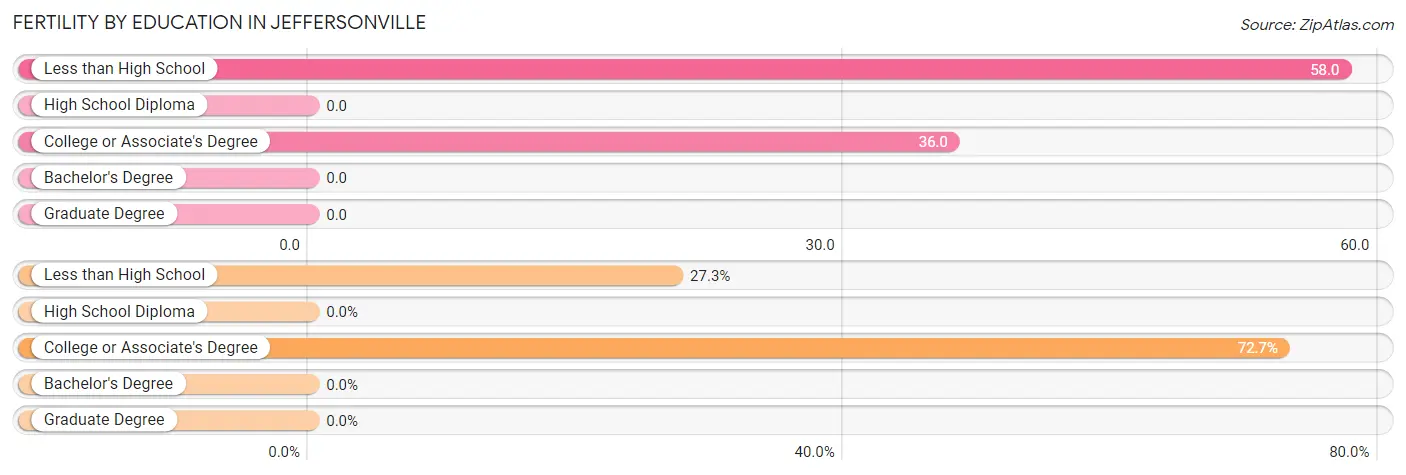
| Educational Attainment | Women with Births | Births / 1,000 Women |
| Less than High School | 3 (27.3%) | 58.0 |
| High School Diploma | 0 (0.0%) | 0.0 |
| College or Associate's Degree | 8 (72.7%) | 36.0 |
| Bachelor's Degree | 0 (0.0%) | 0.0 |
| Graduate Degree | 0 (0.0%) | 0.0 |
| Total | 11 (100.0%) | 25.0 |
Fertility by Education by Marriage Status in Jeffersonville
54.5% of women with births in Jeffersonville are unmarried. Women with the educational attainment of college or associate's degree are most likely to be married with 62.5% of them married at childbirth, while women with the educational attainment of less than high school are least likely to be married with 100.0% of them unmarried at childbirth.
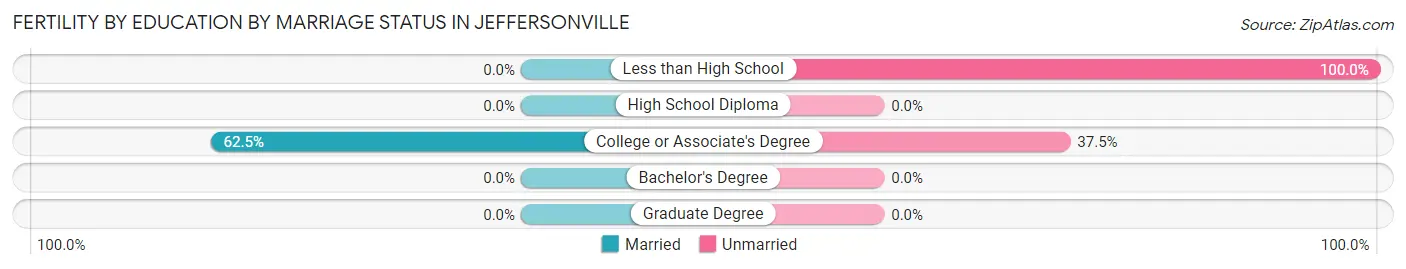
| Educational Attainment | Married | Unmarried |
| Less than High School | 0 (0.0%) | 3 (100.0%) |
| High School Diploma | 0 (0.0%) | 0 (0.0%) |
| College or Associate's Degree | 5 (62.5%) | 3 (37.5%) |
| Bachelor's Degree | 0 (0.0%) | 0 (0.0%) |
| Graduate Degree | 0 (0.0%) | 0 (0.0%) |
| Total | 5 (45.5%) | 6 (54.5%) |
Employment Characteristics in Jeffersonville
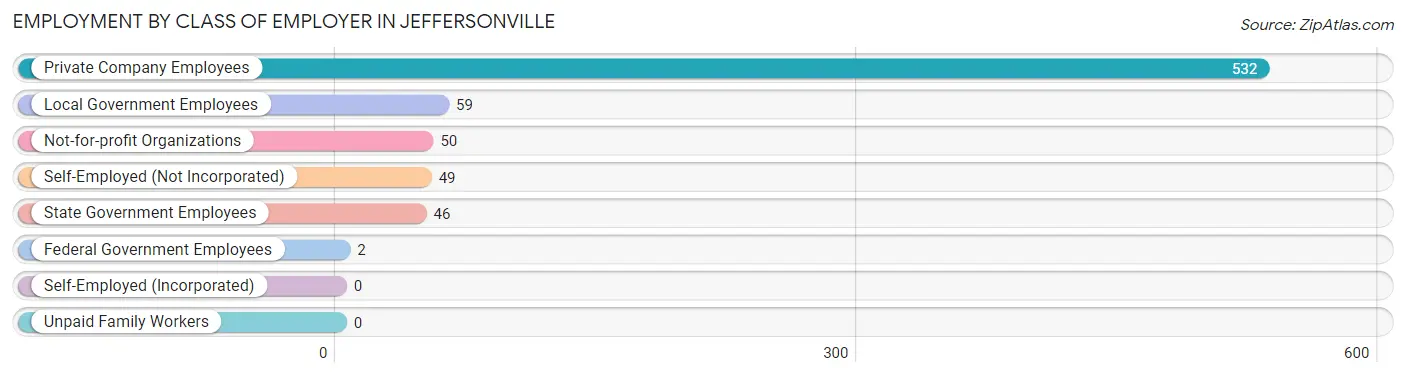
Employment by Class of Employer in Jeffersonville
Among the 738 employed individuals in Jeffersonville, private company employees (532 | 72.1%), local government employees (59 | 8.0%), and not-for-profit organizations (50 | 6.8%) make up the most common classes of employment.
| Employer Class | # Employees | % Employees |
| Private Company Employees | 532 | 72.1% |
| Self-Employed (Incorporated) | 0 | 0.0% |
| Self-Employed (Not Incorporated) | 49 | 6.6% |
| Not-for-profit Organizations | 50 | 6.8% |
| Local Government Employees | 59 | 8.0% |
| State Government Employees | 46 | 6.2% |
| Federal Government Employees | 2 | 0.3% |
| Unpaid Family Workers | 0 | 0.0% |
| Total | 738 | 100.0% |
Employment Status by Age in Jeffersonville
According to the labor force statistics for Jeffersonville, out of the total population over 16 years of age (1,403), 61.8% or 867 individuals are in the labor force, with 8.8% or 76 of them unemployed. The age group with the highest labor force participation rate is 45 to 54 years, with 84.5% or 267 individuals in the labor force. Within the labor force, the 16 to 19 years age range has the highest percentage of unemployed individuals, with 31.8% or 7 of them being unemployed.
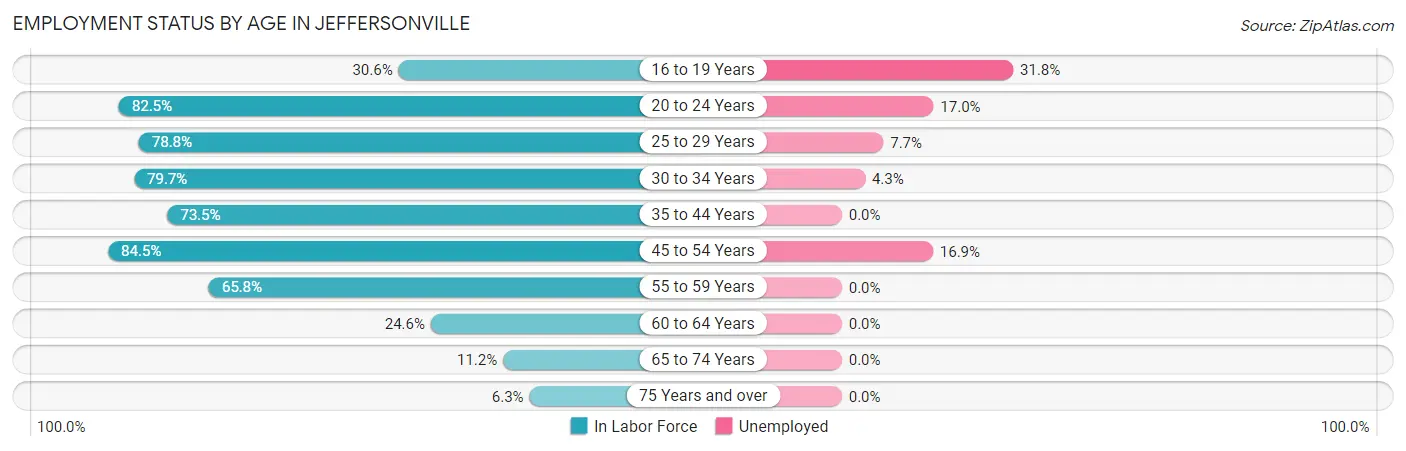
| Age Bracket | In Labor Force | Unemployed |
| 16 to 19 Years | 22 (30.6%) | 7 (31.8%) |
| 20 to 24 Years | 47 (82.5%) | 8 (17.0%) |
| 25 to 29 Years | 130 (78.8%) | 10 (7.7%) |
| 30 to 34 Years | 141 (79.7%) | 6 (4.3%) |
| 35 to 44 Years | 172 (73.5%) | 0 (0.0%) |
| 45 to 54 Years | 267 (84.5%) | 45 (16.9%) |
| 55 to 59 Years | 48 (65.8%) | 0 (0.0%) |
| 60 to 64 Years | 17 (24.6%) | 0 (0.0%) |
| 65 to 74 Years | 18 (11.2%) | 0 (0.0%) |
| 75 Years and over | 5 (6.3%) | 0 (0.0%) |
| Total | 867 (61.8%) | 76 (8.8%) |
Employment Status by Educational Attainment in Jeffersonville
According to labor force statistics for Jeffersonville, 75.0% of individuals (776) out of the total population between 25 and 64 years of age (1,034) are in the labor force, with 7.9% or 61 of them being unemployed. The group with the highest labor force participation rate are those with the educational attainment of college / associate degree, with 89.1% or 326 individuals in the labor force. Within the labor force, individuals with college / associate degree education have the highest percentage of unemployment, with 13.8% or 45 of them being unemployed.
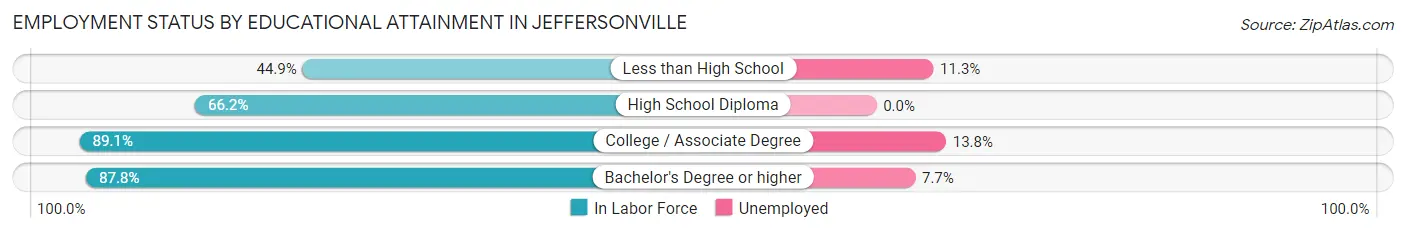
| Educational Attainment | In Labor Force | Unemployed |
| Less than High School | 53 (44.9%) | 13 (11.3%) |
| High School Diploma | 266 (66.2%) | 0 (0.0%) |
| College / Associate Degree | 326 (89.1%) | 51 (13.8%) |
| Bachelor's Degree or higher | 130 (87.8%) | 11 (7.7%) |
| Total | 776 (75.0%) | 82 (7.9%) |
Employment Occupations by Sex in Jeffersonville
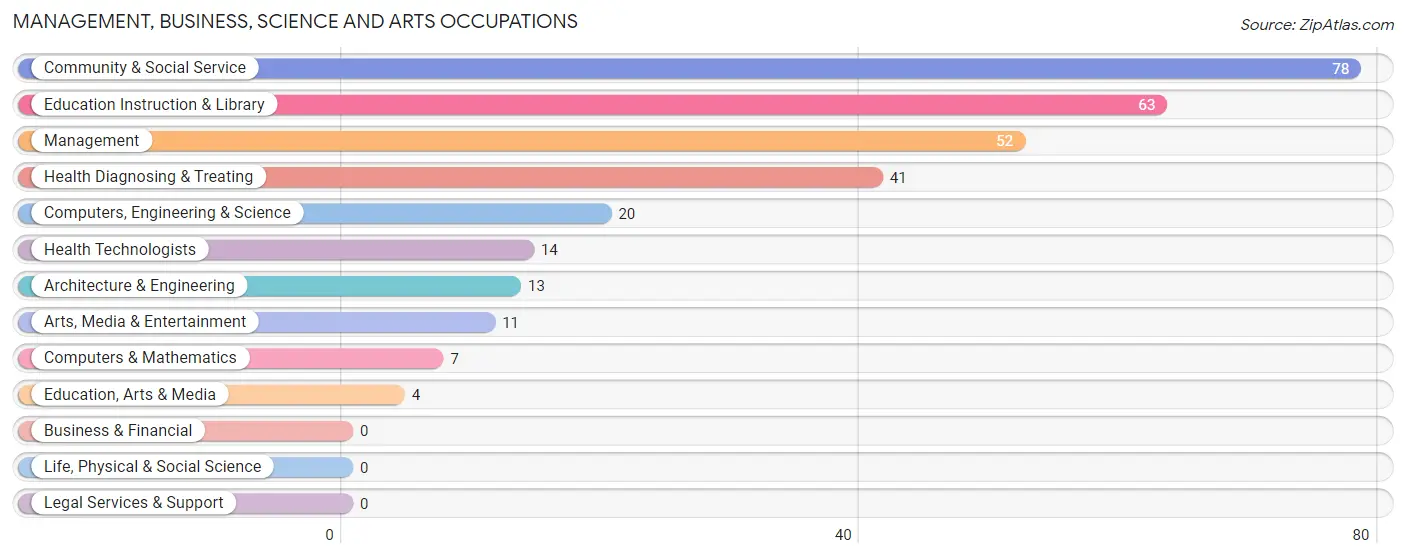
Management, Business, Science and Arts Occupations
The most common Management, Business, Science and Arts occupations in Jeffersonville are Community & Social Service (78 | 9.9%), Education Instruction & Library (63 | 8.0%), Management (52 | 6.6%), Health Diagnosing & Treating (41 | 5.2%), and Computers, Engineering & Science (20 | 2.5%).
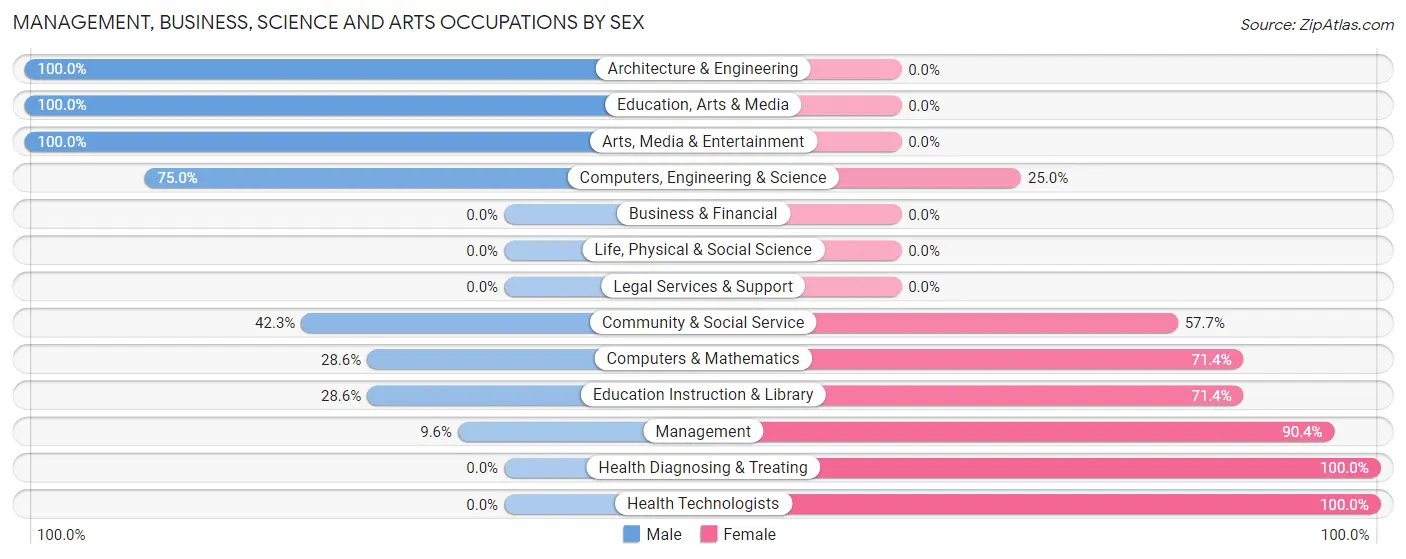
Management, Business, Science and Arts Occupations by Sex
Within the Management, Business, Science and Arts occupations in Jeffersonville, the most male-oriented occupations are Architecture & Engineering (100.0%), Education, Arts & Media (100.0%), and Arts, Media & Entertainment (100.0%), while the most female-oriented occupations are Health Diagnosing & Treating (100.0%), Health Technologists (100.0%), and Management (90.4%).
| Occupation | Male | Female |
| Management | 5 (9.6%) | 47 (90.4%) |
| Business & Financial | 0 (0.0%) | 0 (0.0%) |
| Computers, Engineering & Science | 15 (75.0%) | 5 (25.0%) |
| Computers & Mathematics | 2 (28.6%) | 5 (71.4%) |
| Architecture & Engineering | 13 (100.0%) | 0 (0.0%) |
| Life, Physical & Social Science | 0 (0.0%) | 0 (0.0%) |
| Community & Social Service | 33 (42.3%) | 45 (57.7%) |
| Education, Arts & Media | 4 (100.0%) | 0 (0.0%) |
| Legal Services & Support | 0 (0.0%) | 0 (0.0%) |
| Education Instruction & Library | 18 (28.6%) | 45 (71.4%) |
| Arts, Media & Entertainment | 11 (100.0%) | 0 (0.0%) |
| Health Diagnosing & Treating | 0 (0.0%) | 41 (100.0%) |
| Health Technologists | 0 (0.0%) | 14 (100.0%) |
| Total (Category) | 53 (27.8%) | 138 (72.3%) |
| Total (Overall) | 388 (49.0%) | 403 (50.9%) |
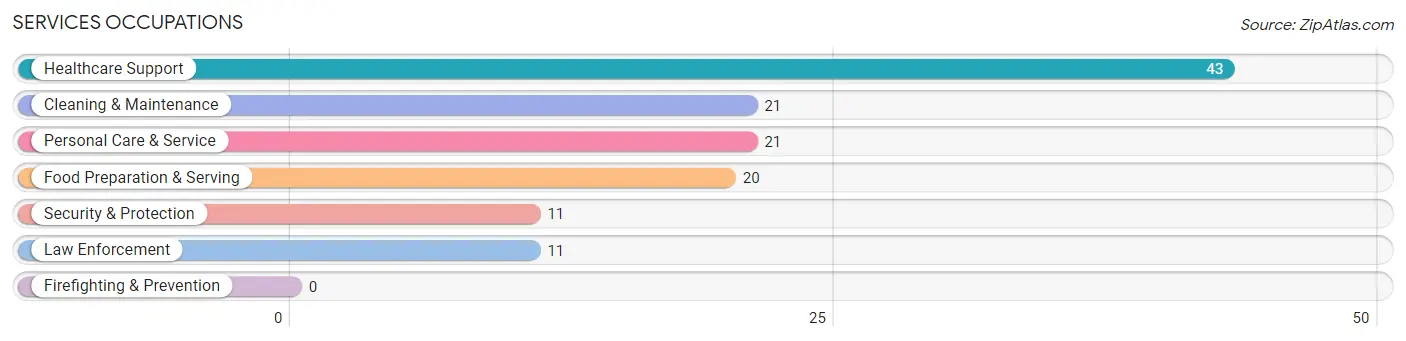
Services Occupations
The most common Services occupations in Jeffersonville are Healthcare Support (43 | 5.4%), Cleaning & Maintenance (21 | 2.6%), Personal Care & Service (21 | 2.6%), Food Preparation & Serving (20 | 2.5%), and Security & Protection (11 | 1.4%).
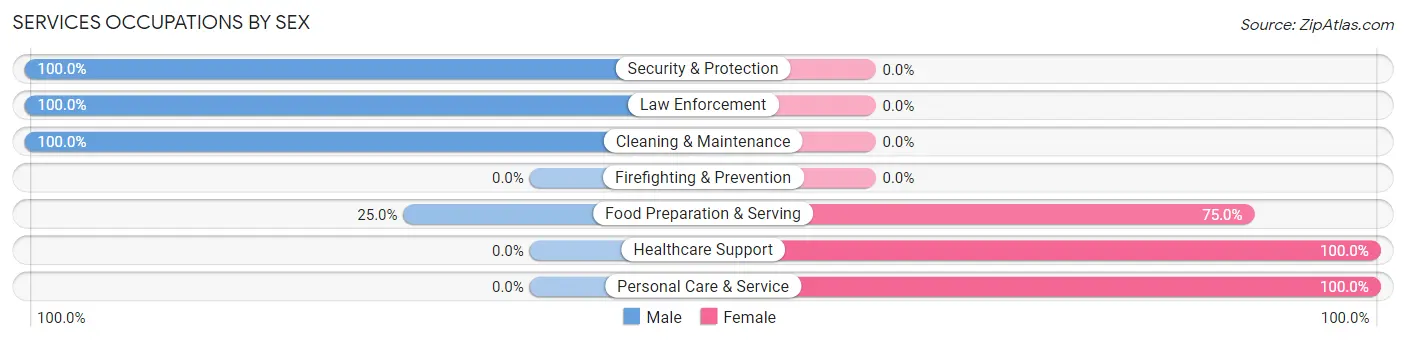
Services Occupations by Sex
Within the Services occupations in Jeffersonville, the most male-oriented occupations are Security & Protection (100.0%), Law Enforcement (100.0%), and Cleaning & Maintenance (100.0%), while the most female-oriented occupations are Healthcare Support (100.0%), Personal Care & Service (100.0%), and Food Preparation & Serving (75.0%).
| Occupation | Male | Female |
| Healthcare Support | 0 (0.0%) | 43 (100.0%) |
| Security & Protection | 11 (100.0%) | 0 (0.0%) |
| Firefighting & Prevention | 0 (0.0%) | 0 (0.0%) |
| Law Enforcement | 11 (100.0%) | 0 (0.0%) |
| Food Preparation & Serving | 5 (25.0%) | 15 (75.0%) |
| Cleaning & Maintenance | 21 (100.0%) | 0 (0.0%) |
| Personal Care & Service | 0 (0.0%) | 21 (100.0%) |
| Total (Category) | 37 (31.9%) | 79 (68.1%) |
| Total (Overall) | 388 (49.0%) | 403 (50.9%) |
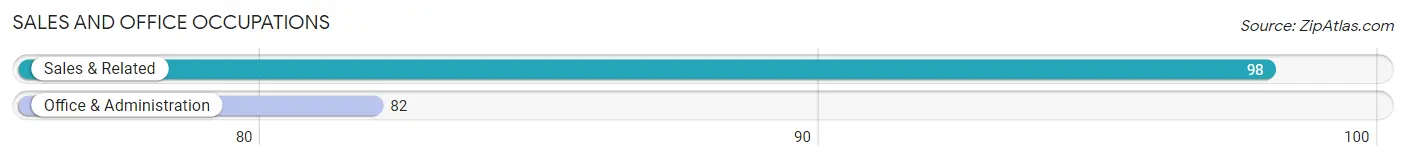
Sales and Office Occupations
The most common Sales and Office occupations in Jeffersonville are Sales & Related (98 | 12.4%), and Office & Administration (82 | 10.4%).
Sales and Office Occupations by Sex
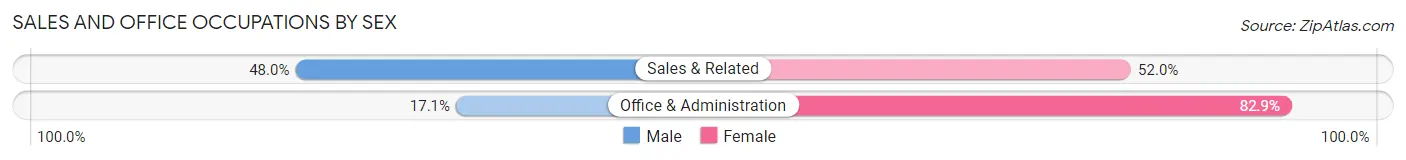
| Occupation | Male | Female |
| Sales & Related | 47 (48.0%) | 51 (52.0%) |
| Office & Administration | 14 (17.1%) | 68 (82.9%) |
| Total (Category) | 61 (33.9%) | 119 (66.1%) |
| Total (Overall) | 388 (49.0%) | 403 (50.9%) |
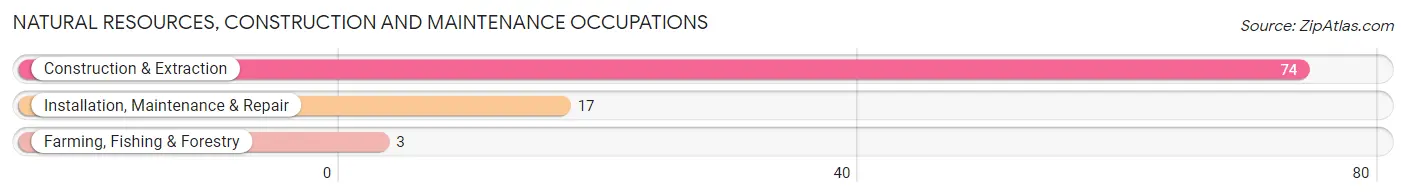
Natural Resources, Construction and Maintenance Occupations
The most common Natural Resources, Construction and Maintenance occupations in Jeffersonville are Construction & Extraction (74 | 9.4%), Installation, Maintenance & Repair (17 | 2.1%), and Farming, Fishing & Forestry (3 | 0.4%).
Natural Resources, Construction and Maintenance Occupations by Sex
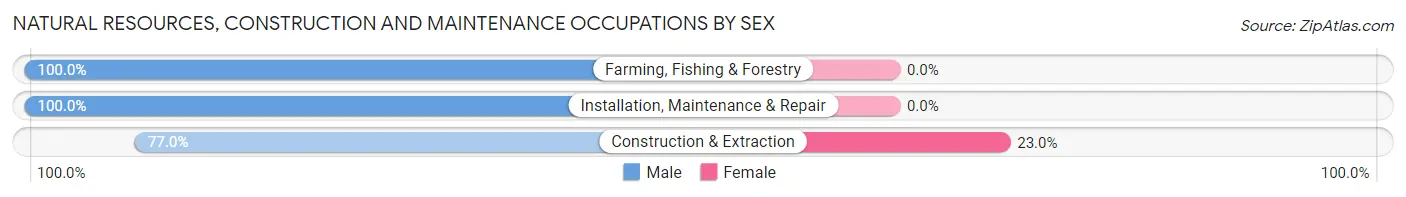
| Occupation | Male | Female |
| Farming, Fishing & Forestry | 3 (100.0%) | 0 (0.0%) |
| Construction & Extraction | 57 (77.0%) | 17 (23.0%) |
| Installation, Maintenance & Repair | 17 (100.0%) | 0 (0.0%) |
| Total (Category) | 77 (81.9%) | 17 (18.1%) |
| Total (Overall) | 388 (49.0%) | 403 (50.9%) |
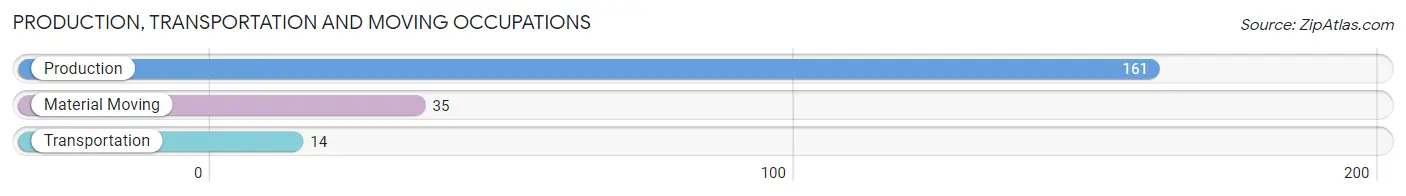
Production, Transportation and Moving Occupations
The most common Production, Transportation and Moving occupations in Jeffersonville are Production (161 | 20.3%), Material Moving (35 | 4.4%), and Transportation (14 | 1.8%).
Production, Transportation and Moving Occupations by Sex
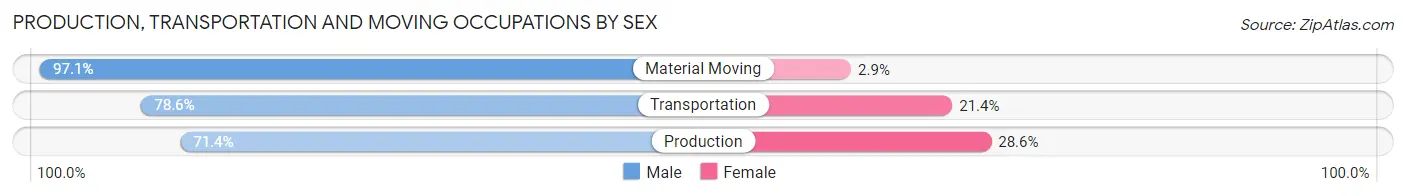
| Occupation | Male | Female |
| Production | 115 (71.4%) | 46 (28.6%) |
| Transportation | 11 (78.6%) | 3 (21.4%) |
| Material Moving | 34 (97.1%) | 1 (2.9%) |
| Total (Category) | 160 (76.2%) | 50 (23.8%) |
| Total (Overall) | 388 (49.0%) | 403 (50.9%) |
Employment Industries by Sex in Jeffersonville
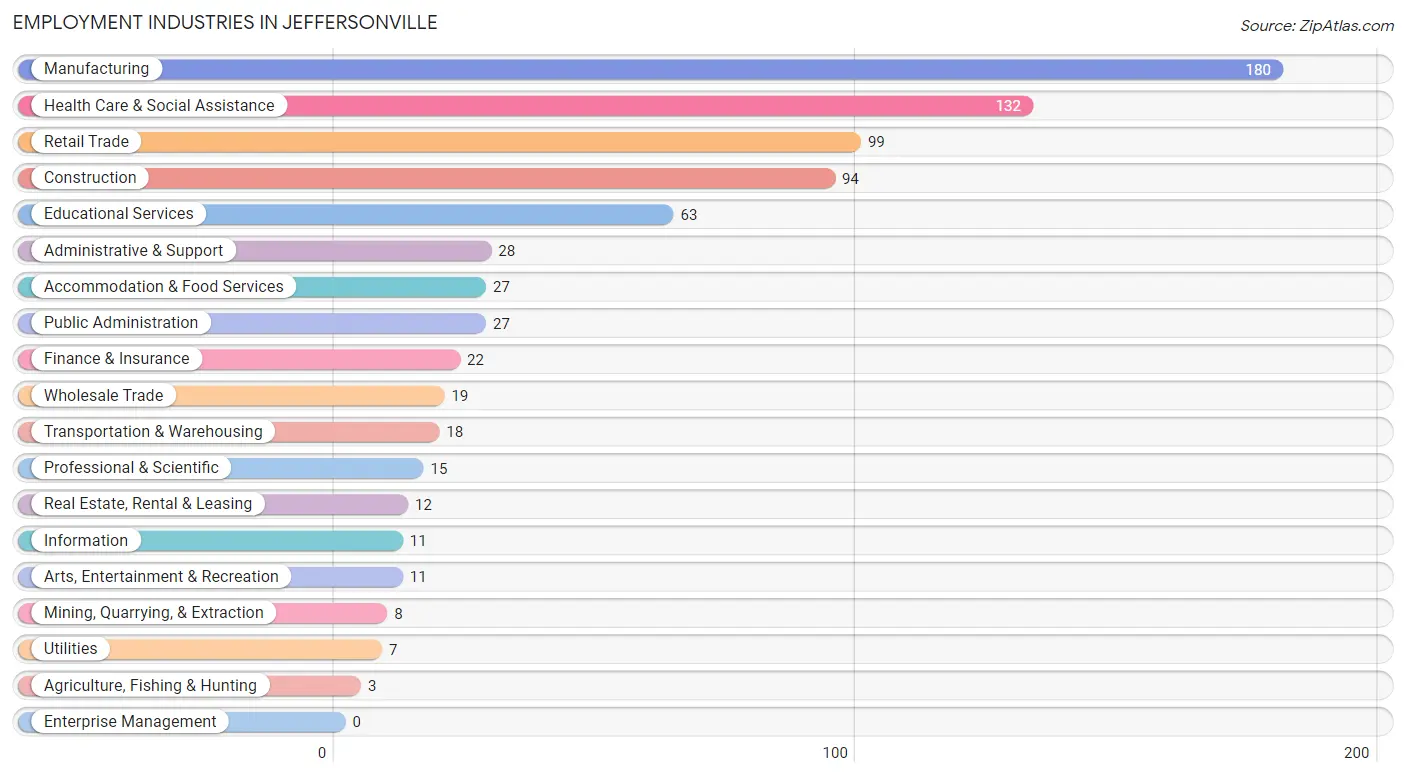
Employment Industries in Jeffersonville
The major employment industries in Jeffersonville include Manufacturing (180 | 22.8%), Health Care & Social Assistance (132 | 16.7%), Retail Trade (99 | 12.5%), Construction (94 | 11.9%), and Educational Services (63 | 8.0%).
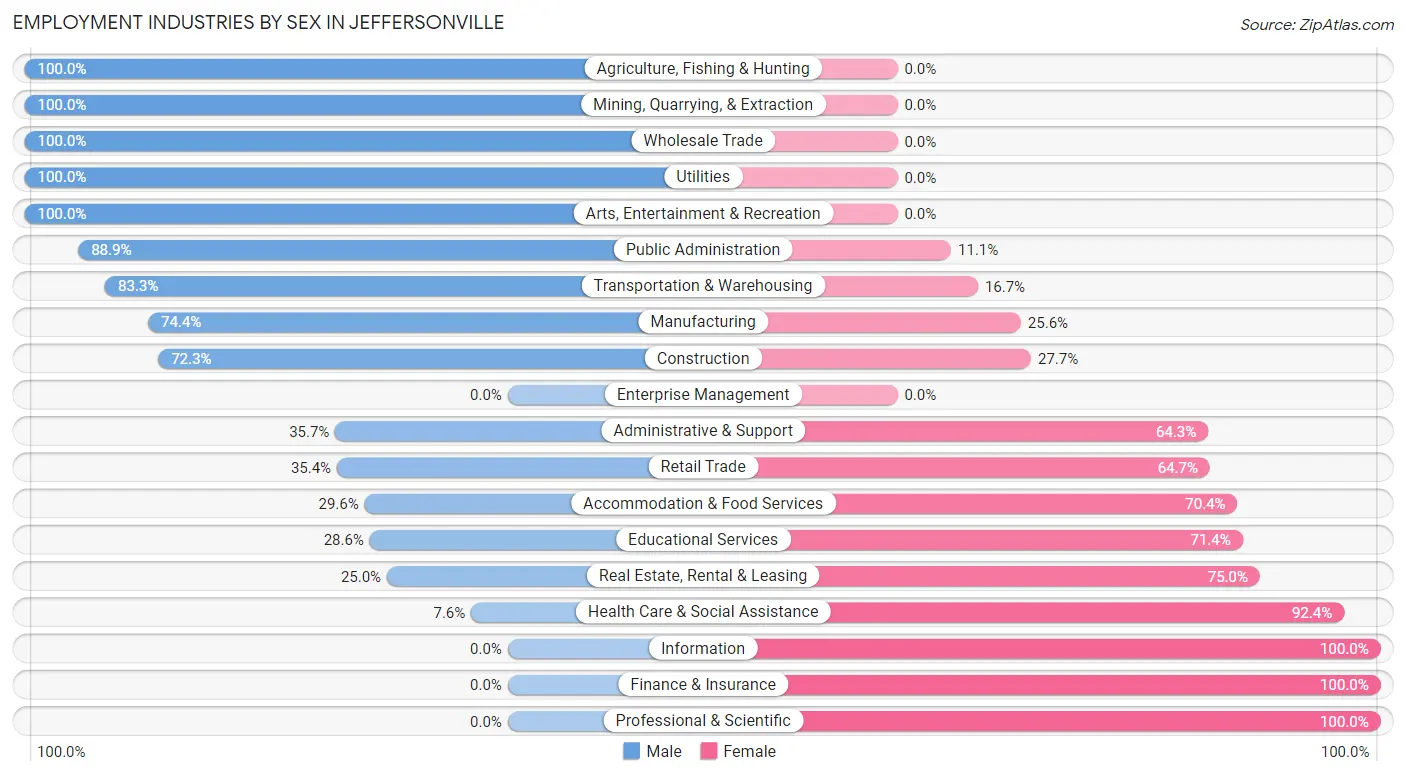
Employment Industries by Sex in Jeffersonville
The Jeffersonville industries that see more men than women are Agriculture, Fishing & Hunting (100.0%), Mining, Quarrying, & Extraction (100.0%), and Wholesale Trade (100.0%), whereas the industries that tend to have a higher number of women are Information (100.0%), Finance & Insurance (100.0%), and Professional & Scientific (100.0%).
| Industry | Male | Female |
| Agriculture, Fishing & Hunting | 3 (100.0%) | 0 (0.0%) |
| Mining, Quarrying, & Extraction | 8 (100.0%) | 0 (0.0%) |
| Construction | 68 (72.3%) | 26 (27.7%) |
| Manufacturing | 134 (74.4%) | 46 (25.6%) |
| Wholesale Trade | 19 (100.0%) | 0 (0.0%) |
| Retail Trade | 35 (35.3%) | 64 (64.6%) |
| Transportation & Warehousing | 15 (83.3%) | 3 (16.7%) |
| Utilities | 7 (100.0%) | 0 (0.0%) |
| Information | 0 (0.0%) | 11 (100.0%) |
| Finance & Insurance | 0 (0.0%) | 22 (100.0%) |
| Real Estate, Rental & Leasing | 3 (25.0%) | 9 (75.0%) |
| Professional & Scientific | 0 (0.0%) | 15 (100.0%) |
| Enterprise Management | 0 (0.0%) | 0 (0.0%) |
| Administrative & Support | 10 (35.7%) | 18 (64.3%) |
| Educational Services | 18 (28.6%) | 45 (71.4%) |
| Health Care & Social Assistance | 10 (7.6%) | 122 (92.4%) |
| Arts, Entertainment & Recreation | 11 (100.0%) | 0 (0.0%) |
| Accommodation & Food Services | 8 (29.6%) | 19 (70.4%) |
| Public Administration | 24 (88.9%) | 3 (11.1%) |
| Total | 388 (49.0%) | 403 (50.9%) |
Education in Jeffersonville
School Enrollment in Jeffersonville
The most common levels of schooling among the 468 students in Jeffersonville are middle school (219 | 46.8%), elementary school (124 | 26.5%), and high school (72 | 15.4%).
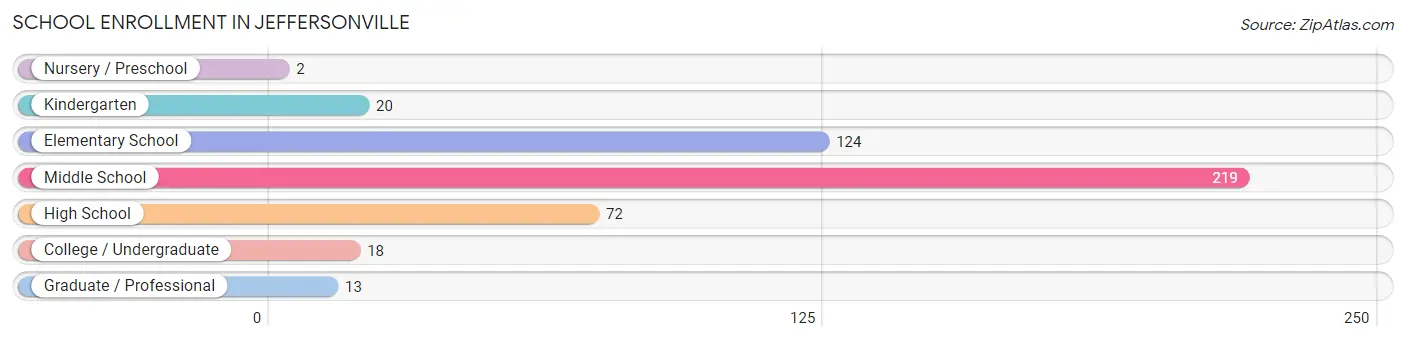
| School Level | # Students | % Students |
| Nursery / Preschool | 2 | 0.4% |
| Kindergarten | 20 | 4.3% |
| Elementary School | 124 | 26.5% |
| Middle School | 219 | 46.8% |
| High School | 72 | 15.4% |
| College / Undergraduate | 18 | 3.8% |
| Graduate / Professional | 13 | 2.8% |
| Total | 468 | 100.0% |
School Enrollment by Age by Funding Source in Jeffersonville
Out of a total of 468 students who are enrolled in schools in Jeffersonville, 42 (9.0%) attend a private institution, while the remaining 426 (91.0%) are enrolled in public schools. The age group of 18 to 19 year olds has the highest likelihood of being enrolled in private schools, with 3 (27.3% in the age bracket) enrolled. Conversely, the age group of 3 to 4 year olds has the lowest likelihood of being enrolled in a private school, with 2 (100.0% in the age bracket) attending a public institution.
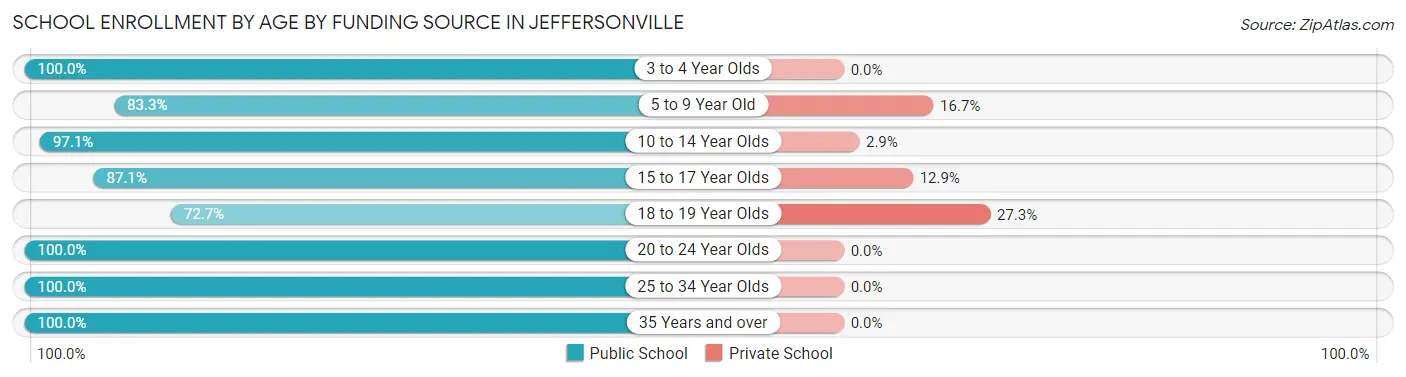
| Age Bracket | Public School | Private School |
| 3 to 4 Year Olds | 2 (100.0%) | 0 (0.0%) |
| 5 to 9 Year Old | 120 (83.3%) | 24 (16.7%) |
| 10 to 14 Year Olds | 204 (97.1%) | 6 (2.9%) |
| 15 to 17 Year Olds | 61 (87.1%) | 9 (12.9%) |
| 18 to 19 Year Olds | 8 (72.7%) | 3 (27.3%) |
| 20 to 24 Year Olds | 6 (100.0%) | 0 (0.0%) |
| 25 to 34 Year Olds | 16 (100.0%) | 0 (0.0%) |
| 35 Years and over | 9 (100.0%) | 0 (0.0%) |
| Total | 426 (91.0%) | 42 (9.0%) |
Educational Attainment by Field of Study in Jeffersonville
Education (43 | 25.4%), business (30 | 17.7%), science & technology (22 | 13.0%), psychology (17 | 10.1%), and liberal arts & history (17 | 10.1%) are the most common fields of study among 169 individuals in Jeffersonville who have obtained a bachelor's degree or higher.
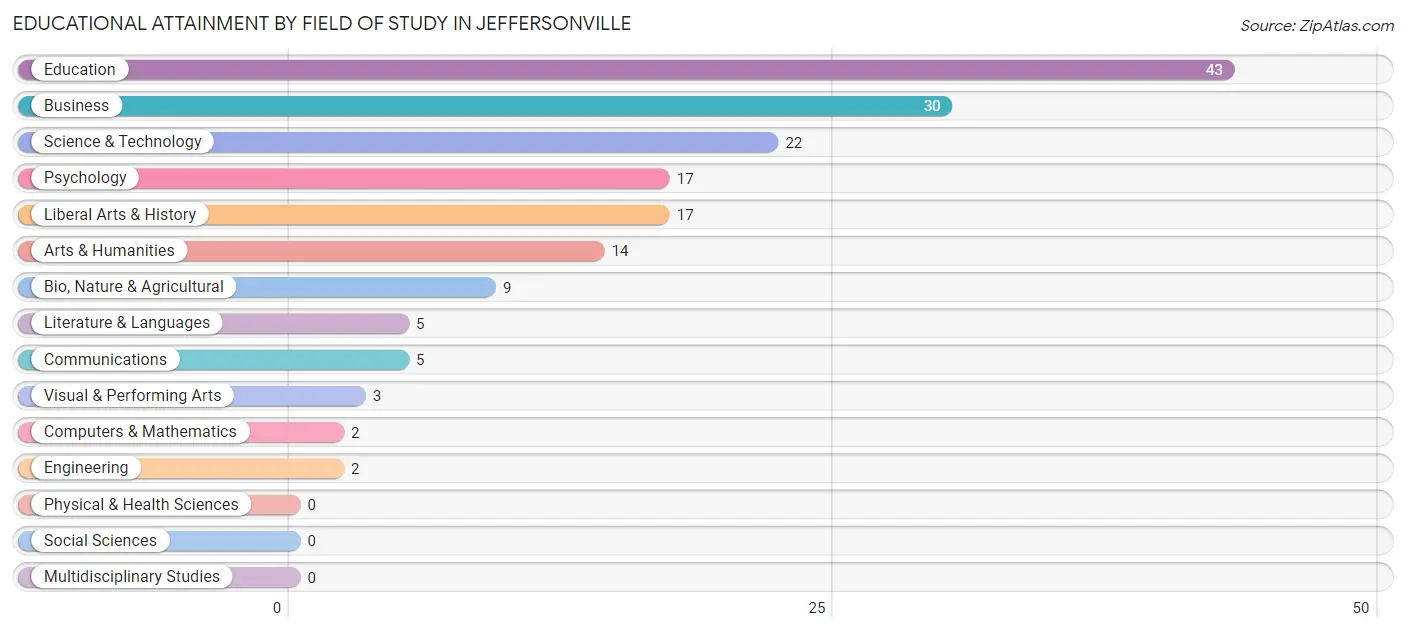
| Field of Study | # Graduates | % Graduates |
| Computers & Mathematics | 2 | 1.2% |
| Bio, Nature & Agricultural | 9 | 5.3% |
| Physical & Health Sciences | 0 | 0.0% |
| Psychology | 17 | 10.1% |
| Social Sciences | 0 | 0.0% |
| Engineering | 2 | 1.2% |
| Multidisciplinary Studies | 0 | 0.0% |
| Science & Technology | 22 | 13.0% |
| Business | 30 | 17.7% |
| Education | 43 | 25.4% |
| Literature & Languages | 5 | 3.0% |
| Liberal Arts & History | 17 | 10.1% |
| Visual & Performing Arts | 3 | 1.8% |
| Communications | 5 | 3.0% |
| Arts & Humanities | 14 | 8.3% |
| Total | 169 | 100.0% |
Transportation & Commute in Jeffersonville
Vehicle Availability by Sex in Jeffersonville
The most prevalent vehicle ownership categories in Jeffersonville are males with 2 vehicles (180, accounting for 48.5%) and females with 2 vehicles (162, making up 49.0%).
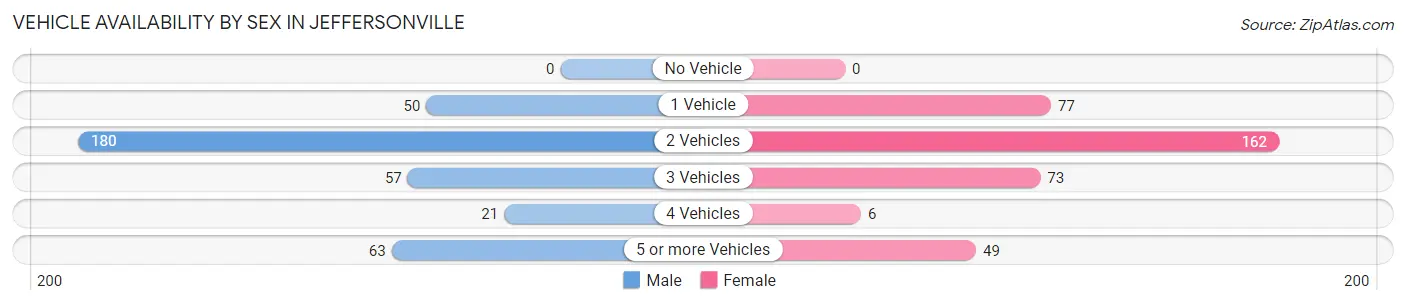
| Vehicles Available | Male | Female |
| No Vehicle | 0 (0.0%) | 0 (0.0%) |
| 1 Vehicle | 50 (13.5%) | 77 (21.0%) |
| 2 Vehicles | 180 (48.5%) | 162 (44.1%) |
| 3 Vehicles | 57 (15.4%) | 73 (19.9%) |
| 4 Vehicles | 21 (5.7%) | 6 (1.6%) |
| 5 or more Vehicles | 63 (17.0%) | 49 (13.4%) |
| Total | 371 (100.0%) | 367 (100.0%) |
Commute Time in Jeffersonville
The most frequently occuring commute durations in Jeffersonville are 15 to 19 minutes (175 commuters, 24.1%), 60 to 89 minutes (130 commuters, 17.9%), and 20 to 24 minutes (100 commuters, 13.8%).
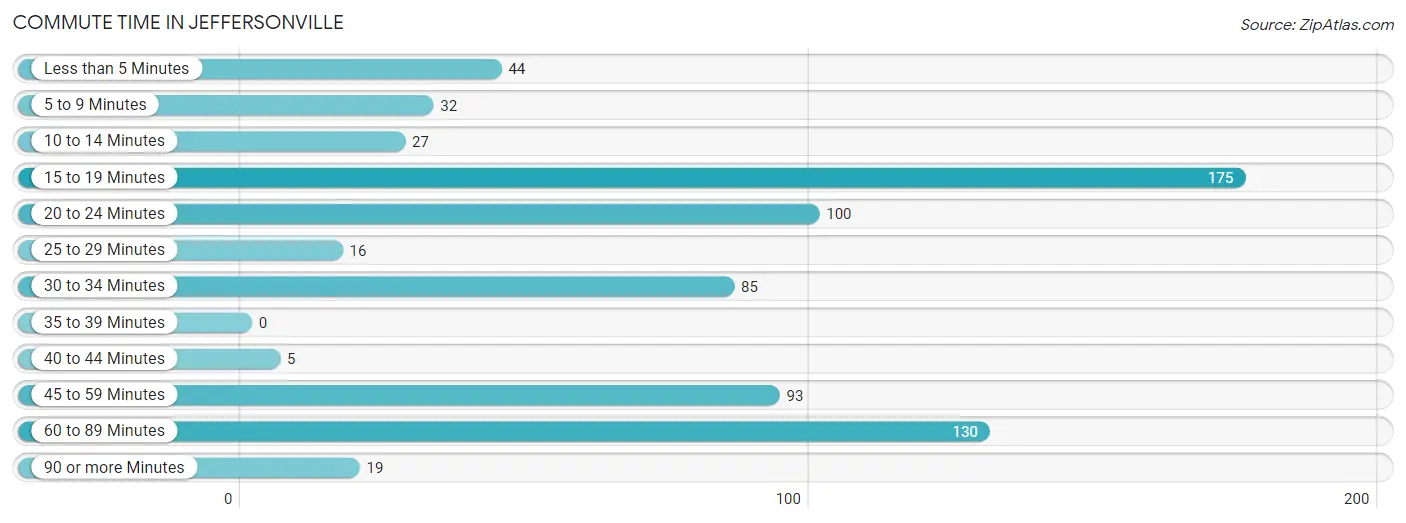
| Commute Time | # Commuters | % Commuters |
| Less than 5 Minutes | 44 | 6.1% |
| 5 to 9 Minutes | 32 | 4.4% |
| 10 to 14 Minutes | 27 | 3.7% |
| 15 to 19 Minutes | 175 | 24.1% |
| 20 to 24 Minutes | 100 | 13.8% |
| 25 to 29 Minutes | 16 | 2.2% |
| 30 to 34 Minutes | 85 | 11.7% |
| 35 to 39 Minutes | 0 | 0.0% |
| 40 to 44 Minutes | 5 | 0.7% |
| 45 to 59 Minutes | 93 | 12.8% |
| 60 to 89 Minutes | 130 | 17.9% |
| 90 or more Minutes | 19 | 2.6% |
Commute Time by Sex in Jeffersonville
The most common commute times in Jeffersonville are 60 to 89 minutes (94 commuters, 26.1%) for males and 15 to 19 minutes (112 commuters, 30.6%) for females.
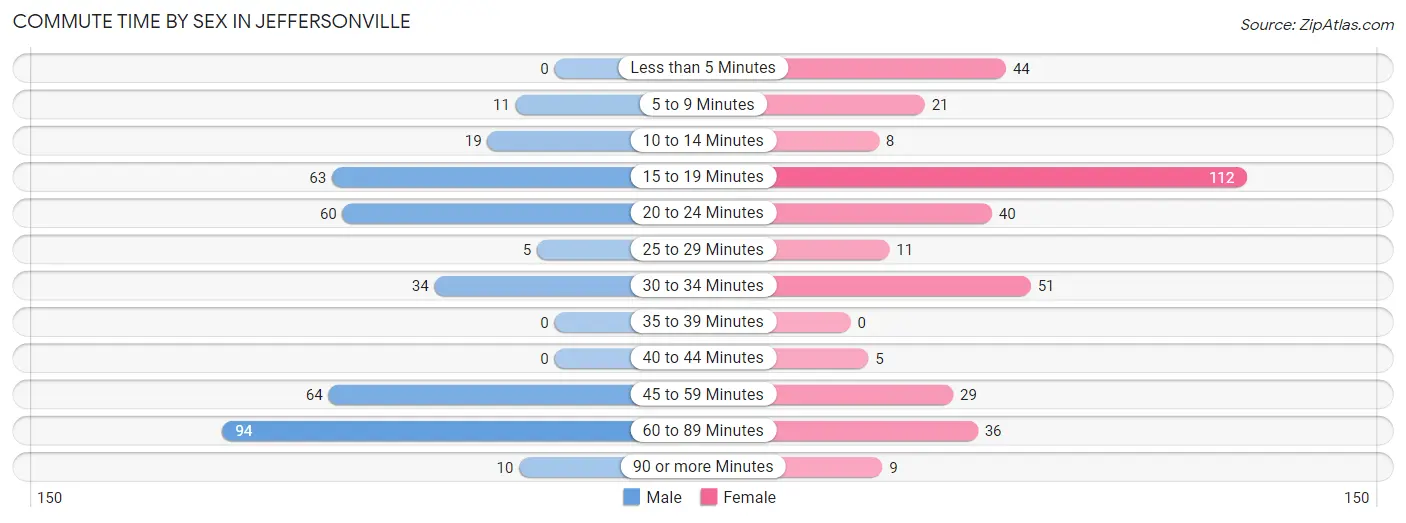
| Commute Time | Male | Female |
| Less than 5 Minutes | 0 (0.0%) | 44 (12.0%) |
| 5 to 9 Minutes | 11 (3.1%) | 21 (5.7%) |
| 10 to 14 Minutes | 19 (5.3%) | 8 (2.2%) |
| 15 to 19 Minutes | 63 (17.5%) | 112 (30.6%) |
| 20 to 24 Minutes | 60 (16.7%) | 40 (10.9%) |
| 25 to 29 Minutes | 5 (1.4%) | 11 (3.0%) |
| 30 to 34 Minutes | 34 (9.4%) | 51 (13.9%) |
| 35 to 39 Minutes | 0 (0.0%) | 0 (0.0%) |
| 40 to 44 Minutes | 0 (0.0%) | 5 (1.4%) |
| 45 to 59 Minutes | 64 (17.8%) | 29 (7.9%) |
| 60 to 89 Minutes | 94 (26.1%) | 36 (9.8%) |
| 90 or more Minutes | 10 (2.8%) | 9 (2.5%) |
Time of Departure to Work by Sex in Jeffersonville
The most frequent times of departure to work in Jeffersonville are 7:00 AM to 7:29 AM (105, 29.2%) for males and 5:30 AM to 5:59 AM (53, 14.5%) for females.
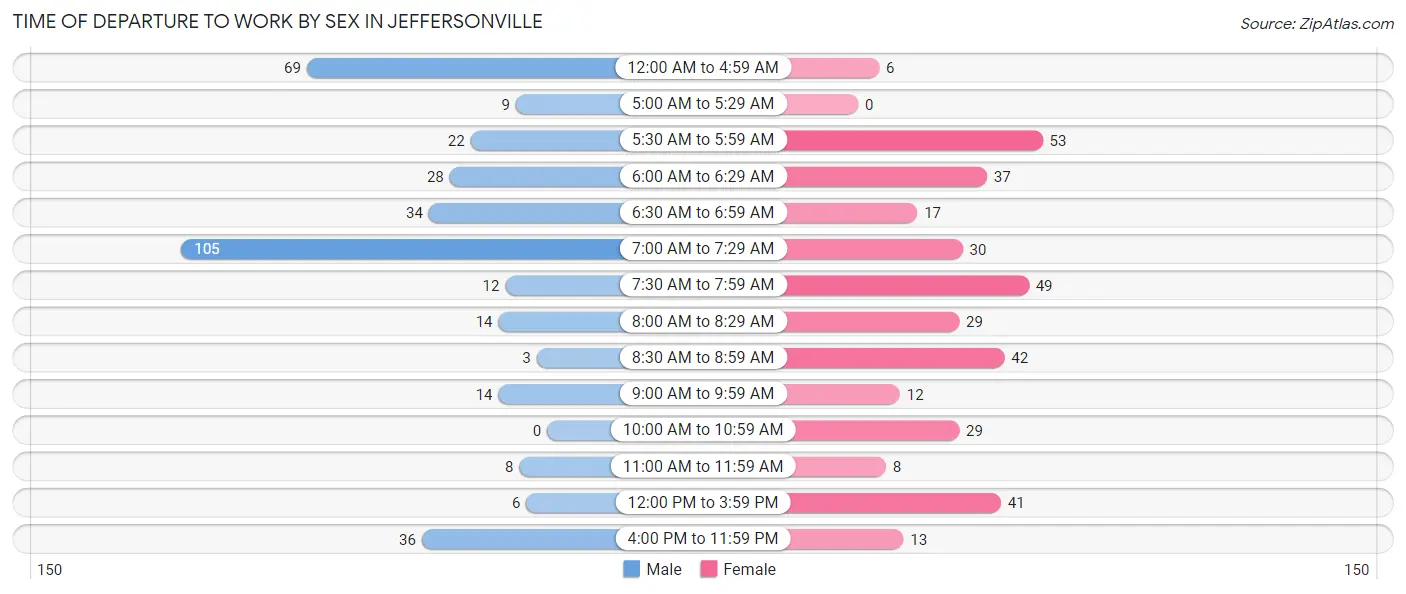
| Time of Departure | Male | Female |
| 12:00 AM to 4:59 AM | 69 (19.2%) | 6 (1.6%) |
| 5:00 AM to 5:29 AM | 9 (2.5%) | 0 (0.0%) |
| 5:30 AM to 5:59 AM | 22 (6.1%) | 53 (14.5%) |
| 6:00 AM to 6:29 AM | 28 (7.8%) | 37 (10.1%) |
| 6:30 AM to 6:59 AM | 34 (9.4%) | 17 (4.6%) |
| 7:00 AM to 7:29 AM | 105 (29.2%) | 30 (8.2%) |
| 7:30 AM to 7:59 AM | 12 (3.3%) | 49 (13.4%) |
| 8:00 AM to 8:29 AM | 14 (3.9%) | 29 (7.9%) |
| 8:30 AM to 8:59 AM | 3 (0.8%) | 42 (11.5%) |
| 9:00 AM to 9:59 AM | 14 (3.9%) | 12 (3.3%) |
| 10:00 AM to 10:59 AM | 0 (0.0%) | 29 (7.9%) |
| 11:00 AM to 11:59 AM | 8 (2.2%) | 8 (2.2%) |
| 12:00 PM to 3:59 PM | 6 (1.7%) | 41 (11.2%) |
| 4:00 PM to 11:59 PM | 36 (10.0%) | 13 (3.5%) |
| Total | 360 (100.0%) | 366 (100.0%) |
Housing Occupancy in Jeffersonville
Occupancy by Ownership in Jeffersonville
Of the total 628 dwellings in Jeffersonville, owner-occupied units account for 438 (69.8%), while renter-occupied units make up 190 (30.2%).
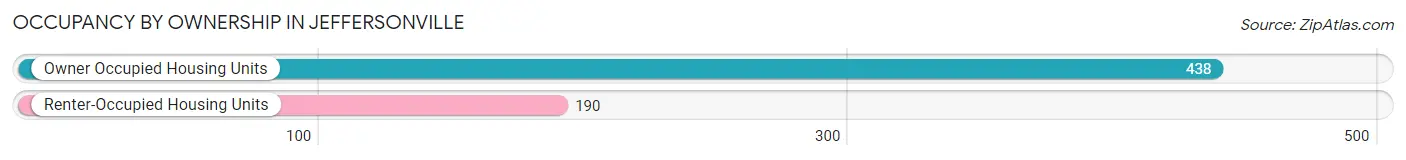
| Occupancy | # Housing Units | % Housing Units |
| Owner Occupied Housing Units | 438 | 69.8% |
| Renter-Occupied Housing Units | 190 | 30.2% |
| Total Occupied Housing Units | 628 | 100.0% |
Occupancy by Household Size in Jeffersonville
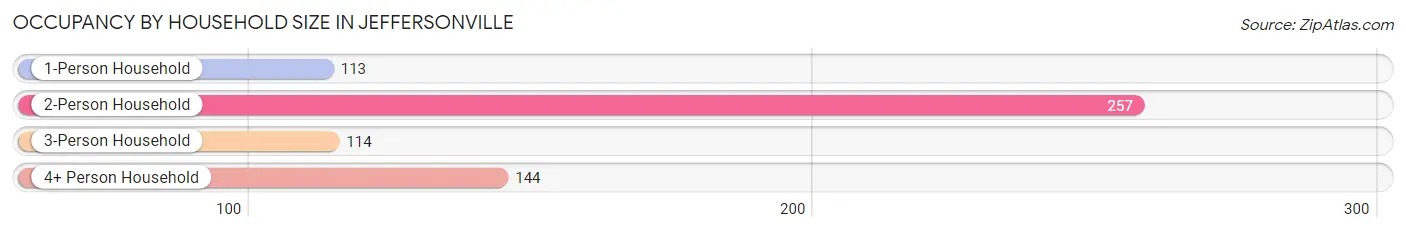
| Household Size | # Housing Units | % Housing Units |
| 1-Person Household | 113 | 18.0% |
| 2-Person Household | 257 | 40.9% |
| 3-Person Household | 114 | 18.1% |
| 4+ Person Household | 144 | 22.9% |
| Total Housing Units | 628 | 100.0% |
Occupancy by Ownership by Household Size in Jeffersonville
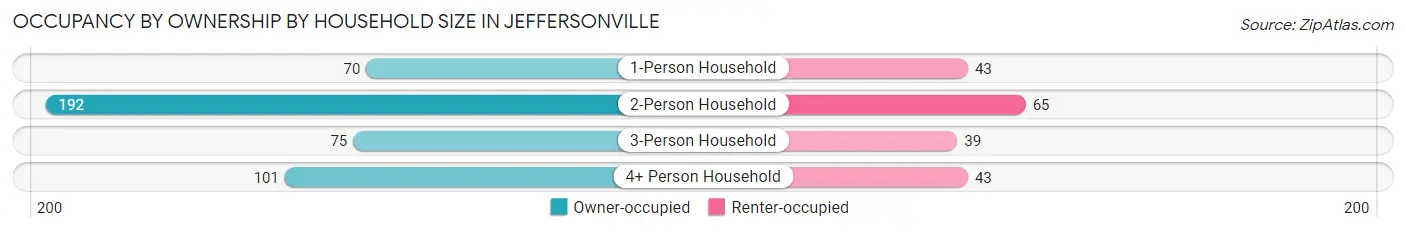
| Household Size | Owner-occupied | Renter-occupied |
| 1-Person Household | 70 (62.0%) | 43 (38.1%) |
| 2-Person Household | 192 (74.7%) | 65 (25.3%) |
| 3-Person Household | 75 (65.8%) | 39 (34.2%) |
| 4+ Person Household | 101 (70.1%) | 43 (29.9%) |
| Total Housing Units | 438 (69.8%) | 190 (30.2%) |
Occupancy by Educational Attainment in Jeffersonville
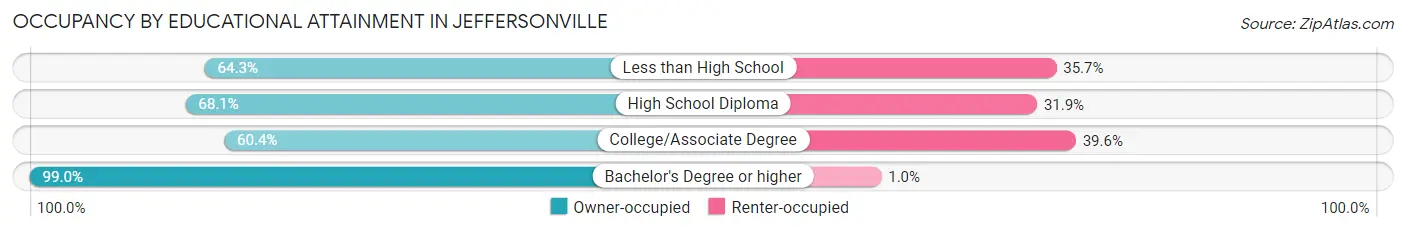
| Household Size | Owner-occupied | Renter-occupied |
| Less than High School | 45 (64.3%) | 25 (35.7%) |
| High School Diploma | 156 (68.1%) | 73 (31.9%) |
| College/Associate Degree | 139 (60.4%) | 91 (39.6%) |
| Bachelor's Degree or higher | 98 (99.0%) | 1 (1.0%) |
Occupancy by Age of Householder in Jeffersonville
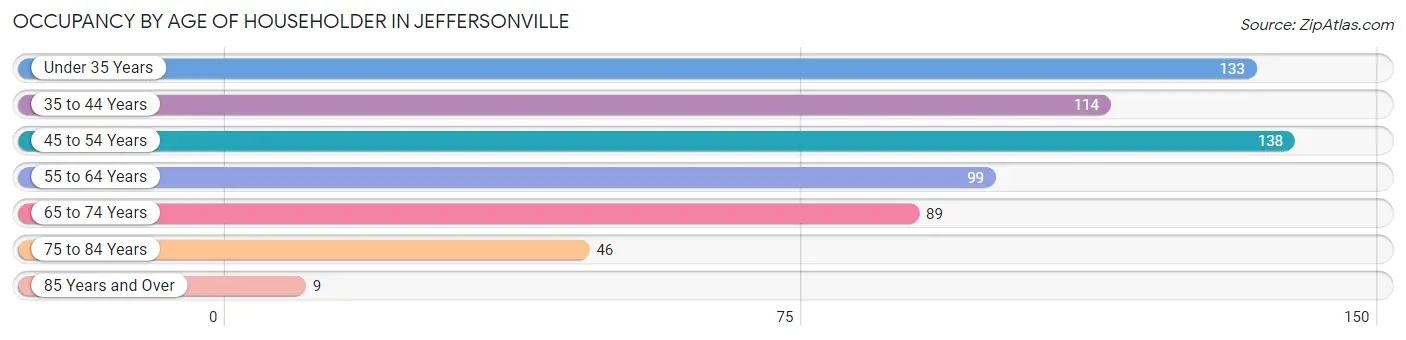
| Age Bracket | # Households | % Households |
| Under 35 Years | 133 | 21.2% |
| 35 to 44 Years | 114 | 18.1% |
| 45 to 54 Years | 138 | 22.0% |
| 55 to 64 Years | 99 | 15.8% |
| 65 to 74 Years | 89 | 14.2% |
| 75 to 84 Years | 46 | 7.3% |
| 85 Years and Over | 9 | 1.4% |
| Total | 628 | 100.0% |
Housing Finances in Jeffersonville
Median Income by Occupancy in Jeffersonville
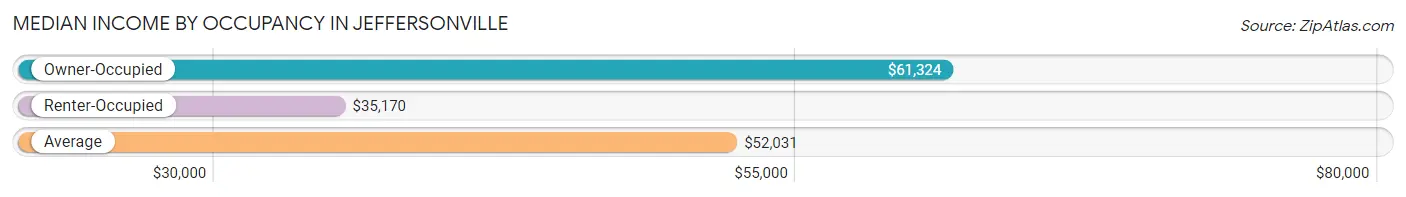
| Occupancy Type | # Households | Median Income |
| Owner-Occupied | 438 (69.8%) | $61,324 |
| Renter-Occupied | 190 (30.2%) | $35,170 |
| Average | 628 (100.0%) | $52,031 |
Occupancy by Householder Income Bracket in Jeffersonville
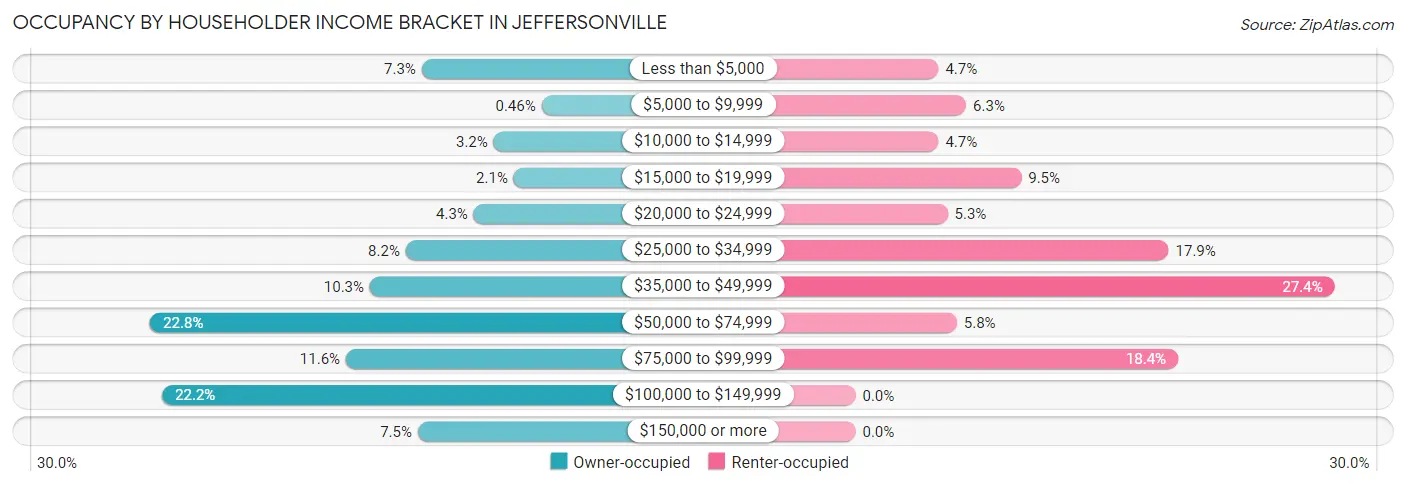
| Income Bracket | Owner-occupied | Renter-occupied |
| Less than $5,000 | 32 (7.3%) | 9 (4.7%) |
| $5,000 to $9,999 | 2 (0.5%) | 12 (6.3%) |
| $10,000 to $14,999 | 14 (3.2%) | 9 (4.7%) |
| $15,000 to $19,999 | 9 (2.1%) | 18 (9.5%) |
| $20,000 to $24,999 | 19 (4.3%) | 10 (5.3%) |
| $25,000 to $34,999 | 36 (8.2%) | 34 (17.9%) |
| $35,000 to $49,999 | 45 (10.3%) | 52 (27.4%) |
| $50,000 to $74,999 | 100 (22.8%) | 11 (5.8%) |
| $75,000 to $99,999 | 51 (11.6%) | 35 (18.4%) |
| $100,000 to $149,999 | 97 (22.2%) | 0 (0.0%) |
| $150,000 or more | 33 (7.5%) | 0 (0.0%) |
| Total | 438 (100.0%) | 190 (100.0%) |
Monthly Housing Cost Tiers in Jeffersonville
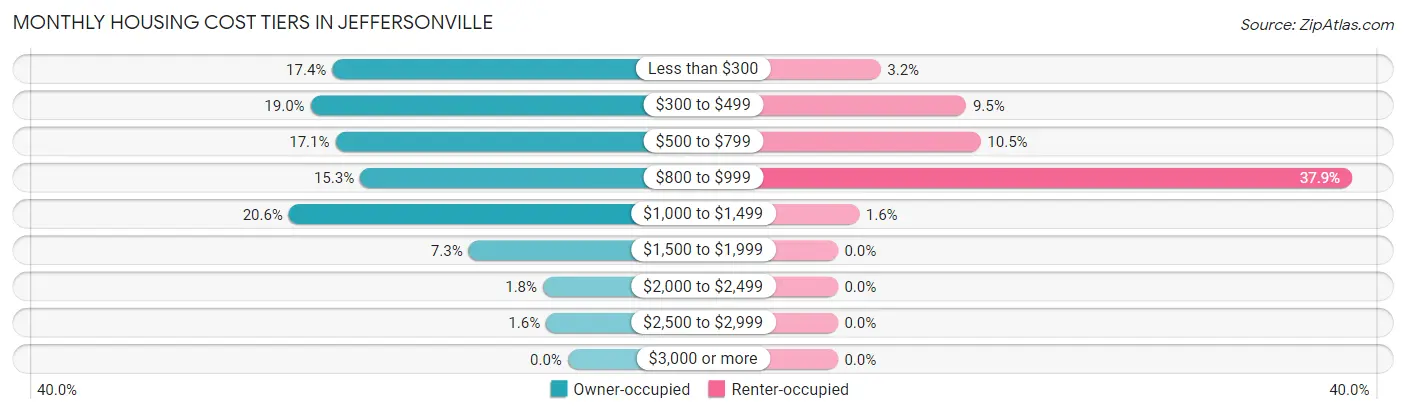
| Monthly Cost | Owner-occupied | Renter-occupied |
| Less than $300 | 76 (17.3%) | 6 (3.2%) |
| $300 to $499 | 83 (19.0%) | 18 (9.5%) |
| $500 to $799 | 75 (17.1%) | 20 (10.5%) |
| $800 to $999 | 67 (15.3%) | 72 (37.9%) |
| $1,000 to $1,499 | 90 (20.5%) | 3 (1.6%) |
| $1,500 to $1,999 | 32 (7.3%) | 0 (0.0%) |
| $2,000 to $2,499 | 8 (1.8%) | 0 (0.0%) |
| $2,500 to $2,999 | 7 (1.6%) | 0 (0.0%) |
| $3,000 or more | 0 (0.0%) | 0 (0.0%) |
| Total | 438 (100.0%) | 190 (100.0%) |
Physical Housing Characteristics in Jeffersonville
Housing Structures in Jeffersonville
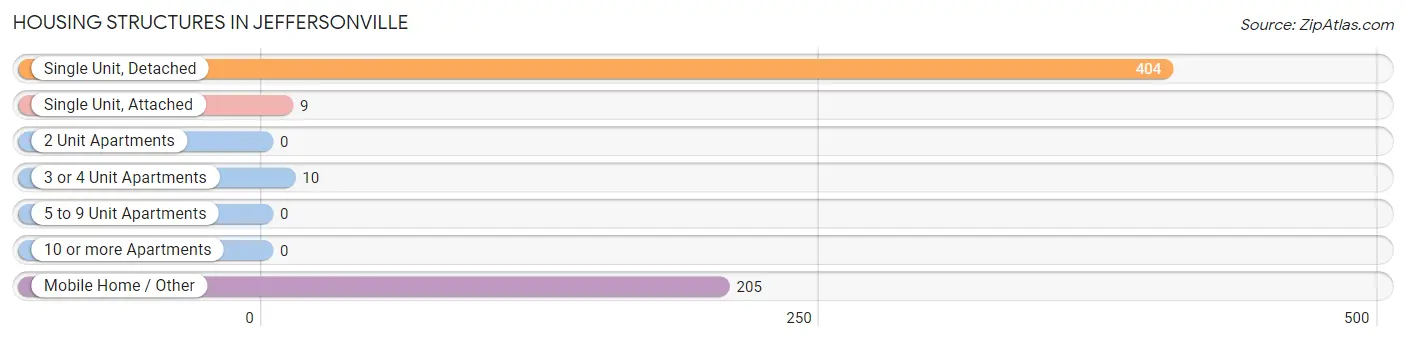
| Structure Type | # Housing Units | % Housing Units |
| Single Unit, Detached | 404 | 64.3% |
| Single Unit, Attached | 9 | 1.4% |
| 2 Unit Apartments | 0 | 0.0% |
| 3 or 4 Unit Apartments | 10 | 1.6% |
| 5 to 9 Unit Apartments | 0 | 0.0% |
| 10 or more Apartments | 0 | 0.0% |
| Mobile Home / Other | 205 | 32.6% |
| Total | 628 | 100.0% |
Housing Structures by Occupancy in Jeffersonville
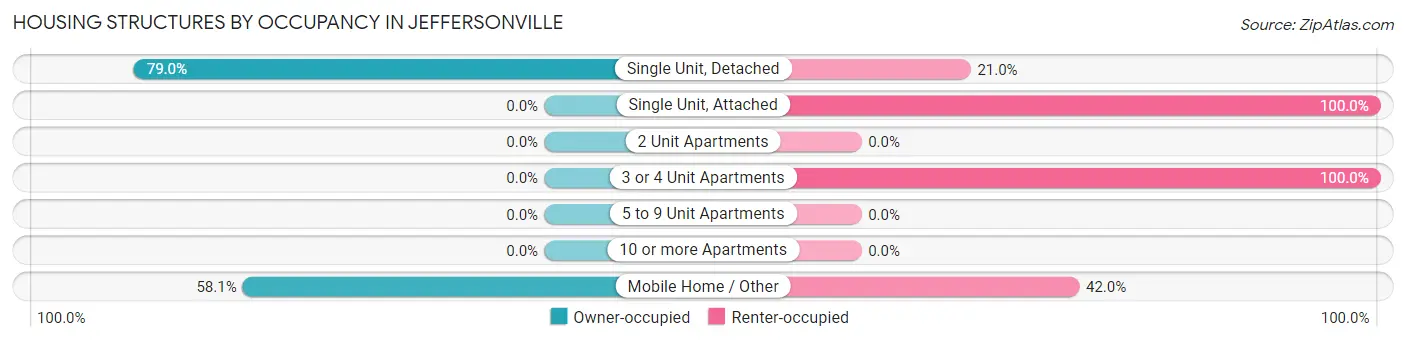
| Structure Type | Owner-occupied | Renter-occupied |
| Single Unit, Detached | 319 (79.0%) | 85 (21.0%) |
| Single Unit, Attached | 0 (0.0%) | 9 (100.0%) |
| 2 Unit Apartments | 0 (0.0%) | 0 (0.0%) |
| 3 or 4 Unit Apartments | 0 (0.0%) | 10 (100.0%) |
| 5 to 9 Unit Apartments | 0 (0.0%) | 0 (0.0%) |
| 10 or more Apartments | 0 (0.0%) | 0 (0.0%) |
| Mobile Home / Other | 119 (58.1%) | 86 (41.9%) |
| Total | 438 (69.8%) | 190 (30.2%) |
Housing Structures by Number of Rooms in Jeffersonville
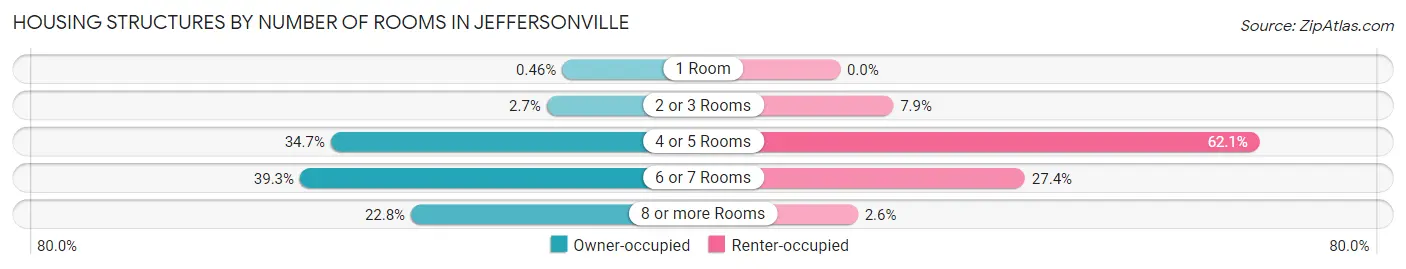
| Number of Rooms | Owner-occupied | Renter-occupied |
| 1 Room | 2 (0.5%) | 0 (0.0%) |
| 2 or 3 Rooms | 12 (2.7%) | 15 (7.9%) |
| 4 or 5 Rooms | 152 (34.7%) | 118 (62.1%) |
| 6 or 7 Rooms | 172 (39.3%) | 52 (27.4%) |
| 8 or more Rooms | 100 (22.8%) | 5 (2.6%) |
| Total | 438 (100.0%) | 190 (100.0%) |
Housing Structure by Heating Type in Jeffersonville
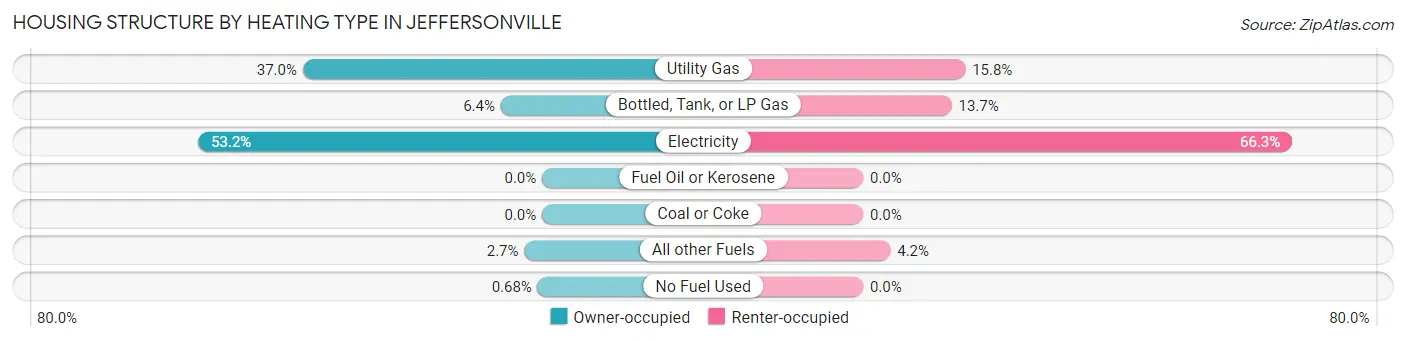
| Heating Type | Owner-occupied | Renter-occupied |
| Utility Gas | 162 (37.0%) | 30 (15.8%) |
| Bottled, Tank, or LP Gas | 28 (6.4%) | 26 (13.7%) |
| Electricity | 233 (53.2%) | 126 (66.3%) |
| Fuel Oil or Kerosene | 0 (0.0%) | 0 (0.0%) |
| Coal or Coke | 0 (0.0%) | 0 (0.0%) |
| All other Fuels | 12 (2.7%) | 8 (4.2%) |
| No Fuel Used | 3 (0.7%) | 0 (0.0%) |
| Total | 438 (100.0%) | 190 (100.0%) |
Household Vehicle Usage in Jeffersonville
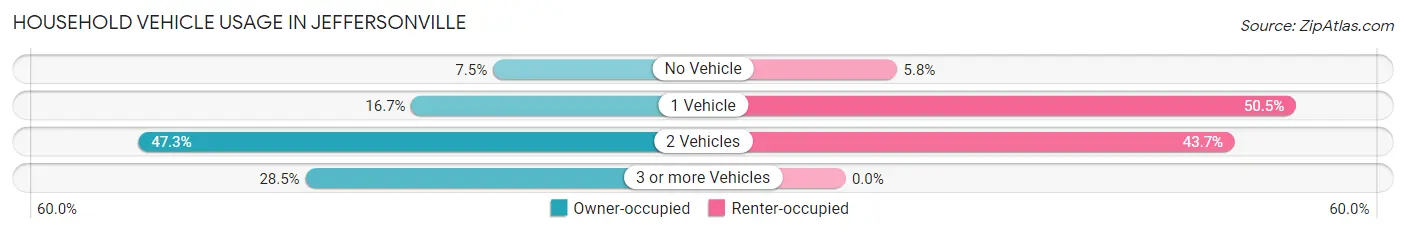
| Vehicles per Household | Owner-occupied | Renter-occupied |
| No Vehicle | 33 (7.5%) | 11 (5.8%) |
| 1 Vehicle | 73 (16.7%) | 96 (50.5%) |
| 2 Vehicles | 207 (47.3%) | 83 (43.7%) |
| 3 or more Vehicles | 125 (28.5%) | 0 (0.0%) |
| Total | 438 (100.0%) | 190 (100.0%) |
Real Estate & Mortgages in Jeffersonville
Real Estate and Mortgage Overview in Jeffersonville
| Characteristic | Without Mortgage | With Mortgage |
| Housing Units | 202 | 236 |
| Median Property Value | $90,500 | $129,100 |
| Median Household Income | $49,688 | $24 |
| Monthly Housing Costs | $367 | $0 |
| Real Estate Taxes | $525 | $3 |
Property Value by Mortgage Status in Jeffersonville
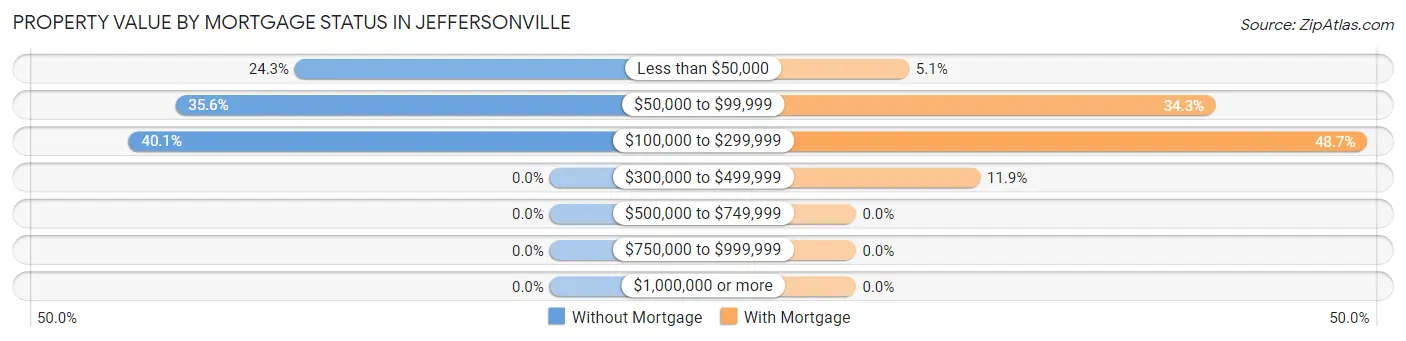
| Property Value | Without Mortgage | With Mortgage |
| Less than $50,000 | 49 (24.3%) | 12 (5.1%) |
| $50,000 to $99,999 | 72 (35.6%) | 81 (34.3%) |
| $100,000 to $299,999 | 81 (40.1%) | 115 (48.7%) |
| $300,000 to $499,999 | 0 (0.0%) | 28 (11.9%) |
| $500,000 to $749,999 | 0 (0.0%) | 0 (0.0%) |
| $750,000 to $999,999 | 0 (0.0%) | 0 (0.0%) |
| $1,000,000 or more | 0 (0.0%) | 0 (0.0%) |
| Total | 202 (100.0%) | 236 (100.0%) |
Household Income by Mortgage Status in Jeffersonville
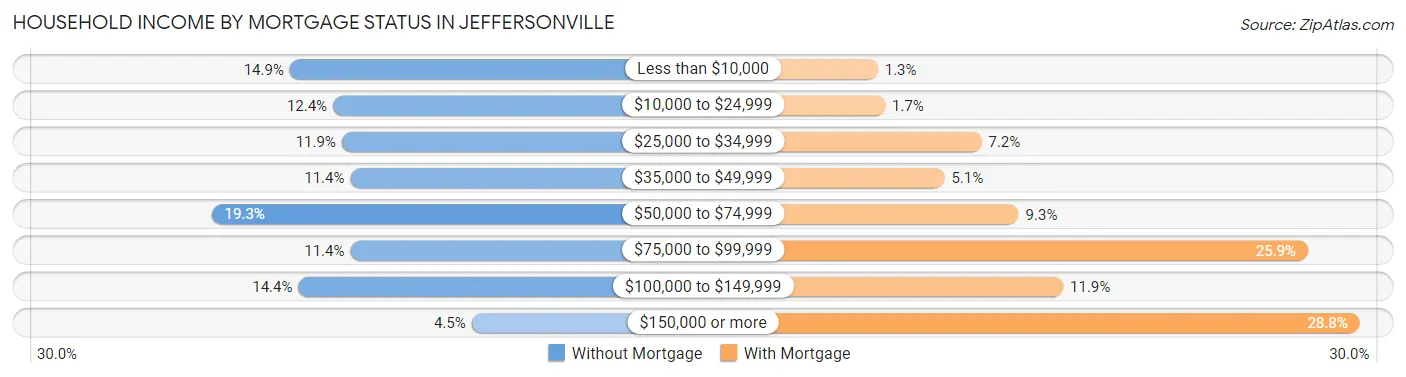
| Household Income | Without Mortgage | With Mortgage |
| Less than $10,000 | 30 (14.8%) | 3 (1.3%) |
| $10,000 to $24,999 | 25 (12.4%) | 4 (1.7%) |
| $25,000 to $34,999 | 24 (11.9%) | 17 (7.2%) |
| $35,000 to $49,999 | 23 (11.4%) | 12 (5.1%) |
| $50,000 to $74,999 | 39 (19.3%) | 22 (9.3%) |
| $75,000 to $99,999 | 23 (11.4%) | 61 (25.9%) |
| $100,000 to $149,999 | 29 (14.4%) | 28 (11.9%) |
| $150,000 or more | 9 (4.5%) | 68 (28.8%) |
| Total | 202 (100.0%) | 236 (100.0%) |
Property Value to Household Income Ratio in Jeffersonville
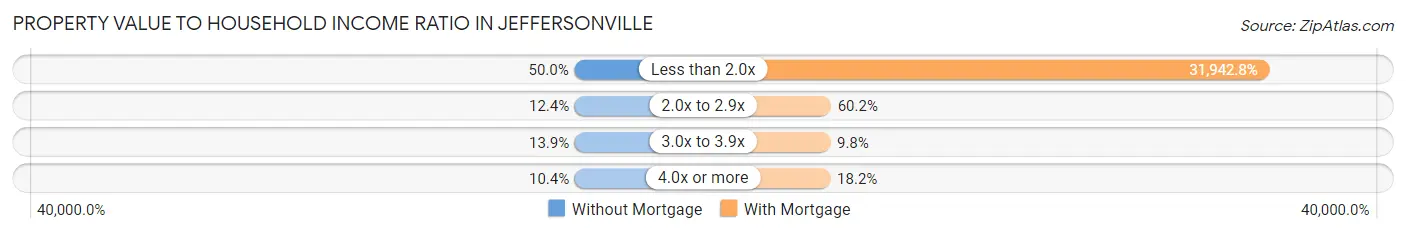
| Value-to-Income Ratio | Without Mortgage | With Mortgage |
| Less than 2.0x | 101 (50.0%) | 75,385 (31,942.8%) |
| 2.0x to 2.9x | 25 (12.4%) | 142 (60.2%) |
| 3.0x to 3.9x | 28 (13.9%) | 23 (9.8%) |
| 4.0x or more | 21 (10.4%) | 43 (18.2%) |
| Total | 202 (100.0%) | 236 (100.0%) |
Real Estate Taxes by Mortgage Status in Jeffersonville
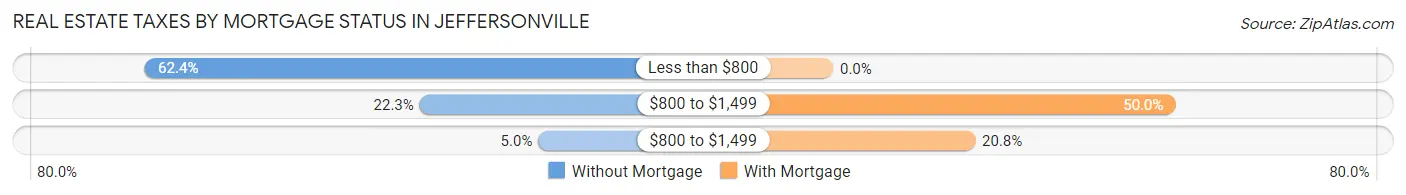
| Property Taxes | Without Mortgage | With Mortgage |
| Less than $800 | 126 (62.4%) | 0 (0.0%) |
| $800 to $1,499 | 45 (22.3%) | 118 (50.0%) |
| $800 to $1,499 | 10 (5.0%) | 49 (20.8%) |
| Total | 202 (100.0%) | 236 (100.0%) |
Health & Disability in Jeffersonville
Health Insurance Coverage by Age in Jeffersonville
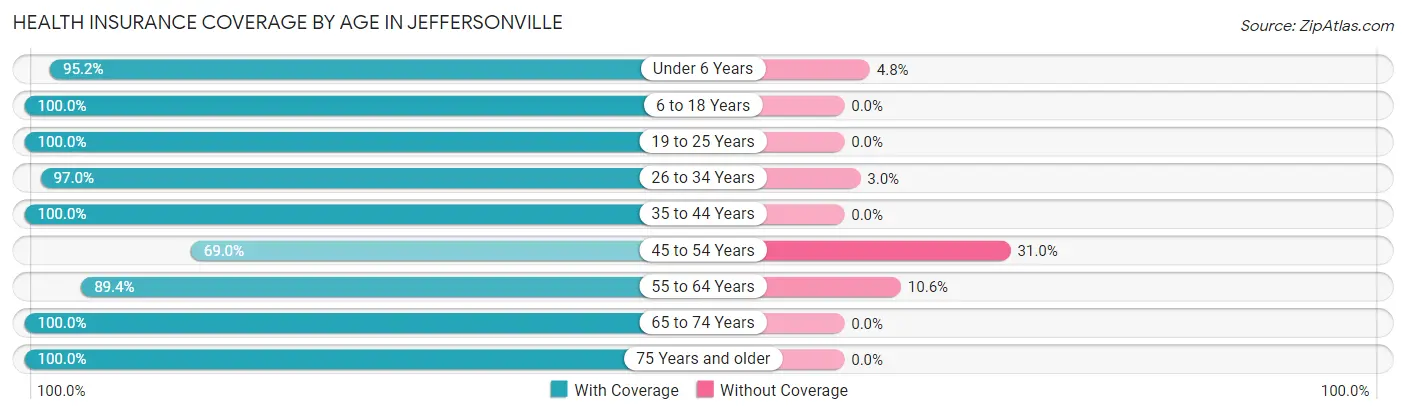
| Age Bracket | With Coverage | Without Coverage |
| Under 6 Years | 60 (95.2%) | 3 (4.8%) |
| 6 to 18 Years | 419 (100.0%) | 0 (0.0%) |
| 19 to 25 Years | 119 (100.0%) | 0 (0.0%) |
| 26 to 34 Years | 291 (97.0%) | 9 (3.0%) |
| 35 to 44 Years | 234 (100.0%) | 0 (0.0%) |
| 45 to 54 Years | 218 (69.0%) | 98 (31.0%) |
| 55 to 64 Years | 127 (89.4%) | 15 (10.6%) |
| 65 to 74 Years | 161 (100.0%) | 0 (0.0%) |
| 75 Years and older | 79 (100.0%) | 0 (0.0%) |
| Total | 1,708 (93.2%) | 125 (6.8%) |
Health Insurance Coverage by Citizenship Status in Jeffersonville
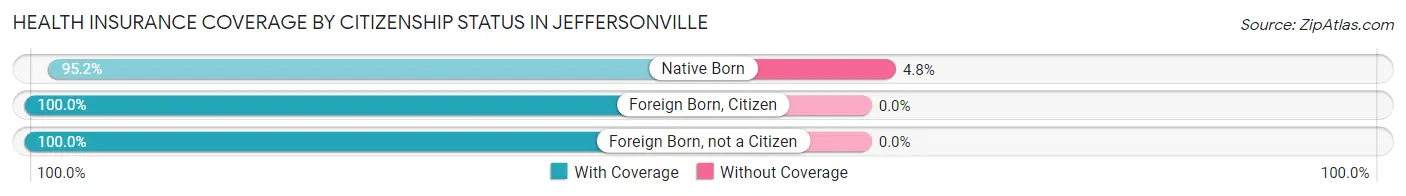
| Citizenship Status | With Coverage | Without Coverage |
| Native Born | 60 (95.2%) | 3 (4.8%) |
| Foreign Born, Citizen | 419 (100.0%) | 0 (0.0%) |
| Foreign Born, not a Citizen | 119 (100.0%) | 0 (0.0%) |
Health Insurance Coverage by Household Income in Jeffersonville
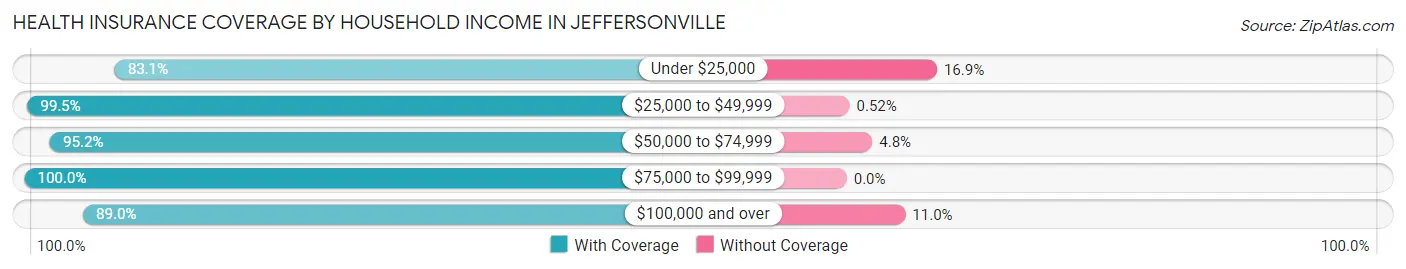
| Household Income | With Coverage | Without Coverage |
| Under $25,000 | 241 (83.1%) | 49 (16.9%) |
| $25,000 to $49,999 | 381 (99.5%) | 2 (0.5%) |
| $50,000 to $74,999 | 378 (95.2%) | 19 (4.8%) |
| $75,000 to $99,999 | 262 (100.0%) | 0 (0.0%) |
| $100,000 and over | 446 (89.0%) | 55 (11.0%) |
Public vs Private Health Insurance Coverage by Age in Jeffersonville
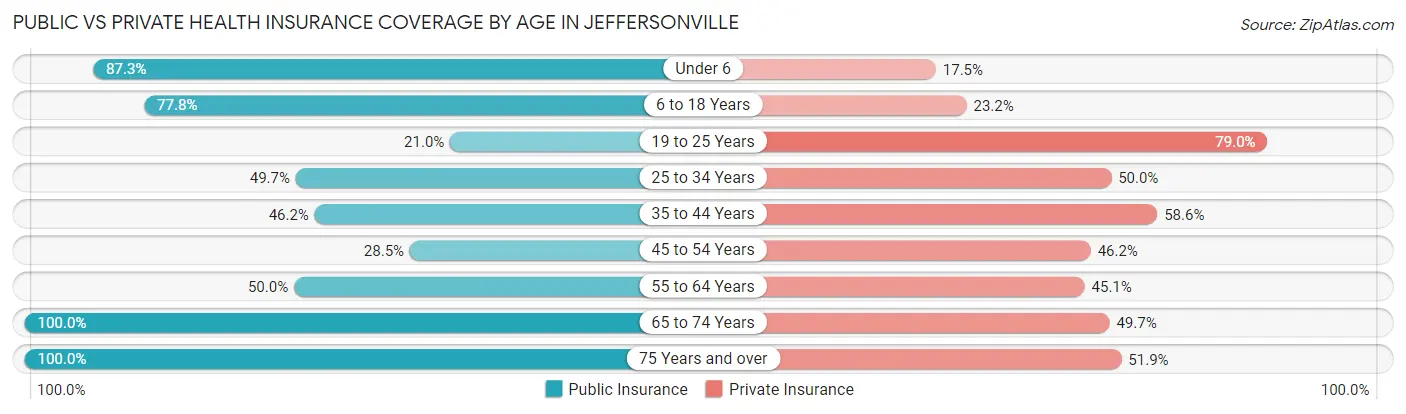
| Age Bracket | Public Insurance | Private Insurance |
| Under 6 | 55 (87.3%) | 11 (17.5%) |
| 6 to 18 Years | 326 (77.8%) | 97 (23.2%) |
| 19 to 25 Years | 25 (21.0%) | 94 (79.0%) |
| 25 to 34 Years | 149 (49.7%) | 150 (50.0%) |
| 35 to 44 Years | 108 (46.2%) | 137 (58.6%) |
| 45 to 54 Years | 90 (28.5%) | 146 (46.2%) |
| 55 to 64 Years | 71 (50.0%) | 64 (45.1%) |
| 65 to 74 Years | 161 (100.0%) | 80 (49.7%) |
| 75 Years and over | 79 (100.0%) | 41 (51.9%) |
| Total | 1,064 (58.1%) | 820 (44.7%) |
Disability Status by Sex by Age in Jeffersonville
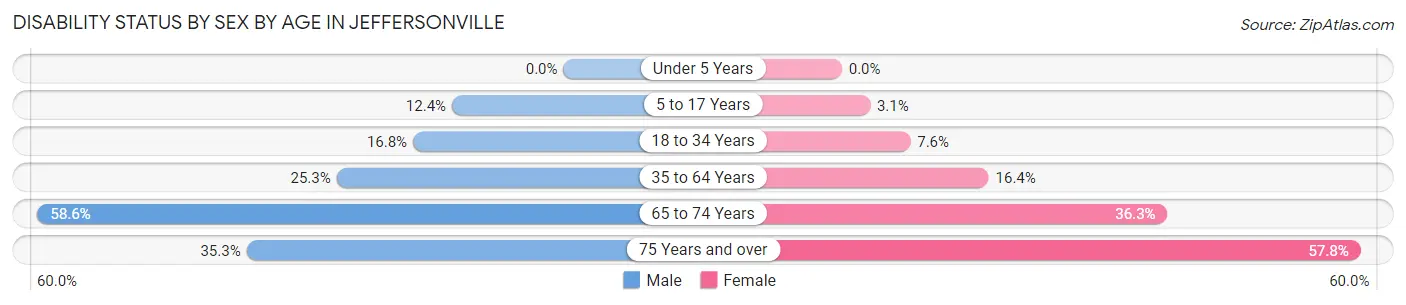
| Age Bracket | Male | Female |
| Under 5 Years | 0 (0.0%) | 0 (0.0%) |
| 5 to 17 Years | 34 (12.4%) | 5 (3.1%) |
| 18 to 34 Years | 32 (16.8%) | 18 (7.6%) |
| 35 to 64 Years | 96 (25.3%) | 51 (16.4%) |
| 65 to 74 Years | 41 (58.6%) | 33 (36.3%) |
| 75 Years and over | 12 (35.3%) | 26 (57.8%) |
Disability Class by Sex by Age in Jeffersonville
Disability Class: Hearing Difficulty
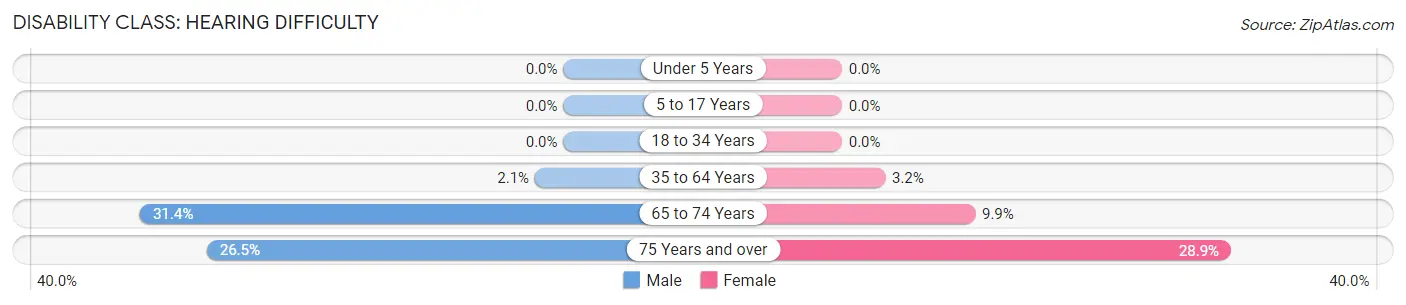
| Age Bracket | Male | Female |
| Under 5 Years | 0 (0.0%) | 0 (0.0%) |
| 5 to 17 Years | 0 (0.0%) | 0 (0.0%) |
| 18 to 34 Years | 0 (0.0%) | 0 (0.0%) |
| 35 to 64 Years | 8 (2.1%) | 10 (3.2%) |
| 65 to 74 Years | 22 (31.4%) | 9 (9.9%) |
| 75 Years and over | 9 (26.5%) | 13 (28.9%) |
Disability Class: Vision Difficulty
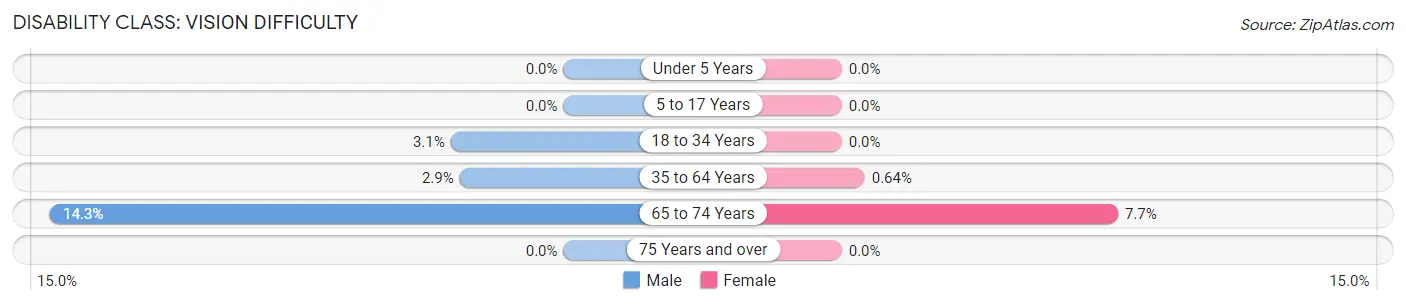
| Age Bracket | Male | Female |
| Under 5 Years | 0 (0.0%) | 0 (0.0%) |
| 5 to 17 Years | 0 (0.0%) | 0 (0.0%) |
| 18 to 34 Years | 6 (3.1%) | 0 (0.0%) |
| 35 to 64 Years | 11 (2.9%) | 2 (0.6%) |
| 65 to 74 Years | 10 (14.3%) | 7 (7.7%) |
| 75 Years and over | 0 (0.0%) | 0 (0.0%) |
Disability Class: Cognitive Difficulty
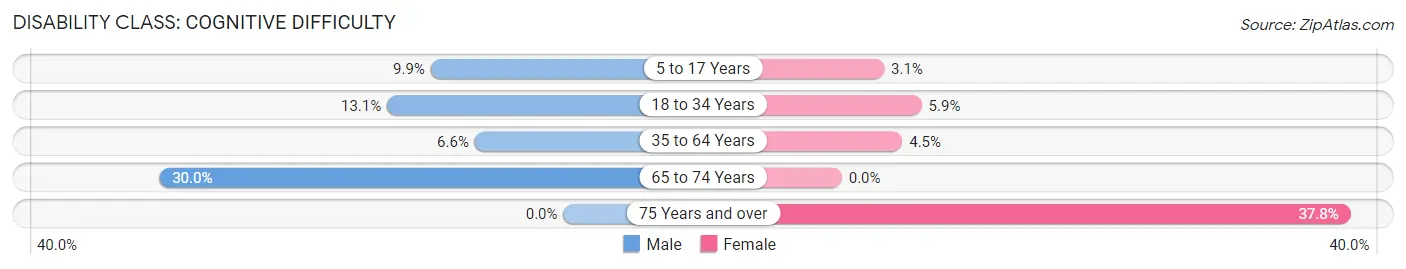
| Age Bracket | Male | Female |
| 5 to 17 Years | 27 (9.9%) | 5 (3.1%) |
| 18 to 34 Years | 25 (13.1%) | 14 (5.9%) |
| 35 to 64 Years | 25 (6.6%) | 14 (4.5%) |
| 65 to 74 Years | 21 (30.0%) | 0 (0.0%) |
| 75 Years and over | 0 (0.0%) | 17 (37.8%) |
Disability Class: Ambulatory Difficulty
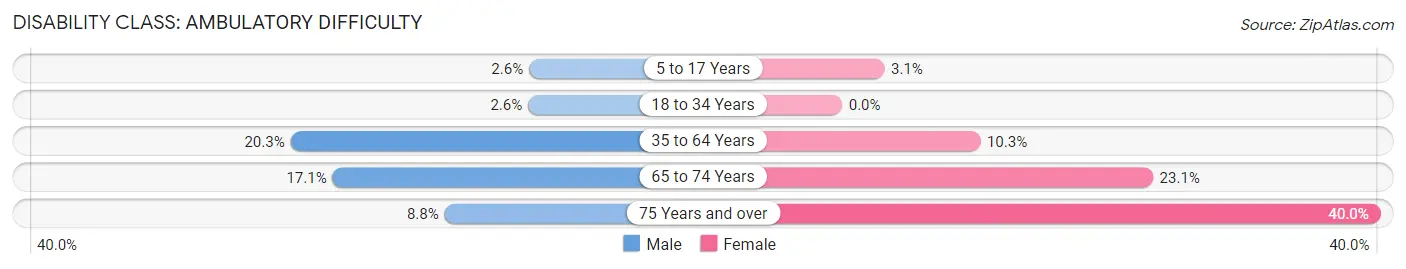
| Age Bracket | Male | Female |
| 5 to 17 Years | 7 (2.5%) | 5 (3.1%) |
| 18 to 34 Years | 5 (2.6%) | 0 (0.0%) |
| 35 to 64 Years | 77 (20.3%) | 32 (10.3%) |
| 65 to 74 Years | 12 (17.1%) | 21 (23.1%) |
| 75 Years and over | 3 (8.8%) | 18 (40.0%) |
Disability Class: Self-Care Difficulty
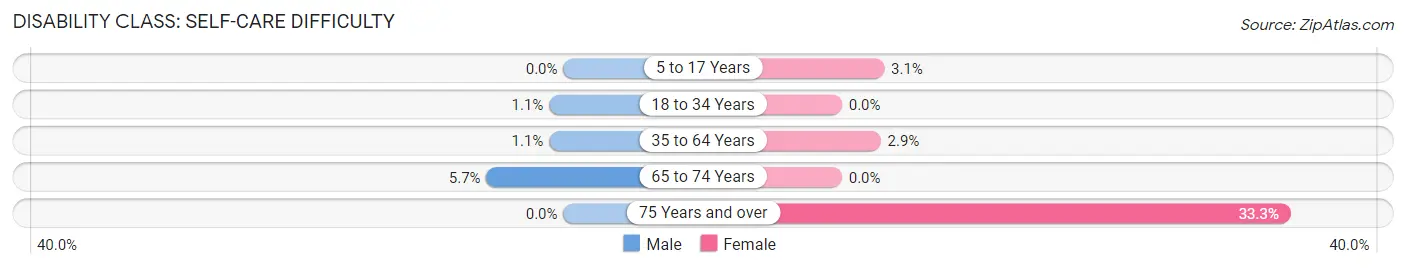
| Age Bracket | Male | Female |
| 5 to 17 Years | 0 (0.0%) | 5 (3.1%) |
| 18 to 34 Years | 2 (1.1%) | 0 (0.0%) |
| 35 to 64 Years | 4 (1.1%) | 9 (2.9%) |
| 65 to 74 Years | 4 (5.7%) | 0 (0.0%) |
| 75 Years and over | 0 (0.0%) | 15 (33.3%) |
Technology Access in Jeffersonville
Computing Device Access in Jeffersonville
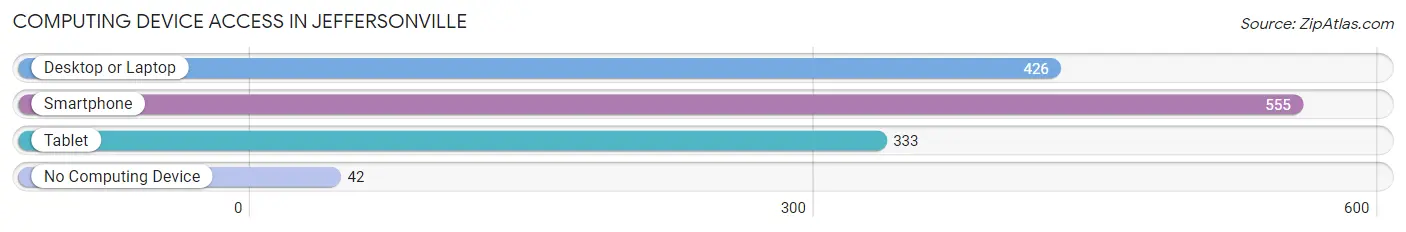
| Device Type | # Households | % Households |
| Desktop or Laptop | 426 | 67.8% |
| Smartphone | 555 | 88.4% |
| Tablet | 333 | 53.0% |
| No Computing Device | 42 | 6.7% |
| Total | 628 | 100.0% |
Internet Access in Jeffersonville
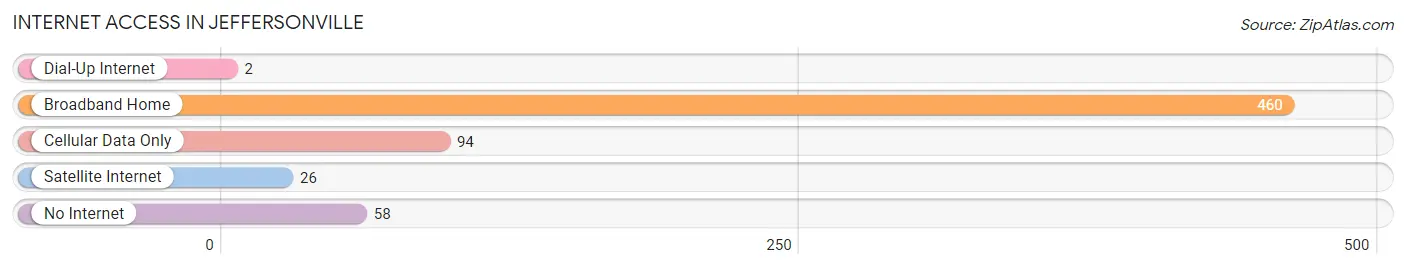
| Internet Type | # Households | % Households |
| Dial-Up Internet | 2 | 0.3% |
| Broadband Home | 460 | 73.3% |
| Cellular Data Only | 94 | 15.0% |
| Satellite Internet | 26 | 4.1% |
| No Internet | 58 | 9.2% |
| Total | 628 | 100.0% |
Jeffersonville Summary
Jeffersonville, Kentucky is a small city located in the heart of the Bluegrass State. It is situated in the northern part of the state, just south of Louisville, and is part of the Louisville metropolitan area. The city has a population of approximately 8,000 people and is the county seat of Jefferson County.
History
Jeffersonville was founded in 1780 by Colonel William Pope, a Revolutionary War veteran. The city was named after Thomas Jefferson, who was the third President of the United States. The city was incorporated in 1817 and was the first city in the state to be incorporated.
In the early 19th century, Jeffersonville was a major port city on the Ohio River. It was a major stop for steamboats and was a major center for trade and commerce. The city was also a major center for the Underground Railroad, with many slaves escaping to freedom in the city.
In the late 19th century, the city experienced a period of growth and prosperity. The city was home to several factories and businesses, including a cotton mill, a tobacco factory, and a distillery. The city also had a thriving riverboat industry, with many boats traveling up and down the Ohio River.
Geography
Jeffersonville is located in the northern part of the state, just south of Louisville. The city is situated on the banks of the Ohio River and is part of the Louisville metropolitan area. The city has a total area of 4.2 square miles, all of which is land.
The city has a humid subtropical climate, with hot and humid summers and mild winters. The average temperature in the summer is around 80 degrees Fahrenheit, while the average temperature in the winter is around 40 degrees Fahrenheit.
Economy
Jeffersonville’s economy is largely based on manufacturing and services. The city is home to several factories and businesses, including a cotton mill, a tobacco factory, and a distillery. The city also has a thriving riverboat industry, with many boats traveling up and down the Ohio River.
The city is also home to several large employers, including the Jefferson County Public Schools, the University of Louisville, and the Louisville International Airport. The city also has a thriving tourism industry, with many visitors coming to the city to explore its history and attractions.
Demographics
As of the 2010 census, the population of Jeffersonville was 8,039. The city has a population that is predominantly white, with African Americans making up the second largest racial group. The city also has a large Hispanic population, with Hispanics making up nearly 10% of the population.
The median household income in Jeffersonville is $37,845, which is slightly lower than the national average. The city also has a poverty rate of 17.3%, which is higher than the national average.
Conclusion
Jeffersonville, Kentucky is a small city located in the northern part of the state, just south of Louisville. The city has a population of approximately 8,000 people and is the county seat of Jefferson County. The city has a long and rich history, with a thriving riverboat industry and a major stop on the Underground Railroad. The city’s economy is largely based on manufacturing and services, with several large employers located in the city. The city also has a diverse population, with whites, African Americans, and Hispanics making up the majority of the population.
Common Questions
What is Per Capita Income in Jeffersonville?
Per Capita income in Jeffersonville is $22,598.
What is the Median Family Income in Jeffersonville?
Median Family Income in Jeffersonville is $61,500.
What is the Median Household income in Jeffersonville?
Median Household Income in Jeffersonville is $52,031.
What is Income or Wage Gap in Jeffersonville?
Income or Wage Gap in Jeffersonville is 12.4%.
Women in Jeffersonville earn 87.6 cents for every dollar earned by a man.
What is Inequality or Gini Index in Jeffersonville?
Inequality or Gini Index in Jeffersonville is 0.42.
What is the Total Population of Jeffersonville?
Total Population of Jeffersonville is 1,833.
What is the Total Male Population of Jeffersonville?
Total Male Population of Jeffersonville is 968.
What is the Total Female Population of Jeffersonville?
Total Female Population of Jeffersonville is 865.
What is the Ratio of Males per 100 Females in Jeffersonville?
There are 111.91 Males per 100 Females in Jeffersonville.
What is the Ratio of Females per 100 Males in Jeffersonville?
There are 89.36 Females per 100 Males in Jeffersonville.
What is the Median Population Age in Jeffersonville?
Median Population Age in Jeffersonville is 36.0 Years.
What is the Average Family Size in Jeffersonville
Average Family Size in Jeffersonville is 3.1 People.
What is the Average Household Size in Jeffersonville
Average Household Size in Jeffersonville is 2.9 People.
How Large is the Labor Force in Jeffersonville?
There are 867 People in the Labor Forcein in Jeffersonville.
What is the Percentage of People in the Labor Force in Jeffersonville?
61.8% of People are in the Labor Force in Jeffersonville.
What is the Unemployment Rate in Jeffersonville?
Unemployment Rate in Jeffersonville is 8.8%.