Tlingit-Haida vs Thai Householder Income Under 25 years
COMPARE
Tlingit-Haida
Thai
Householder Income Under 25 years
Householder Income Under 25 years Comparison
Tlingit-Haida
Thais
$55,914
HOUSEHOLDER INCOME UNDER 25 YEARS
100.0/ 100
METRIC RATING
35th/ 347
METRIC RANK
$59,187
HOUSEHOLDER INCOME UNDER 25 YEARS
100.0/ 100
METRIC RATING
6th/ 347
METRIC RANK
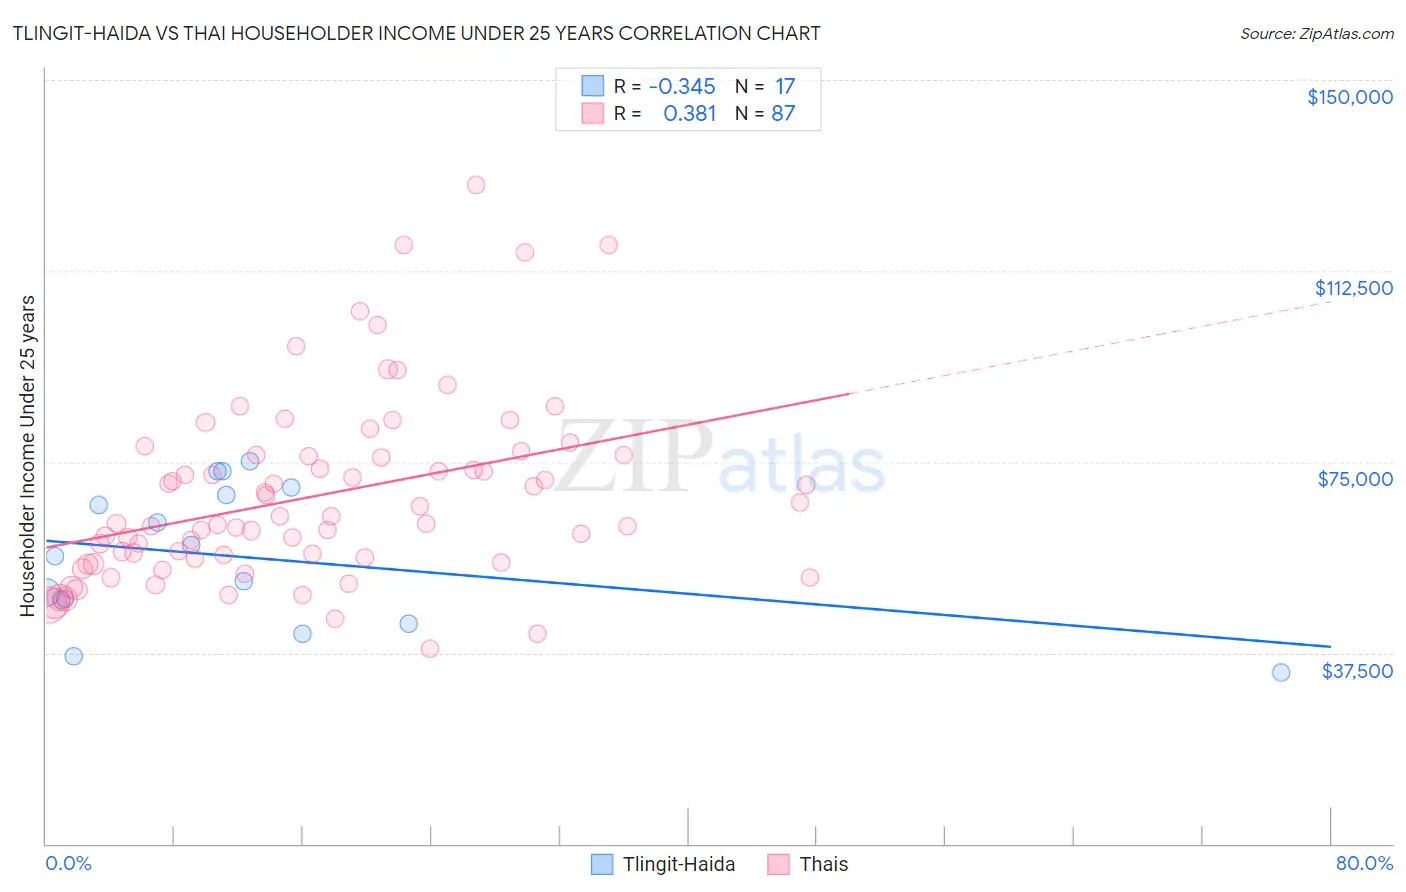
Tlingit-Haida vs Thai Householder Income Under 25 years Correlation Chart
The statistical analysis conducted on geographies consisting of 57,369,671 people shows a mild negative correlation between the proportion of Tlingit-Haida and household income with householder under the age of 25 in the United States with a correlation coefficient (R) of -0.345 and weighted average of $55,914. Similarly, the statistical analysis conducted on geographies consisting of 390,520,827 people shows a mild positive correlation between the proportion of Thais and household income with householder under the age of 25 in the United States with a correlation coefficient (R) of 0.381 and weighted average of $59,187, a difference of 5.9%.
Householder Income Under 25 years Correlation Summary
| Measurement | Tlingit-Haida | Thai |
| Minimum | $33,750 | $38,359 |
| Maximum | $75,104 | $129,301 |
| Range | $41,354 | $90,942 |
| Mean | $56,260 | $68,286 |
| Median | $56,462 | $62,959 |
| Interquartile 25% (IQ1) | $45,554 | $56,029 |
| Interquartile 75% (IQ3) | $69,196 | $76,245 |
| Interquartile Range (IQR) | $23,642 | $20,216 |
| Standard Deviation (Sample) | $13,469 | $17,960 |
| Standard Deviation (Population) | $13,067 | $17,857 |
Similar Demographics by Householder Income Under 25 years
Demographics Similar to Tlingit-Haida by Householder Income Under 25 years
In terms of householder income under 25 years, the demographic groups most similar to Tlingit-Haida are Immigrants from Israel ($55,913, a difference of 0.0%), Immigrants from Japan ($55,932, a difference of 0.030%), Inupiat ($55,935, a difference of 0.040%), Immigrants from Russia ($55,891, a difference of 0.040%), and Immigrants from Iran ($55,880, a difference of 0.060%).
| Demographics | Rating | Rank | Householder Income Under 25 years |
| Immigrants | Peru | 100.0 /100 | #28 | Exceptional $56,384 |
| Immigrants | Asia | 100.0 /100 | #29 | Exceptional $56,379 |
| Immigrants | Moldova | 100.0 /100 | #30 | Exceptional $56,168 |
| Vietnamese | 100.0 /100 | #31 | Exceptional $56,127 |
| Peruvians | 100.0 /100 | #32 | Exceptional $56,052 |
| Inupiat | 100.0 /100 | #33 | Exceptional $55,935 |
| Immigrants | Japan | 100.0 /100 | #34 | Exceptional $55,932 |
| Tlingit-Haida | 100.0 /100 | #35 | Exceptional $55,914 |
| Immigrants | Israel | 100.0 /100 | #36 | Exceptional $55,913 |
| Immigrants | Russia | 100.0 /100 | #37 | Exceptional $55,891 |
| Immigrants | Iran | 100.0 /100 | #38 | Exceptional $55,880 |
| Immigrants | Belarus | 100.0 /100 | #39 | Exceptional $55,743 |
| Immigrants | Greece | 100.0 /100 | #40 | Exceptional $55,727 |
| Immigrants | Guyana | 100.0 /100 | #41 | Exceptional $55,726 |
| Immigrants | Korea | 100.0 /100 | #42 | Exceptional $55,716 |
Demographics Similar to Thais by Householder Income Under 25 years
In terms of householder income under 25 years, the demographic groups most similar to Thais are Immigrants from Bolivia ($59,389, a difference of 0.34%), Immigrants from Taiwan ($59,424, a difference of 0.40%), Bolivian ($58,506, a difference of 1.2%), Immigrants from India ($59,914, a difference of 1.2%), and Indian (Asian) ($58,239, a difference of 1.6%).
| Demographics | Rating | Rank | Householder Income Under 25 years |
| Assyrians/Chaldeans/Syriacs | 100.0 /100 | #1 | Exceptional $65,329 |
| Immigrants | Hong Kong | 100.0 /100 | #2 | Exceptional $62,083 |
| Immigrants | India | 100.0 /100 | #3 | Exceptional $59,914 |
| Immigrants | Taiwan | 100.0 /100 | #4 | Exceptional $59,424 |
| Immigrants | Bolivia | 100.0 /100 | #5 | Exceptional $59,389 |
| Thais | 100.0 /100 | #6 | Exceptional $59,187 |
| Bolivians | 100.0 /100 | #7 | Exceptional $58,506 |
| Indians (Asian) | 100.0 /100 | #8 | Exceptional $58,239 |
| Chinese | 100.0 /100 | #9 | Exceptional $58,162 |
| Afghans | 100.0 /100 | #10 | Exceptional $58,019 |
| Immigrants | China | 100.0 /100 | #11 | Exceptional $57,931 |
| Immigrants | Philippines | 100.0 /100 | #12 | Exceptional $57,930 |
| Immigrants | South Central Asia | 100.0 /100 | #13 | Exceptional $57,818 |
| Filipinos | 100.0 /100 | #14 | Exceptional $57,740 |
| Koreans | 100.0 /100 | #15 | Exceptional $57,730 |