Tlingit-Haida vs Immigrants from Asia Householder Income Under 25 years
COMPARE
Tlingit-Haida
Immigrants from Asia
Householder Income Under 25 years
Householder Income Under 25 years Comparison
Tlingit-Haida
Immigrants from Asia
$55,914
HOUSEHOLDER INCOME UNDER 25 YEARS
100.0/ 100
METRIC RATING
35th/ 347
METRIC RANK
$56,379
HOUSEHOLDER INCOME UNDER 25 YEARS
100.0/ 100
METRIC RATING
29th/ 347
METRIC RANK
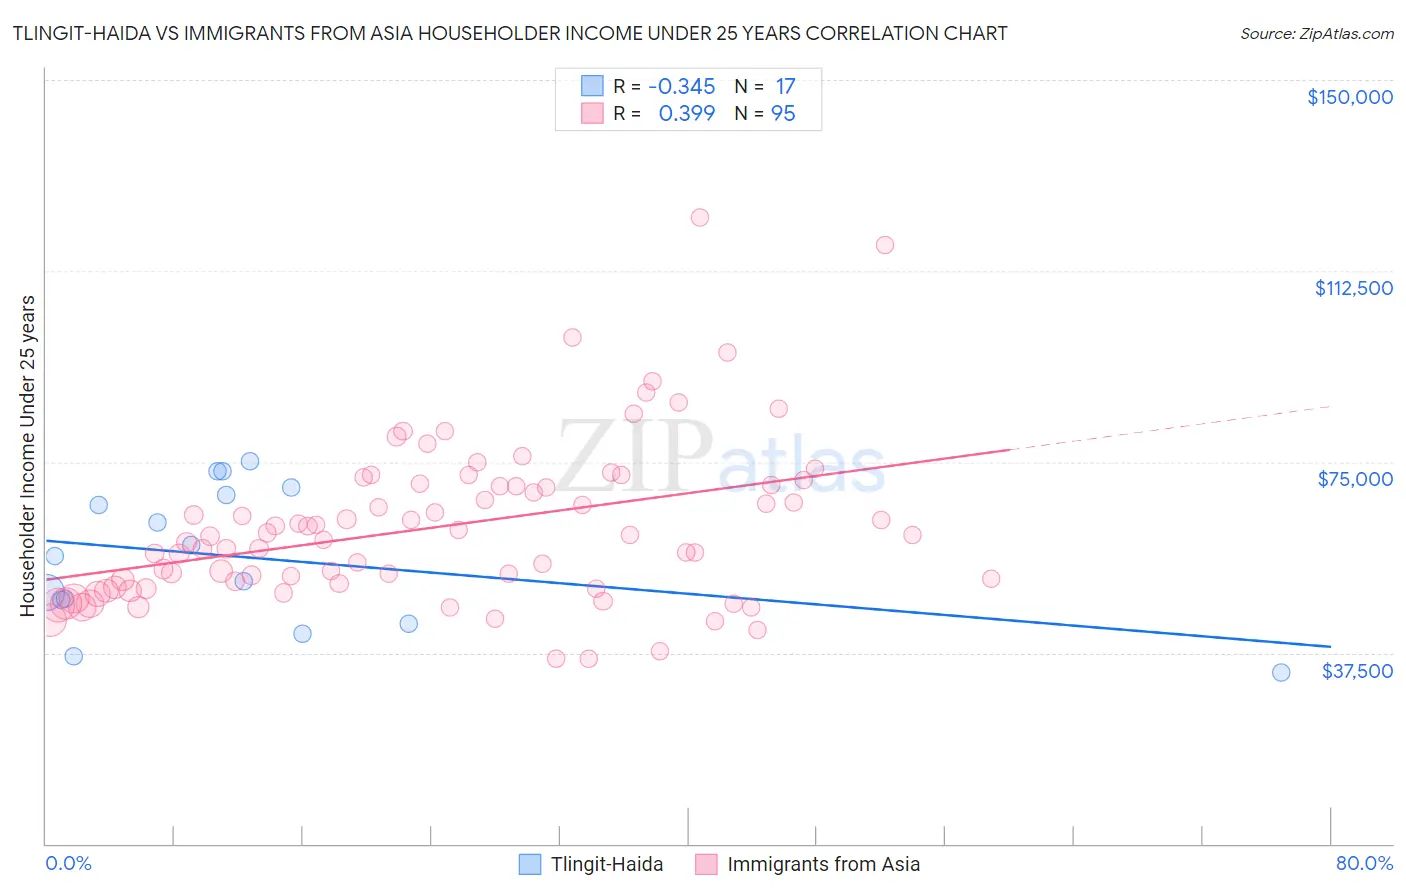
Tlingit-Haida vs Immigrants from Asia Householder Income Under 25 years Correlation Chart
The statistical analysis conducted on geographies consisting of 57,369,671 people shows a mild negative correlation between the proportion of Tlingit-Haida and household income with householder under the age of 25 in the United States with a correlation coefficient (R) of -0.345 and weighted average of $55,914. Similarly, the statistical analysis conducted on geographies consisting of 431,606,279 people shows a mild positive correlation between the proportion of Immigrants from Asia and household income with householder under the age of 25 in the United States with a correlation coefficient (R) of 0.399 and weighted average of $56,379, a difference of 0.83%.
Householder Income Under 25 years Correlation Summary
| Measurement | Tlingit-Haida | Immigrants from Asia |
| Minimum | $33,750 | $36,244 |
| Maximum | $75,104 | $123,022 |
| Range | $41,354 | $86,778 |
| Mean | $56,260 | $62,236 |
| Median | $56,462 | $60,309 |
| Interquartile 25% (IQ1) | $45,554 | $50,431 |
| Interquartile 75% (IQ3) | $69,196 | $70,461 |
| Interquartile Range (IQR) | $23,642 | $20,030 |
| Standard Deviation (Sample) | $13,469 | $15,817 |
| Standard Deviation (Population) | $13,067 | $15,733 |
Demographics Similar to Tlingit-Haida and Immigrants from Asia by Householder Income Under 25 years
In terms of householder income under 25 years, the demographic groups most similar to Tlingit-Haida are Immigrants from Israel ($55,913, a difference of 0.0%), Immigrants from Japan ($55,932, a difference of 0.030%), Inupiat ($55,935, a difference of 0.040%), Immigrants from Russia ($55,891, a difference of 0.040%), and Immigrants from Iran ($55,880, a difference of 0.060%). Similarly, the demographic groups most similar to Immigrants from Asia are Immigrants from Peru ($56,384, a difference of 0.010%), Immigrants from North Macedonia ($56,503, a difference of 0.22%), Immigrants from Moldova ($56,168, a difference of 0.37%), Vietnamese ($56,127, a difference of 0.45%), and Immigrants from Australia ($56,660, a difference of 0.50%).
| Demographics | Rating | Rank | Householder Income Under 25 years |
| Asians | 100.0 /100 | #22 | Exceptional $57,003 |
| Tongans | 100.0 /100 | #23 | Exceptional $56,972 |
| Immigrants | Singapore | 100.0 /100 | #24 | Exceptional $56,835 |
| Immigrants | Pakistan | 100.0 /100 | #25 | Exceptional $56,789 |
| Immigrants | Australia | 100.0 /100 | #26 | Exceptional $56,660 |
| Immigrants | North Macedonia | 100.0 /100 | #27 | Exceptional $56,503 |
| Immigrants | Peru | 100.0 /100 | #28 | Exceptional $56,384 |
| Immigrants | Asia | 100.0 /100 | #29 | Exceptional $56,379 |
| Immigrants | Moldova | 100.0 /100 | #30 | Exceptional $56,168 |
| Vietnamese | 100.0 /100 | #31 | Exceptional $56,127 |
| Peruvians | 100.0 /100 | #32 | Exceptional $56,052 |
| Inupiat | 100.0 /100 | #33 | Exceptional $55,935 |
| Immigrants | Japan | 100.0 /100 | #34 | Exceptional $55,932 |
| Tlingit-Haida | 100.0 /100 | #35 | Exceptional $55,914 |
| Immigrants | Israel | 100.0 /100 | #36 | Exceptional $55,913 |
| Immigrants | Russia | 100.0 /100 | #37 | Exceptional $55,891 |
| Immigrants | Iran | 100.0 /100 | #38 | Exceptional $55,880 |
| Immigrants | Belarus | 100.0 /100 | #39 | Exceptional $55,743 |
| Immigrants | Greece | 100.0 /100 | #40 | Exceptional $55,727 |
| Immigrants | Guyana | 100.0 /100 | #41 | Exceptional $55,726 |
| Immigrants | Korea | 100.0 /100 | #42 | Exceptional $55,716 |