Tlingit-Haida vs Immigrants from Ireland Householder Income Under 25 years

COMPARE

Tlingit-Haida
Race
Ancestry
AfghanAfricanAlaska NativeAlaskan AthabascanAlbanianAleutAlsatianAmericanApacheArabArapahoArgentineanArmenianAssyrian/Chaldean/SyriacAustralianAustrianBahamianBangladeshiBarbadianBasqueBelgianBelizeanBermudanBhutaneseBlackfeetBolivianBrazilianBritishBritish West IndianBulgarianBurmeseCajunCambodianCanadianCape VerdeanCarpatho RusynCelticCentral AmericanCentral American IndianCherokeeCheyenneChickasawChileanChineseChippewaChoctawColombianColvilleComancheCosta RicanCreeCreekCroatianCrowCubanCypriotCzechCzechoslovakianDanishDelawareDominicanDutchDutch West IndianEastern EuropeanEcuadorianEgyptianEnglishEstonianEthiopianEuropeanFijianFilipinoFinnishFrenchFrench American IndianFrench CanadianGermanGerman RussianGhanaianGreekGuamanian/ChamorroGuatemalanGuyaneseHaitianHmongHonduranHopiHoumaHungarianIcelanderIndian (Asian)IndonesianInupiatIranianIraqiIrishIroquoisIsraeliItalianJamaicanJapaneseJordanianKenyanKiowaKoreanLaotianLatvianLebaneseLiberianLithuanianLumbeeLuxembourgerMacedonianMalaysianMalteseMarshalleseMenomineeMexicanMexican American IndianMongolianMoroccanNative HawaiianNavajoNepaleseNew ZealanderNicaraguanNigerianNorthern EuropeanNorwegianOkinawanOsageOttawaPaiutePakistaniPalestinianPanamanianParaguayanPennsylvania GermanPeruvianPimaPolishPortuguesePotawatomiPuebloPuerto RicanPuget Sound SalishRomanianRussianSalvadoranSamoanScandinavianScotch-IrishScottishSeminoleSenegaleseSerbianShoshoneSierra LeoneanSiouxSlavicSlovakSloveneSomaliSouth AfricanSouth AmericanSouth American IndianSoviet UnionSpaniardSpanishSpanish AmericanSpanish American IndianSri LankanSubsaharan AfricanSudaneseSwedishSwissSyrianTaiwaneseThaiTlingit-HaidaTohono O'OdhamTonganTrinidadian and TobagonianTsimshianTurkishU.S. Virgin IslanderUgandanUkrainianUruguayanUteVenezuelanVietnameseWelshWest IndianYakamaYaquiYugoslavianYumanYup'ikZimbabwean
Immigration
NonimmigrantsImmigrantsAfghanistanAfricaAlbaniaArgentinaArmeniaAsiaAustraliaAustriaBahamasBangladeshBarbadosBelarusBelgiumBelizeBoliviaBosnia and HerzegovinaBrazilBulgariaBurma/MyanmarCabo VerdeCambodiaCameroonCanadaCaribbeanCentral AmericaChileChinaColombiaCongoCosta RicaCroatiaCubaCzechoslovakiaDenmarkDominicaDominican RepublicEastern AfricaEastern AsiaEastern EuropeEcuadorEgyptEl SalvadorEnglandEritreaEthiopiaEuropeFijiFranceGermanyGhanaGreeceGrenadaGuatemalaGuyanaHaitiHondurasHong KongHungaryIndiaIndonesiaIranIraqIsraelItalyJamaicaJapanJordanKazakhstanKenyaKoreaKuwaitLaosLatin AmericaLatviaLebanonLiberiaLithuaniaMalaysiaMexicoMicronesiaMiddle AfricaMoldovaMoroccoNepalNetherlandsNicaraguaNigeriaNorth AmericaNorth MacedoniaNorthern AfricaNorthern EuropeNorwayOceaniaPakistanPanamaPeruPhilippinesPolandPortugalRomaniaRussiaSaudi ArabiaScotlandSenegalSerbiaSierra LeoneSingaporeSomaliaSouth AfricaSouth AmericaSouth Central AsiaSouth Eastern AsiaSouthern EuropeSpainSri LankaSt. Vincent and the GrenadinesSudanSwedenSwitzerlandSyriaTaiwanThailandTrinidad and TobagoTurkeyUgandaUkraineUruguayUzbekistanVenezuelaVietnamWest IndiesWestern AfricaWestern AsiaWestern EuropeYemenZaireZimbabweAzores
Immigrants from Ireland
Race
Ancestry
AfghanAfricanAlaska NativeAlaskan AthabascanAlbanianAleutAlsatianAmericanApacheArabArapahoArgentineanArmenianAssyrian/Chaldean/SyriacAustralianAustrianBahamianBangladeshiBarbadianBasqueBelgianBelizeanBermudanBhutaneseBlackfeetBolivianBrazilianBritishBritish West IndianBulgarianBurmeseCajunCambodianCanadianCape VerdeanCarpatho RusynCelticCentral AmericanCentral American IndianCherokeeCheyenneChickasawChileanChineseChippewaChoctawColombianColvilleComancheCosta RicanCreeCreekCroatianCrowCubanCypriotCzechCzechoslovakianDanishDelawareDominicanDutchDutch West IndianEastern EuropeanEcuadorianEgyptianEnglishEstonianEthiopianEuropeanFijianFilipinoFinnishFrenchFrench American IndianFrench CanadianGermanGerman RussianGhanaianGreekGuamanian/ChamorroGuatemalanGuyaneseHaitianHmongHonduranHopiHoumaHungarianIcelanderIndian (Asian)IndonesianInupiatIranianIraqiIrishIroquoisIsraeliItalianJamaicanJapaneseJordanianKenyanKiowaKoreanLaotianLatvianLebaneseLiberianLithuanianLumbeeLuxembourgerMacedonianMalaysianMalteseMarshalleseMenomineeMexicanMexican American IndianMongolianMoroccanNative HawaiianNavajoNepaleseNew ZealanderNicaraguanNigerianNorthern EuropeanNorwegianOkinawanOsageOttawaPaiutePakistaniPalestinianPanamanianParaguayanPennsylvania GermanPeruvianPimaPolishPortuguesePotawatomiPuebloPuerto RicanPuget Sound SalishRomanianRussianSalvadoranSamoanScandinavianScotch-IrishScottishSeminoleSenegaleseSerbianShoshoneSierra LeoneanSiouxSlavicSlovakSloveneSomaliSouth AfricanSouth AmericanSouth American IndianSoviet UnionSpaniardSpanishSpanish AmericanSpanish American IndianSri LankanSubsaharan AfricanSudaneseSwedishSwissSyrianTaiwaneseThaiTohono O'OdhamTonganTrinidadian and TobagonianTsimshianTurkishU.S. Virgin IslanderUgandanUkrainianUruguayanUteVenezuelanVietnameseWelshWest IndianYakamaYaquiYugoslavianYumanYup'ikZimbabwean
Immigration
NonimmigrantsImmigrantsAfghanistanAfricaAlbaniaArgentinaArmeniaAsiaAustraliaAustriaBahamasBangladeshBarbadosBelarusBelgiumBelizeBoliviaBosnia and HerzegovinaBrazilBulgariaBurma/MyanmarCabo VerdeCambodiaCameroonCanadaCaribbeanCentral AmericaChileChinaColombiaCongoCosta RicaCroatiaCubaCzechoslovakiaDenmarkDominicaDominican RepublicEastern AfricaEastern AsiaEastern EuropeEcuadorEgyptEl SalvadorEnglandEritreaEthiopiaEuropeFijiFranceGermanyGhanaGreeceGrenadaGuatemalaGuyanaHaitiHondurasHong KongHungaryIndiaIndonesiaIranIraqIrelandIsraelItalyJamaicaJapanJordanKazakhstanKenyaKoreaKuwaitLaosLatin AmericaLatviaLebanonLiberiaLithuaniaMalaysiaMexicoMicronesiaMiddle AfricaMoldovaMoroccoNepalNetherlandsNicaraguaNigeriaNorth AmericaNorth MacedoniaNorthern AfricaNorthern EuropeNorwayOceaniaPakistanPanamaPeruPhilippinesPolandPortugalRomaniaRussiaSaudi ArabiaScotlandSenegalSerbiaSierra LeoneSingaporeSomaliaSouth AfricaSouth AmericaSouth Central AsiaSouth Eastern AsiaSouthern EuropeSpainSri LankaSt. Vincent and the GrenadinesSudanSwedenSwitzerlandSyriaTaiwanThailandTrinidad and TobagoTurkeyUgandaUkraineUruguayUzbekistanVenezuelaVietnamWest IndiesWestern AfricaWestern AsiaWestern EuropeYemenZaireZimbabweAzores
Householder Income Under 25 years
Income
Poverty
Unemployment
Labor Participation
Family Structure
Vehicle Availability
Education Level
Disability

Householder Income Under 25 years Comparison

Tlingit-Haida

Immigrants from Ireland

Exceptional
Exceptional
$55,914
HOUSEHOLDER INCOME UNDER 25 YEARS
100.0/ 100
METRIC RATING
35th/ 347
METRIC RANK
$57,075
HOUSEHOLDER INCOME UNDER 25 YEARS
100.0/ 100
METRIC RATING
20th/ 347
METRIC RANK

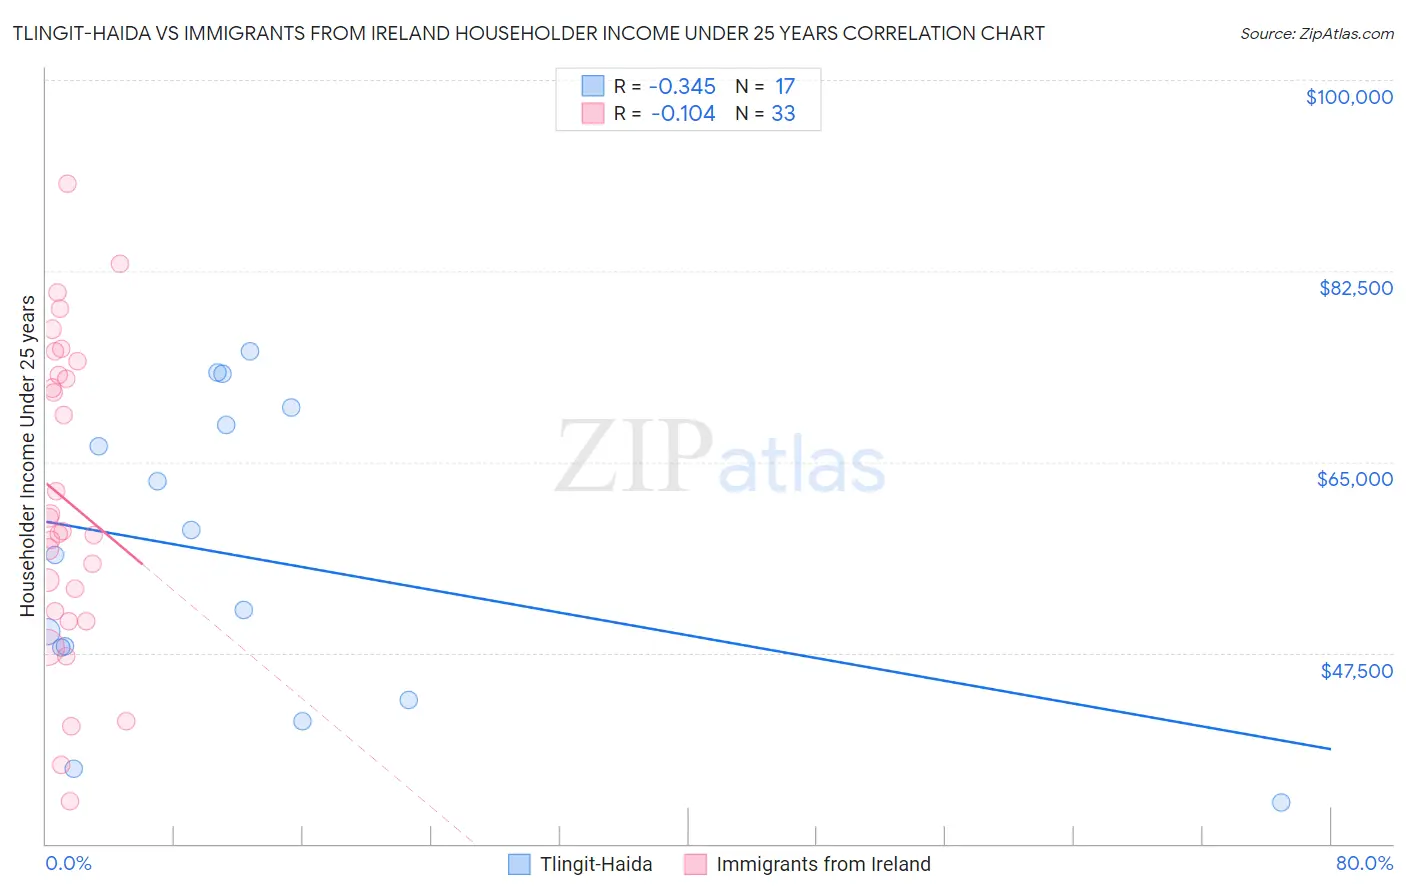
Tlingit-Haida vs Immigrants from Ireland Householder Income Under 25 years Correlation Chart

The statistical analysis conducted on geographies consisting of 57,369,671 people shows a mild negative correlation between the proportion of Tlingit-Haida and household income with householder under the age of 25 in the United States with a correlation coefficient (R) of -0.345 and weighted average of $55,914. Similarly, the statistical analysis conducted on geographies consisting of 203,844,468 people shows a poor negative correlation between the proportion of Immigrants from Ireland and household income with householder under the age of 25 in the United States with a correlation coefficient (R) of -0.104 and weighted average of $57,075, a difference of 2.1%.
Tlingit-Haida vs Immigrants from Ireland Householder Income Under 25 years

Householder Income Under 25 years Correlation Summary

MeasurementTlingit-HaidaImmigrants from Ireland
Minimum$33,750$33,875
Maximum$75,104$90,500
Range$41,354$56,625
Mean$56,260$61,493
Median$56,462$58,663
Interquartile 25% (IQ1)$45,554$50,831
Interquartile 75% (IQ3)$69,196$73,599
Interquartile Range (IQR)$23,642$22,768
Standard Deviation (Sample)$13,469$14,181
Standard Deviation (Population)$13,067$13,964

Demographics Similar to Tlingit-Haida and Immigrants from Ireland by Householder Income Under 25 years

In terms of householder income under 25 years, the demographic groups most similar to Tlingit-Haida are Immigrants from Israel ($55,913, a difference of 0.0%), Immigrants from Japan ($55,932, a difference of 0.030%), Inupiat ($55,935, a difference of 0.040%), Immigrants from Russia ($55,891, a difference of 0.040%), and Peruvian ($56,052, a difference of 0.25%). Similarly, the demographic groups most similar to Immigrants from Ireland are Immigrants from Fiji ($57,074, a difference of 0.0%), Bhutanese ($57,078, a difference of 0.010%), Immigrants from Eastern Asia ($57,123, a difference of 0.080%), Asian ($57,003, a difference of 0.13%), and Tongan ($56,972, a difference of 0.18%).
DemographicsRating | RankHouseholder Income Under 25 years
Sierra Leoneans
100.0
/100
|
#17
Exceptional
$57,272
Immigrants | Eastern Asia
100.0
/100
|
#18
Exceptional
$57,123
Bhutanese
100.0
/100
|
#19
Exceptional
$57,078
Immigrants | Ireland
100.0
/100
|
#20
Exceptional
$57,075
Immigrants | Fiji
100.0
/100
|
#21
Exceptional
$57,074
Asians
100.0
/100
|
#22
Exceptional
$57,003
Tongans
100.0
/100
|
#23
Exceptional
$56,972
Immigrants | Singapore
100.0
/100
|
#24
Exceptional
$56,835
Immigrants | Pakistan
100.0
/100
|
#25
Exceptional
$56,789
Immigrants | Australia
100.0
/100
|
#26
Exceptional
$56,660
Immigrants | North Macedonia
100.0
/100
|
#27
Exceptional
$56,503
Immigrants | Peru
100.0
/100
|
#28
Exceptional
$56,384
Immigrants | Asia
100.0
/100
|
#29
Exceptional
$56,379
Immigrants | Moldova
100.0
/100
|
#30
Exceptional
$56,168
Vietnamese
100.0
/100
|
#31
Exceptional
$56,127
Peruvians
100.0
/100
|
#32
Exceptional
$56,052
Inupiat
100.0
/100
|
#33
Exceptional
$55,935
Immigrants | Japan
100.0
/100
|
#34
Exceptional
$55,932
Tlingit-Haida
100.0
/100
|
#35
Exceptional
$55,914
Immigrants | Israel
100.0
/100
|
#36
Exceptional
$55,913
Immigrants | Russia
100.0
/100
|
#37
Exceptional
$55,891