Tlingit-Haida vs Okinawan Householder Income Under 25 years

COMPARE

Tlingit-Haida
Race
Ancestry
AfghanAfricanAlaska NativeAlaskan AthabascanAlbanianAleutAlsatianAmericanApacheArabArapahoArgentineanArmenianAssyrian/Chaldean/SyriacAustralianAustrianBahamianBangladeshiBarbadianBasqueBelgianBelizeanBermudanBhutaneseBlackfeetBolivianBrazilianBritishBritish West IndianBulgarianBurmeseCajunCambodianCanadianCape VerdeanCarpatho RusynCelticCentral AmericanCentral American IndianCherokeeCheyenneChickasawChileanChineseChippewaChoctawColombianColvilleComancheCosta RicanCreeCreekCroatianCrowCubanCypriotCzechCzechoslovakianDanishDelawareDominicanDutchDutch West IndianEastern EuropeanEcuadorianEgyptianEnglishEstonianEthiopianEuropeanFijianFilipinoFinnishFrenchFrench American IndianFrench CanadianGermanGerman RussianGhanaianGreekGuamanian/ChamorroGuatemalanGuyaneseHaitianHmongHonduranHopiHoumaHungarianIcelanderIndian (Asian)IndonesianInupiatIranianIraqiIrishIroquoisIsraeliItalianJamaicanJapaneseJordanianKenyanKiowaKoreanLaotianLatvianLebaneseLiberianLithuanianLumbeeLuxembourgerMacedonianMalaysianMalteseMarshalleseMenomineeMexicanMexican American IndianMongolianMoroccanNative HawaiianNavajoNepaleseNew ZealanderNicaraguanNigerianNorthern EuropeanNorwegianOsageOttawaPaiutePakistaniPalestinianPanamanianParaguayanPennsylvania GermanPeruvianPimaPolishPortuguesePotawatomiPuebloPuerto RicanPuget Sound SalishRomanianRussianSalvadoranSamoanScandinavianScotch-IrishScottishSeminoleSenegaleseSerbianShoshoneSierra LeoneanSiouxSlavicSlovakSloveneSomaliSouth AfricanSouth AmericanSouth American IndianSoviet UnionSpaniardSpanishSpanish AmericanSpanish American IndianSri LankanSubsaharan AfricanSudaneseSwedishSwissSyrianTaiwaneseThaiTlingit-HaidaTohono O'OdhamTonganTrinidadian and TobagonianTsimshianTurkishU.S. Virgin IslanderUgandanUkrainianUruguayanUteVenezuelanVietnameseWelshWest IndianYakamaYaquiYugoslavianYumanYup'ikZimbabwean
Immigration
NonimmigrantsImmigrantsAfghanistanAfricaAlbaniaArgentinaArmeniaAsiaAustraliaAustriaBahamasBangladeshBarbadosBelarusBelgiumBelizeBoliviaBosnia and HerzegovinaBrazilBulgariaBurma/MyanmarCabo VerdeCambodiaCameroonCanadaCaribbeanCentral AmericaChileChinaColombiaCongoCosta RicaCroatiaCubaCzechoslovakiaDenmarkDominicaDominican RepublicEastern AfricaEastern AsiaEastern EuropeEcuadorEgyptEl SalvadorEnglandEritreaEthiopiaEuropeFijiFranceGermanyGhanaGreeceGrenadaGuatemalaGuyanaHaitiHondurasHong KongHungaryIndiaIndonesiaIranIraqIrelandIsraelItalyJamaicaJapanJordanKazakhstanKenyaKoreaKuwaitLaosLatin AmericaLatviaLebanonLiberiaLithuaniaMalaysiaMexicoMicronesiaMiddle AfricaMoldovaMoroccoNepalNetherlandsNicaraguaNigeriaNorth AmericaNorth MacedoniaNorthern AfricaNorthern EuropeNorwayOceaniaPakistanPanamaPeruPhilippinesPolandPortugalRomaniaRussiaSaudi ArabiaScotlandSenegalSerbiaSierra LeoneSingaporeSomaliaSouth AfricaSouth AmericaSouth Central AsiaSouth Eastern AsiaSouthern EuropeSpainSri LankaSt. Vincent and the GrenadinesSudanSwedenSwitzerlandSyriaTaiwanThailandTrinidad and TobagoTurkeyUgandaUkraineUruguayUzbekistanVenezuelaVietnamWest IndiesWestern AfricaWestern AsiaWestern EuropeYemenZaireZimbabweAzores
Okinawan
Race
Ancestry
AfghanAfricanAlaska NativeAlaskan AthabascanAlbanianAleutAlsatianAmericanApacheArabArapahoArgentineanArmenianAssyrian/Chaldean/SyriacAustralianAustrianBahamianBangladeshiBarbadianBasqueBelgianBelizeanBermudanBhutaneseBlackfeetBolivianBrazilianBritishBritish West IndianBulgarianBurmeseCajunCambodianCanadianCape VerdeanCarpatho RusynCelticCentral AmericanCentral American IndianCherokeeCheyenneChickasawChileanChineseChippewaChoctawColombianColvilleComancheCosta RicanCreeCreekCroatianCrowCubanCypriotCzechCzechoslovakianDanishDelawareDominicanDutchDutch West IndianEastern EuropeanEcuadorianEgyptianEnglishEstonianEthiopianEuropeanFijianFilipinoFinnishFrenchFrench American IndianFrench CanadianGermanGerman RussianGhanaianGreekGuamanian/ChamorroGuatemalanGuyaneseHaitianHmongHonduranHopiHoumaHungarianIcelanderIndian (Asian)IndonesianInupiatIranianIraqiIrishIroquoisIsraeliItalianJamaicanJapaneseJordanianKenyanKiowaKoreanLaotianLatvianLebaneseLiberianLithuanianLumbeeLuxembourgerMacedonianMalaysianMalteseMarshalleseMenomineeMexicanMexican American IndianMongolianMoroccanNative HawaiianNavajoNepaleseNew ZealanderNicaraguanNigerianNorthern EuropeanNorwegianOkinawanOsageOttawaPaiutePakistaniPalestinianPanamanianParaguayanPennsylvania GermanPeruvianPimaPolishPortuguesePotawatomiPuebloPuerto RicanPuget Sound SalishRomanianRussianSalvadoranSamoanScandinavianScotch-IrishScottishSeminoleSenegaleseSerbianShoshoneSierra LeoneanSiouxSlavicSlovakSloveneSomaliSouth AfricanSouth AmericanSouth American IndianSoviet UnionSpaniardSpanishSpanish AmericanSpanish American IndianSri LankanSubsaharan AfricanSudaneseSwedishSwissSyrianTaiwaneseThaiTohono O'OdhamTonganTrinidadian and TobagonianTsimshianTurkishU.S. Virgin IslanderUgandanUkrainianUruguayanUteVenezuelanVietnameseWelshWest IndianYakamaYaquiYugoslavianYumanYup'ikZimbabwean
Immigration
NonimmigrantsImmigrantsAfghanistanAfricaAlbaniaArgentinaArmeniaAsiaAustraliaAustriaBahamasBangladeshBarbadosBelarusBelgiumBelizeBoliviaBosnia and HerzegovinaBrazilBulgariaBurma/MyanmarCabo VerdeCambodiaCameroonCanadaCaribbeanCentral AmericaChileChinaColombiaCongoCosta RicaCroatiaCubaCzechoslovakiaDenmarkDominicaDominican RepublicEastern AfricaEastern AsiaEastern EuropeEcuadorEgyptEl SalvadorEnglandEritreaEthiopiaEuropeFijiFranceGermanyGhanaGreeceGrenadaGuatemalaGuyanaHaitiHondurasHong KongHungaryIndiaIndonesiaIranIraqIrelandIsraelItalyJamaicaJapanJordanKazakhstanKenyaKoreaKuwaitLaosLatin AmericaLatviaLebanonLiberiaLithuaniaMalaysiaMexicoMicronesiaMiddle AfricaMoldovaMoroccoNepalNetherlandsNicaraguaNigeriaNorth AmericaNorth MacedoniaNorthern AfricaNorthern EuropeNorwayOceaniaPakistanPanamaPeruPhilippinesPolandPortugalRomaniaRussiaSaudi ArabiaScotlandSenegalSerbiaSierra LeoneSingaporeSomaliaSouth AfricaSouth AmericaSouth Central AsiaSouth Eastern AsiaSouthern EuropeSpainSri LankaSt. Vincent and the GrenadinesSudanSwedenSwitzerlandSyriaTaiwanThailandTrinidad and TobagoTurkeyUgandaUkraineUruguayUzbekistanVenezuelaVietnamWest IndiesWestern AfricaWestern AsiaWestern EuropeYemenZaireZimbabweAzores
Householder Income Under 25 years
Income
Poverty
Unemployment
Labor Participation
Family Structure
Vehicle Availability
Education Level
Disability

Householder Income Under 25 years Comparison

Tlingit-Haida

Okinawans

Exceptional
Exceptional
$55,914
HOUSEHOLDER INCOME UNDER 25 YEARS
100.0/ 100
METRIC RATING
35th/ 347
METRIC RANK
$54,701
HOUSEHOLDER INCOME UNDER 25 YEARS
99.8/ 100
METRIC RATING
67th/ 347
METRIC RANK

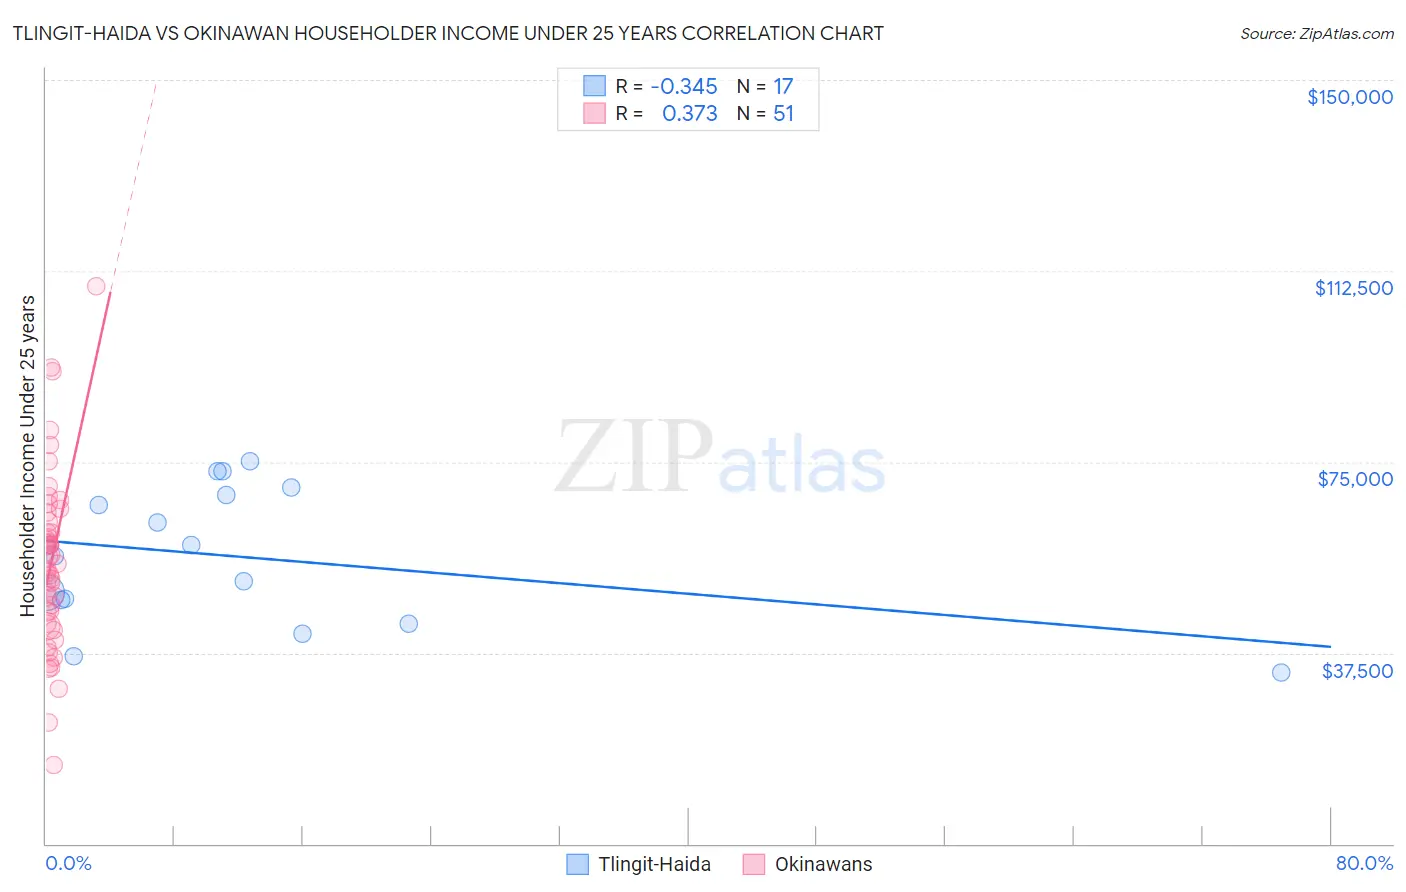
Tlingit-Haida vs Okinawan Householder Income Under 25 years Correlation Chart

The statistical analysis conducted on geographies consisting of 57,369,671 people shows a mild negative correlation between the proportion of Tlingit-Haida and household income with householder under the age of 25 in the United States with a correlation coefficient (R) of -0.345 and weighted average of $55,914. Similarly, the statistical analysis conducted on geographies consisting of 68,735,760 people shows a mild positive correlation between the proportion of Okinawans and household income with householder under the age of 25 in the United States with a correlation coefficient (R) of 0.373 and weighted average of $54,701, a difference of 2.2%.
Tlingit-Haida vs Okinawan Householder Income Under 25 years

Householder Income Under 25 years Correlation Summary

MeasurementTlingit-HaidaOkinawan
Minimum$33,750$15,399
Maximum$75,104$109,471
Range$41,354$94,072
Mean$56,260$55,169
Median$56,462$55,011
Interquartile 25% (IQ1)$45,554$43,283
Interquartile 75% (IQ3)$69,196$63,230
Interquartile Range (IQR)$23,642$19,947
Standard Deviation (Sample)$13,469$17,374
Standard Deviation (Population)$13,067$17,203

Similar Demographics by Householder Income Under 25 years

Demographics Similar to Tlingit-Haida by Householder Income Under 25 years

In terms of householder income under 25 years, the demographic groups most similar to Tlingit-Haida are Immigrants from Israel ($55,913, a difference of 0.0%), Immigrants from Japan ($55,932, a difference of 0.030%), Inupiat ($55,935, a difference of 0.040%), Immigrants from Russia ($55,891, a difference of 0.040%), and Immigrants from Iran ($55,880, a difference of 0.060%).
DemographicsRating | RankHouseholder Income Under 25 years
Immigrants | Peru
100.0
/100
|
#28
Exceptional
$56,384
Immigrants | Asia
100.0
/100
|
#29
Exceptional
$56,379
Immigrants | Moldova
100.0
/100
|
#30
Exceptional
$56,168
Vietnamese
100.0
/100
|
#31
Exceptional
$56,127
Peruvians
100.0
/100
|
#32
Exceptional
$56,052
Inupiat
100.0
/100
|
#33
Exceptional
$55,935
Immigrants | Japan
100.0
/100
|
#34
Exceptional
$55,932
Tlingit-Haida
100.0
/100
|
#35
Exceptional
$55,914
Immigrants | Israel
100.0
/100
|
#36
Exceptional
$55,913
Immigrants | Russia
100.0
/100
|
#37
Exceptional
$55,891
Immigrants | Iran
100.0
/100
|
#38
Exceptional
$55,880
Immigrants | Belarus
100.0
/100
|
#39
Exceptional
$55,743
Immigrants | Greece
100.0
/100
|
#40
Exceptional
$55,727
Immigrants | Guyana
100.0
/100
|
#41
Exceptional
$55,726
Immigrants | Korea
100.0
/100
|
#42
Exceptional
$55,716

Demographics Similar to Okinawans by Householder Income Under 25 years

In terms of householder income under 25 years, the demographic groups most similar to Okinawans are Immigrants from Bangladesh ($54,714, a difference of 0.020%), Yup'ik ($54,732, a difference of 0.060%), Tsimshian ($54,649, a difference of 0.10%), Samoan ($54,610, a difference of 0.17%), and Burmese ($54,800, a difference of 0.18%).
DemographicsRating | RankHouseholder Income Under 25 years
Immigrants | Lithuania
99.9
/100
|
#60
Exceptional
$55,028
Immigrants | Europe
99.9
/100
|
#61
Exceptional
$55,022
Immigrants | Uzbekistan
99.8
/100
|
#62
Exceptional
$54,846
Immigrants | Belgium
99.8
/100
|
#63
Exceptional
$54,830
Burmese
99.8
/100
|
#64
Exceptional
$54,800
Yup'ik
99.8
/100
|
#65
Exceptional
$54,732
Immigrants | Bangladesh
99.8
/100
|
#66
Exceptional
$54,714
Okinawans
99.8
/100
|
#67
Exceptional
$54,701
Tsimshian
99.8
/100
|
#68
Exceptional
$54,649
Samoans
99.7
/100
|
#69
Exceptional
$54,610
Immigrants | El Salvador
99.7
/100
|
#70
Exceptional
$54,599
Immigrants | Morocco
99.7
/100
|
#71
Exceptional
$54,593
Immigrants | Northern Europe
99.7
/100
|
#72
Exceptional
$54,571
Macedonians
99.7
/100
|
#73
Exceptional
$54,563
Immigrants | Grenada
99.7
/100
|
#74
Exceptional
$54,538