Tlingit-Haida vs Greek Householder Income Under 25 years
COMPARE
Tlingit-Haida
Greek
Householder Income Under 25 years
Householder Income Under 25 years Comparison
Tlingit-Haida
Greeks
$55,914
HOUSEHOLDER INCOME UNDER 25 YEARS
100.0/ 100
METRIC RATING
35th/ 347
METRIC RANK
$53,715
HOUSEHOLDER INCOME UNDER 25 YEARS
97.7/ 100
METRIC RATING
110th/ 347
METRIC RANK
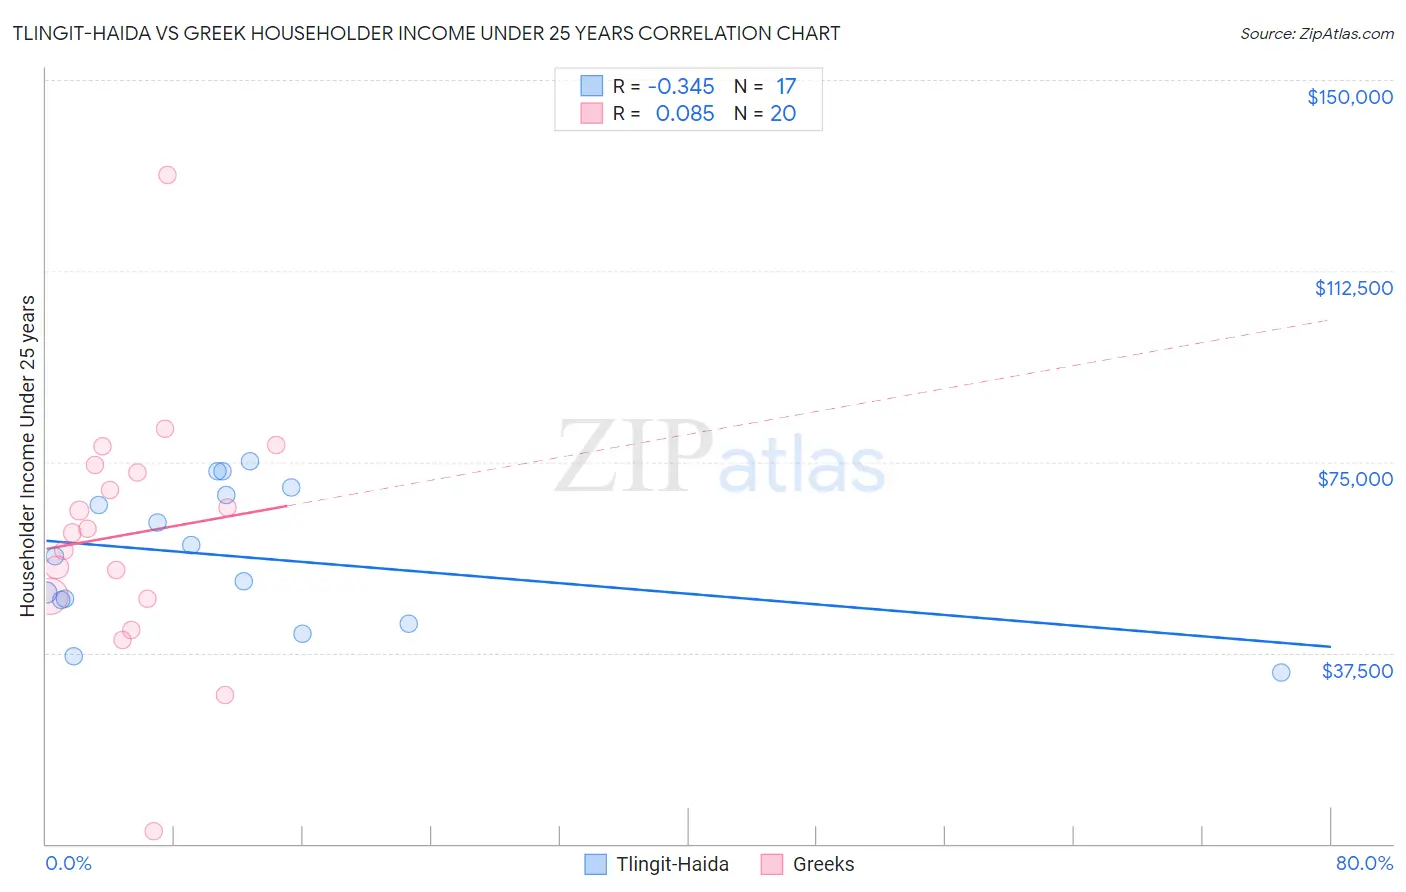
Tlingit-Haida vs Greek Householder Income Under 25 years Correlation Chart
The statistical analysis conducted on geographies consisting of 57,369,671 people shows a mild negative correlation between the proportion of Tlingit-Haida and household income with householder under the age of 25 in the United States with a correlation coefficient (R) of -0.345 and weighted average of $55,914. Similarly, the statistical analysis conducted on geographies consisting of 391,360,962 people shows a slight positive correlation between the proportion of Greeks and household income with householder under the age of 25 in the United States with a correlation coefficient (R) of 0.085 and weighted average of $53,715, a difference of 4.1%.
Householder Income Under 25 years Correlation Summary
| Measurement | Tlingit-Haida | Greek |
| Minimum | $33,750 | $2,499 |
| Maximum | $75,104 | $131,250 |
| Range | $41,354 | $128,751 |
| Mean | $56,260 | $60,821 |
| Median | $56,462 | $61,415 |
| Interquartile 25% (IQ1) | $45,554 | $48,366 |
| Interquartile 75% (IQ3) | $69,196 | $73,725 |
| Interquartile Range (IQR) | $23,642 | $25,359 |
| Standard Deviation (Sample) | $13,469 | $25,180 |
| Standard Deviation (Population) | $13,067 | $24,542 |
Similar Demographics by Householder Income Under 25 years
Demographics Similar to Tlingit-Haida by Householder Income Under 25 years
In terms of householder income under 25 years, the demographic groups most similar to Tlingit-Haida are Immigrants from Israel ($55,913, a difference of 0.0%), Immigrants from Japan ($55,932, a difference of 0.030%), Inupiat ($55,935, a difference of 0.040%), Immigrants from Russia ($55,891, a difference of 0.040%), and Immigrants from Iran ($55,880, a difference of 0.060%).
| Demographics | Rating | Rank | Householder Income Under 25 years |
| Immigrants | Peru | 100.0 /100 | #28 | Exceptional $56,384 |
| Immigrants | Asia | 100.0 /100 | #29 | Exceptional $56,379 |
| Immigrants | Moldova | 100.0 /100 | #30 | Exceptional $56,168 |
| Vietnamese | 100.0 /100 | #31 | Exceptional $56,127 |
| Peruvians | 100.0 /100 | #32 | Exceptional $56,052 |
| Inupiat | 100.0 /100 | #33 | Exceptional $55,935 |
| Immigrants | Japan | 100.0 /100 | #34 | Exceptional $55,932 |
| Tlingit-Haida | 100.0 /100 | #35 | Exceptional $55,914 |
| Immigrants | Israel | 100.0 /100 | #36 | Exceptional $55,913 |
| Immigrants | Russia | 100.0 /100 | #37 | Exceptional $55,891 |
| Immigrants | Iran | 100.0 /100 | #38 | Exceptional $55,880 |
| Immigrants | Belarus | 100.0 /100 | #39 | Exceptional $55,743 |
| Immigrants | Greece | 100.0 /100 | #40 | Exceptional $55,727 |
| Immigrants | Guyana | 100.0 /100 | #41 | Exceptional $55,726 |
| Immigrants | Korea | 100.0 /100 | #42 | Exceptional $55,716 |
Demographics Similar to Greeks by Householder Income Under 25 years
In terms of householder income under 25 years, the demographic groups most similar to Greeks are Immigrants from Colombia ($53,714, a difference of 0.0%), Immigrants from Ecuador ($53,722, a difference of 0.010%), Australian ($53,739, a difference of 0.040%), Maltese ($53,735, a difference of 0.040%), and Immigrants from Oceania ($53,680, a difference of 0.070%).
| Demographics | Rating | Rank | Householder Income Under 25 years |
| Ukrainians | 98.3 /100 | #103 | Exceptional $53,843 |
| Ethiopians | 98.2 /100 | #104 | Exceptional $53,818 |
| Immigrants | France | 98.1 /100 | #105 | Exceptional $53,805 |
| Albanians | 98.1 /100 | #106 | Exceptional $53,794 |
| Australians | 97.8 /100 | #107 | Exceptional $53,739 |
| Maltese | 97.8 /100 | #108 | Exceptional $53,735 |
| Immigrants | Ecuador | 97.7 /100 | #109 | Exceptional $53,722 |
| Greeks | 97.7 /100 | #110 | Exceptional $53,715 |
| Immigrants | Colombia | 97.7 /100 | #111 | Exceptional $53,714 |
| Immigrants | Oceania | 97.5 /100 | #112 | Exceptional $53,680 |
| Romanians | 97.2 /100 | #113 | Exceptional $53,632 |
| Immigrants | Sweden | 97.1 /100 | #114 | Exceptional $53,621 |
| Immigrants | Albania | 96.9 /100 | #115 | Exceptional $53,597 |
| Immigrants | Spain | 96.6 /100 | #116 | Exceptional $53,560 |
| Lithuanians | 96.6 /100 | #117 | Exceptional $53,552 |