Native/Alaskan vs Thai Householder Income Under 25 years
COMPARE
Native/Alaskan
Thai
Householder Income Under 25 years
Householder Income Under 25 years Comparison
Natives/Alaskans
Thais
$47,704
HOUSEHOLDER INCOME UNDER 25 YEARS
0.0/ 100
METRIC RATING
306th/ 347
METRIC RANK
$59,187
HOUSEHOLDER INCOME UNDER 25 YEARS
100.0/ 100
METRIC RATING
6th/ 347
METRIC RANK
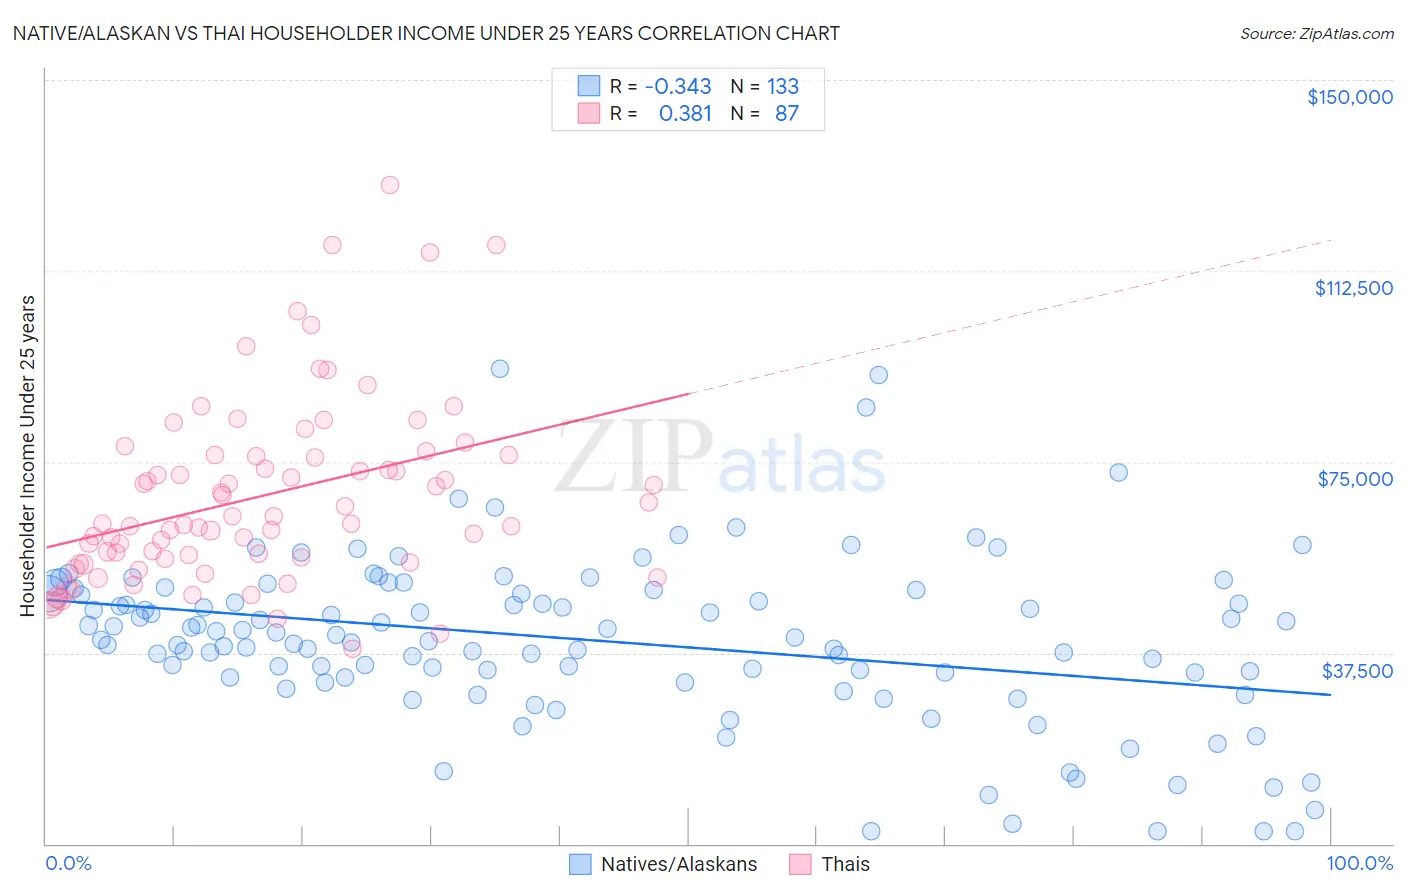
Native/Alaskan vs Thai Householder Income Under 25 years Correlation Chart
The statistical analysis conducted on geographies consisting of 416,135,889 people shows a mild negative correlation between the proportion of Natives/Alaskans and household income with householder under the age of 25 in the United States with a correlation coefficient (R) of -0.343 and weighted average of $47,704. Similarly, the statistical analysis conducted on geographies consisting of 390,520,827 people shows a mild positive correlation between the proportion of Thais and household income with householder under the age of 25 in the United States with a correlation coefficient (R) of 0.381 and weighted average of $59,187, a difference of 24.1%.
Householder Income Under 25 years Correlation Summary
| Measurement | Native/Alaskan | Thai |
| Minimum | $2,499 | $38,359 |
| Maximum | $93,365 | $129,301 |
| Range | $90,866 | $90,942 |
| Mean | $40,011 | $68,286 |
| Median | $40,469 | $62,959 |
| Interquartile 25% (IQ1) | $32,640 | $56,029 |
| Interquartile 75% (IQ3) | $49,547 | $76,245 |
| Interquartile Range (IQR) | $16,907 | $20,216 |
| Standard Deviation (Sample) | $16,339 | $17,960 |
| Standard Deviation (Population) | $16,277 | $17,857 |
Similar Demographics by Householder Income Under 25 years
Demographics Similar to Natives/Alaskans by Householder Income Under 25 years
In terms of householder income under 25 years, the demographic groups most similar to Natives/Alaskans are Bangladeshi ($47,589, a difference of 0.24%), Cherokee ($47,848, a difference of 0.30%), Comanche ($47,518, a difference of 0.39%), Menominee ($47,907, a difference of 0.43%), and Immigrants from Middle Africa ($47,916, a difference of 0.44%).
| Demographics | Rating | Rank | Householder Income Under 25 years |
| Immigrants | Honduras | 0.0 /100 | #299 | Tragic $48,267 |
| Immigrants | Somalia | 0.0 /100 | #300 | Tragic $48,135 |
| Immigrants | Kuwait | 0.0 /100 | #301 | Tragic $48,126 |
| Immigrants | Liberia | 0.0 /100 | #302 | Tragic $47,981 |
| Immigrants | Middle Africa | 0.0 /100 | #303 | Tragic $47,916 |
| Menominee | 0.0 /100 | #304 | Tragic $47,907 |
| Cherokee | 0.0 /100 | #305 | Tragic $47,848 |
| Natives/Alaskans | 0.0 /100 | #306 | Tragic $47,704 |
| Bangladeshis | 0.0 /100 | #307 | Tragic $47,589 |
| Comanche | 0.0 /100 | #308 | Tragic $47,518 |
| U.S. Virgin Islanders | 0.0 /100 | #309 | Tragic $47,448 |
| Iroquois | 0.0 /100 | #310 | Tragic $47,380 |
| Ottawa | 0.0 /100 | #311 | Tragic $47,366 |
| Bermudans | 0.0 /100 | #312 | Tragic $47,359 |
| Delaware | 0.0 /100 | #313 | Tragic $47,159 |
Demographics Similar to Thais by Householder Income Under 25 years
In terms of householder income under 25 years, the demographic groups most similar to Thais are Immigrants from Bolivia ($59,389, a difference of 0.34%), Immigrants from Taiwan ($59,424, a difference of 0.40%), Bolivian ($58,506, a difference of 1.2%), Immigrants from India ($59,914, a difference of 1.2%), and Indian (Asian) ($58,239, a difference of 1.6%).
| Demographics | Rating | Rank | Householder Income Under 25 years |
| Assyrians/Chaldeans/Syriacs | 100.0 /100 | #1 | Exceptional $65,329 |
| Immigrants | Hong Kong | 100.0 /100 | #2 | Exceptional $62,083 |
| Immigrants | India | 100.0 /100 | #3 | Exceptional $59,914 |
| Immigrants | Taiwan | 100.0 /100 | #4 | Exceptional $59,424 |
| Immigrants | Bolivia | 100.0 /100 | #5 | Exceptional $59,389 |
| Thais | 100.0 /100 | #6 | Exceptional $59,187 |
| Bolivians | 100.0 /100 | #7 | Exceptional $58,506 |
| Indians (Asian) | 100.0 /100 | #8 | Exceptional $58,239 |
| Chinese | 100.0 /100 | #9 | Exceptional $58,162 |
| Afghans | 100.0 /100 | #10 | Exceptional $58,019 |
| Immigrants | China | 100.0 /100 | #11 | Exceptional $57,931 |
| Immigrants | Philippines | 100.0 /100 | #12 | Exceptional $57,930 |
| Immigrants | South Central Asia | 100.0 /100 | #13 | Exceptional $57,818 |
| Filipinos | 100.0 /100 | #14 | Exceptional $57,740 |
| Koreans | 100.0 /100 | #15 | Exceptional $57,730 |