Tlingit-Haida vs Thai Disability Age 18 to 34

COMPARE

Tlingit-Haida
Race
Ancestry
AfghanAfricanAlaska NativeAlaskan AthabascanAlbanianAleutAlsatianAmericanApacheArabArapahoArgentineanArmenianAssyrian/Chaldean/SyriacAustralianAustrianBahamianBangladeshiBarbadianBasqueBelgianBelizeanBermudanBhutaneseBlackfeetBolivianBrazilianBritishBritish West IndianBulgarianBurmeseCajunCambodianCanadianCape VerdeanCarpatho RusynCelticCentral AmericanCentral American IndianCherokeeCheyenneChickasawChileanChineseChippewaChoctawColombianColvilleComancheCosta RicanCreeCreekCroatianCrowCubanCypriotCzechCzechoslovakianDanishDelawareDominicanDutchDutch West IndianEastern EuropeanEcuadorianEgyptianEnglishEstonianEthiopianEuropeanFijianFilipinoFinnishFrenchFrench American IndianFrench CanadianGermanGerman RussianGhanaianGreekGuamanian/ChamorroGuatemalanGuyaneseHaitianHmongHonduranHopiHoumaHungarianIcelanderIndian (Asian)IndonesianInupiatIranianIraqiIrishIroquoisIsraeliItalianJamaicanJapaneseJordanianKenyanKiowaKoreanLaotianLatvianLebaneseLiberianLithuanianLumbeeLuxembourgerMacedonianMalaysianMalteseMarshalleseMenomineeMexicanMexican American IndianMongolianMoroccanNative HawaiianNavajoNepaleseNew ZealanderNicaraguanNigerianNorthern EuropeanNorwegianOkinawanOsageOttawaPaiutePakistaniPalestinianPanamanianParaguayanPennsylvania GermanPeruvianPimaPolishPortuguesePotawatomiPuebloPuerto RicanPuget Sound SalishRomanianRussianSalvadoranSamoanScandinavianScotch-IrishScottishSeminoleSenegaleseSerbianShoshoneSierra LeoneanSiouxSlavicSlovakSloveneSomaliSouth AfricanSouth AmericanSouth American IndianSoviet UnionSpaniardSpanishSpanish AmericanSpanish American IndianSri LankanSubsaharan AfricanSudaneseSwedishSwissSyrianTaiwaneseTlingit-HaidaTohono O'OdhamTonganTrinidadian and TobagonianTsimshianTurkishU.S. Virgin IslanderUgandanUkrainianUruguayanUteVenezuelanVietnameseWelshWest IndianYakamaYaquiYugoslavianYumanYup'ikZimbabwean
Immigration
NonimmigrantsImmigrantsAfghanistanAfricaAlbaniaArgentinaArmeniaAsiaAustraliaAustriaBahamasBangladeshBarbadosBelarusBelgiumBelizeBoliviaBosnia and HerzegovinaBrazilBulgariaBurma/MyanmarCabo VerdeCambodiaCameroonCanadaCaribbeanCentral AmericaChileChinaColombiaCongoCosta RicaCroatiaCubaCzechoslovakiaDenmarkDominicaDominican RepublicEastern AfricaEastern AsiaEastern EuropeEcuadorEgyptEl SalvadorEnglandEritreaEthiopiaEuropeFijiFranceGermanyGhanaGreeceGrenadaGuatemalaGuyanaHaitiHondurasHong KongHungaryIndiaIndonesiaIranIraqIrelandIsraelItalyJamaicaJapanJordanKazakhstanKenyaKoreaKuwaitLaosLatin AmericaLatviaLebanonLiberiaLithuaniaMalaysiaMexicoMicronesiaMiddle AfricaMoldovaMoroccoNepalNetherlandsNicaraguaNigeriaNorth AmericaNorth MacedoniaNorthern AfricaNorthern EuropeNorwayOceaniaPakistanPanamaPeruPhilippinesPolandPortugalRomaniaRussiaSaudi ArabiaScotlandSenegalSerbiaSierra LeoneSingaporeSomaliaSouth AfricaSouth AmericaSouth Central AsiaSouth Eastern AsiaSouthern EuropeSpainSri LankaSt. Vincent and the GrenadinesSudanSwedenSwitzerlandSyriaTaiwanThailandTrinidad and TobagoTurkeyUgandaUkraineUruguayUzbekistanVenezuelaVietnamWest IndiesWestern AfricaWestern AsiaWestern EuropeYemenZaireZimbabweAzores
Thai
Race
Ancestry
AfghanAfricanAlaska NativeAlaskan AthabascanAlbanianAleutAlsatianAmericanApacheArabArapahoArgentineanArmenianAssyrian/Chaldean/SyriacAustralianAustrianBahamianBangladeshiBarbadianBasqueBelgianBelizeanBermudanBhutaneseBlackfeetBolivianBrazilianBritishBritish West IndianBulgarianBurmeseCajunCambodianCanadianCape VerdeanCarpatho RusynCelticCentral AmericanCentral American IndianCherokeeCheyenneChickasawChileanChineseChippewaChoctawColombianColvilleComancheCosta RicanCreeCreekCroatianCrowCubanCypriotCzechCzechoslovakianDanishDelawareDominicanDutchDutch West IndianEastern EuropeanEcuadorianEgyptianEnglishEstonianEthiopianEuropeanFijianFilipinoFinnishFrenchFrench American IndianFrench CanadianGermanGerman RussianGhanaianGreekGuamanian/ChamorroGuatemalanGuyaneseHaitianHmongHonduranHopiHoumaHungarianIcelanderIndian (Asian)IndonesianInupiatIranianIraqiIrishIroquoisIsraeliItalianJamaicanJapaneseJordanianKenyanKiowaKoreanLaotianLatvianLebaneseLiberianLithuanianLumbeeLuxembourgerMacedonianMalaysianMalteseMarshalleseMenomineeMexicanMexican American IndianMongolianMoroccanNative HawaiianNavajoNepaleseNew ZealanderNicaraguanNigerianNorthern EuropeanNorwegianOkinawanOsageOttawaPaiutePakistaniPalestinianPanamanianParaguayanPennsylvania GermanPeruvianPimaPolishPortuguesePotawatomiPuebloPuerto RicanPuget Sound SalishRomanianRussianSalvadoranSamoanScandinavianScotch-IrishScottishSeminoleSenegaleseSerbianShoshoneSierra LeoneanSiouxSlavicSlovakSloveneSomaliSouth AfricanSouth AmericanSouth American IndianSoviet UnionSpaniardSpanishSpanish AmericanSpanish American IndianSri LankanSubsaharan AfricanSudaneseSwedishSwissSyrianTaiwaneseThaiTohono O'OdhamTonganTrinidadian and TobagonianTsimshianTurkishU.S. Virgin IslanderUgandanUkrainianUruguayanUteVenezuelanVietnameseWelshWest IndianYakamaYaquiYugoslavianYumanYup'ikZimbabwean
Immigration
NonimmigrantsImmigrantsAfghanistanAfricaAlbaniaArgentinaArmeniaAsiaAustraliaAustriaBahamasBangladeshBarbadosBelarusBelgiumBelizeBoliviaBosnia and HerzegovinaBrazilBulgariaBurma/MyanmarCabo VerdeCambodiaCameroonCanadaCaribbeanCentral AmericaChileChinaColombiaCongoCosta RicaCroatiaCubaCzechoslovakiaDenmarkDominicaDominican RepublicEastern AfricaEastern AsiaEastern EuropeEcuadorEgyptEl SalvadorEnglandEritreaEthiopiaEuropeFijiFranceGermanyGhanaGreeceGrenadaGuatemalaGuyanaHaitiHondurasHong KongHungaryIndiaIndonesiaIranIraqIrelandIsraelItalyJamaicaJapanJordanKazakhstanKenyaKoreaKuwaitLaosLatin AmericaLatviaLebanonLiberiaLithuaniaMalaysiaMexicoMicronesiaMiddle AfricaMoldovaMoroccoNepalNetherlandsNicaraguaNigeriaNorth AmericaNorth MacedoniaNorthern AfricaNorthern EuropeNorwayOceaniaPakistanPanamaPeruPhilippinesPolandPortugalRomaniaRussiaSaudi ArabiaScotlandSenegalSerbiaSierra LeoneSingaporeSomaliaSouth AfricaSouth AmericaSouth Central AsiaSouth Eastern AsiaSouthern EuropeSpainSri LankaSt. Vincent and the GrenadinesSudanSwedenSwitzerlandSyriaTaiwanThailandTrinidad and TobagoTurkeyUgandaUkraineUruguayUzbekistanVenezuelaVietnamWest IndiesWestern AfricaWestern AsiaWestern EuropeYemenZaireZimbabweAzores
Disability Age 18 to 34
Income
Poverty
Unemployment
Labor Participation
Family Structure
Vehicle Availability
Education Level
Disability

Disability Age 18 to 34 Comparison

Tlingit-Haida

Thais

Tragic
Exceptional
7.7%
DISABILITY AGE 18 TO 34
0.0/ 100
METRIC RATING
295th/ 347
METRIC RANK
5.6%
DISABILITY AGE 18 TO 34
100.0/ 100
METRIC RATING
19th/ 347
METRIC RANK

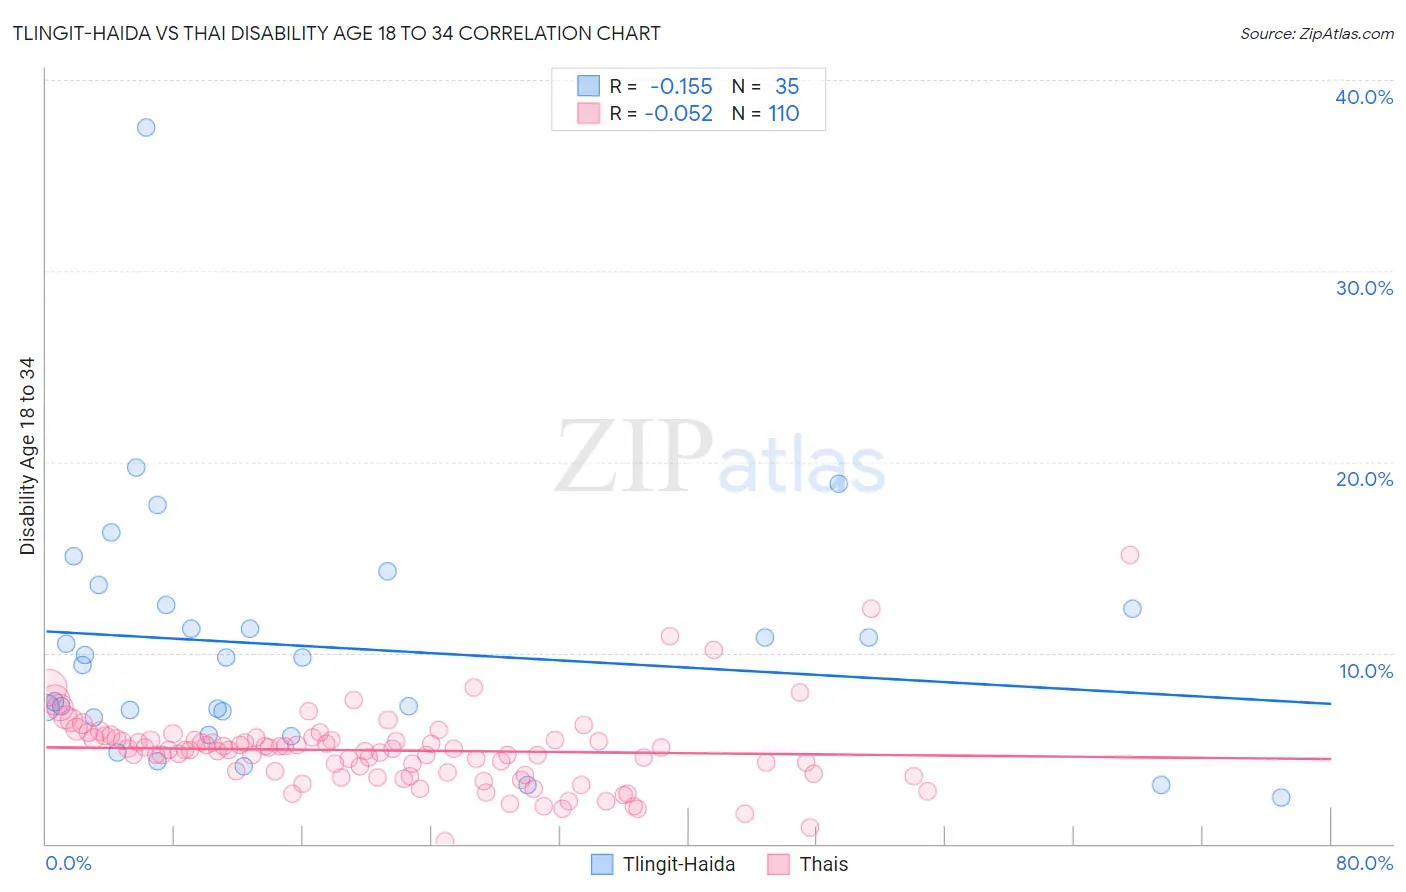
Tlingit-Haida vs Thai Disability Age 18 to 34 Correlation Chart

The statistical analysis conducted on geographies consisting of 60,778,142 people shows a poor negative correlation between the proportion of Tlingit-Haida and percentage of population with a disability between the ages 18 and 35 in the United States with a correlation coefficient (R) of -0.155 and weighted average of 7.7%. Similarly, the statistical analysis conducted on geographies consisting of 474,471,926 people shows a slight negative correlation between the proportion of Thais and percentage of population with a disability between the ages 18 and 35 in the United States with a correlation coefficient (R) of -0.052 and weighted average of 5.6%, a difference of 36.7%.
Tlingit-Haida vs Thai Disability Age 18 to 34

Disability Age 18 to 34 Correlation Summary

MeasurementTlingit-HaidaThai
Minimum2.4%0.11%
Maximum37.5%15.2%
Range35.1%15.0%
Mean10.3%4.9%
Median9.7%4.9%
Interquartile 25% (IQ1)6.6%3.7%
Interquartile 75% (IQ3)12.5%5.5%
Interquartile Range (IQR)5.9%1.8%
Standard Deviation (Sample)6.5%2.1%
Standard Deviation (Population)6.4%2.1%

Similar Demographics by Disability Age 18 to 34

Demographics Similar to Tlingit-Haida by Disability Age 18 to 34

In terms of disability age 18 to 34, the demographic groups most similar to Tlingit-Haida are Immigrants from Cabo Verde (7.7%, a difference of 0.010%), Scandinavian (7.7%, a difference of 0.16%), Cape Verdean (7.7%, a difference of 0.18%), Pueblo (7.7%, a difference of 0.19%), and Black/African American (7.7%, a difference of 0.22%).
DemographicsRating | RankDisability Age 18 to 34
Whites/Caucasians
0.0
/100
|
#288
Tragic
7.6%
Immigrants | Nonimmigrants
0.0
/100
|
#289
Tragic
7.6%
Slovaks
0.0
/100
|
#290
Tragic
7.7%
Irish
0.0
/100
|
#291
Tragic
7.7%
Blacks/African Americans
0.0
/100
|
#292
Tragic
7.7%
Scandinavians
0.0
/100
|
#293
Tragic
7.7%
Immigrants | Cabo Verde
0.0
/100
|
#294
Tragic
7.7%
Tlingit-Haida
0.0
/100
|
#295
Tragic
7.7%
Cape Verdeans
0.0
/100
|
#296
Tragic
7.7%
Pueblo
0.0
/100
|
#297
Tragic
7.7%
Dutch
0.0
/100
|
#298
Tragic
7.7%
Germans
0.0
/100
|
#299
Tragic
7.7%
Scottish
0.0
/100
|
#300
Tragic
7.7%
Pima
0.0
/100
|
#301
Tragic
7.7%
Welsh
0.0
/100
|
#302
Tragic
7.7%

Demographics Similar to Thais by Disability Age 18 to 34

In terms of disability age 18 to 34, the demographic groups most similar to Thais are Immigrants from Bolivia (5.6%, a difference of 0.070%), Immigrants from Bangladesh (5.6%, a difference of 0.17%), Immigrants from South Central Asia (5.7%, a difference of 0.74%), Immigrants from Nicaragua (5.7%, a difference of 0.81%), and Immigrants from Eastern Asia (5.6%, a difference of 0.83%).
DemographicsRating | RankDisability Age 18 to 34
Immigrants | St. Vincent and the Grenadines
100.0
/100
|
#12
Exceptional
5.5%
Immigrants | Iran
100.0
/100
|
#13
Exceptional
5.5%
Indians (Asian)
100.0
/100
|
#14
Exceptional
5.5%
Immigrants | India
100.0
/100
|
#15
Exceptional
5.6%
Immigrants | Israel
100.0
/100
|
#16
Exceptional
5.6%
Immigrants | Eastern Asia
100.0
/100
|
#17
Exceptional
5.6%
Immigrants | Bolivia
100.0
/100
|
#18
Exceptional
5.6%
Thais
100.0
/100
|
#19
Exceptional
5.6%
Immigrants | Bangladesh
100.0
/100
|
#20
Exceptional
5.6%
Immigrants | South Central Asia
100.0
/100
|
#21
Exceptional
5.7%
Immigrants | Nicaragua
100.0
/100
|
#22
Exceptional
5.7%
Cubans
100.0
/100
|
#23
Exceptional
5.7%
Immigrants | Argentina
100.0
/100
|
#24
Exceptional
5.7%
Immigrants | Singapore
100.0
/100
|
#25
Exceptional
5.7%
Immigrants | Colombia
100.0
/100
|
#26
Exceptional
5.7%