Tlingit-Haida vs Cuban Householder Income Under 25 years
COMPARE
Tlingit-Haida
Cuban
Householder Income Under 25 years
Householder Income Under 25 years Comparison
Tlingit-Haida
Cubans
$55,914
HOUSEHOLDER INCOME UNDER 25 YEARS
100.0/ 100
METRIC RATING
35th/ 347
METRIC RANK
$50,655
HOUSEHOLDER INCOME UNDER 25 YEARS
2.3/ 100
METRIC RATING
242nd/ 347
METRIC RANK
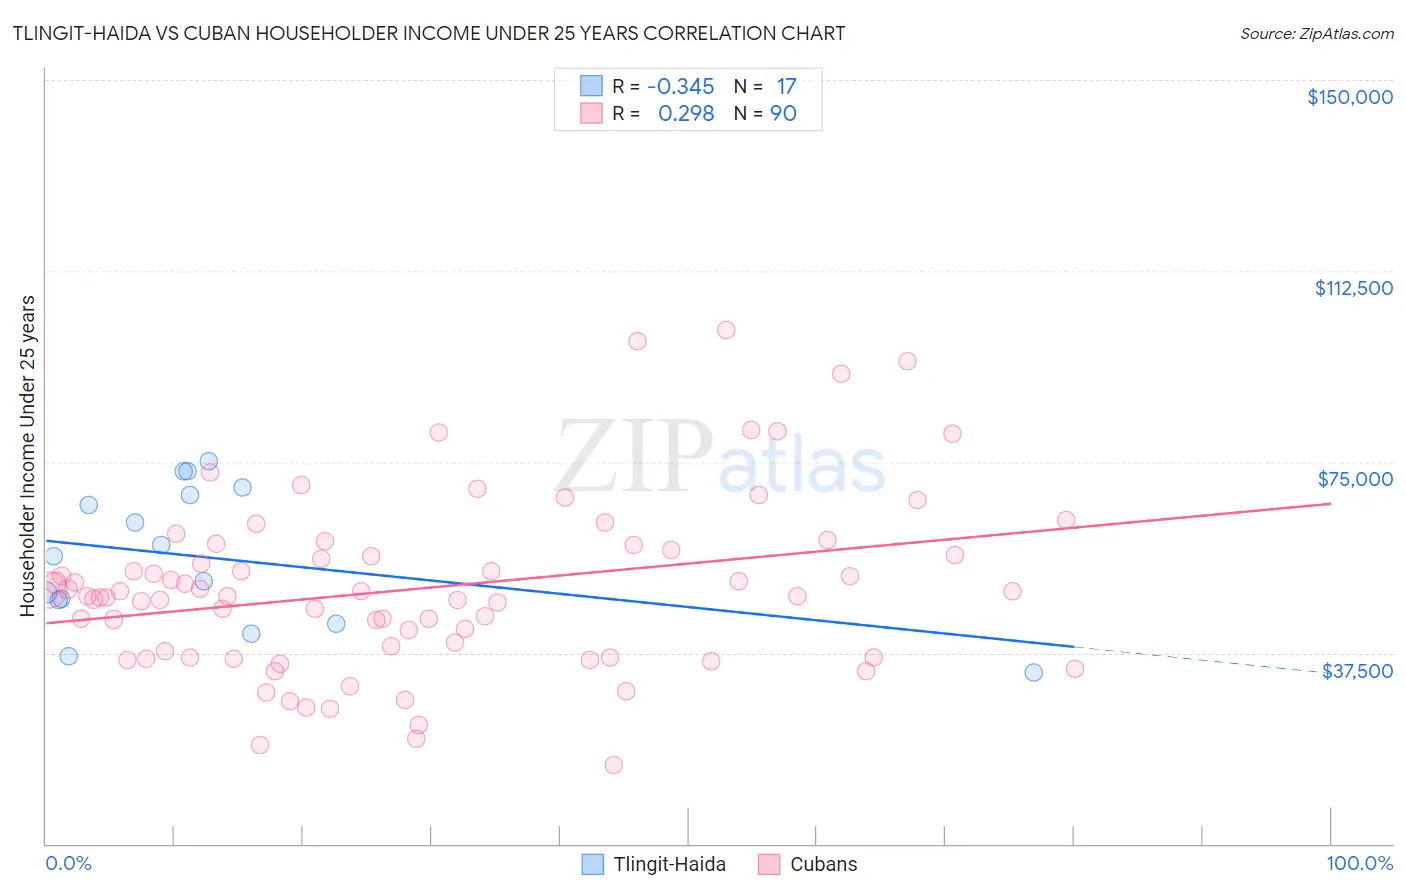
Tlingit-Haida vs Cuban Householder Income Under 25 years Correlation Chart
The statistical analysis conducted on geographies consisting of 57,369,671 people shows a mild negative correlation between the proportion of Tlingit-Haida and household income with householder under the age of 25 in the United States with a correlation coefficient (R) of -0.345 and weighted average of $55,914. Similarly, the statistical analysis conducted on geographies consisting of 372,353,328 people shows a weak positive correlation between the proportion of Cubans and household income with householder under the age of 25 in the United States with a correlation coefficient (R) of 0.298 and weighted average of $50,655, a difference of 10.4%.
Householder Income Under 25 years Correlation Summary
| Measurement | Tlingit-Haida | Cuban |
| Minimum | $33,750 | $15,559 |
| Maximum | $75,104 | $100,948 |
| Range | $41,354 | $85,389 |
| Mean | $56,260 | $50,192 |
| Median | $56,462 | $48,589 |
| Interquartile 25% (IQ1) | $45,554 | $36,667 |
| Interquartile 75% (IQ3) | $69,196 | $57,791 |
| Interquartile Range (IQR) | $23,642 | $21,124 |
| Standard Deviation (Sample) | $13,469 | $17,185 |
| Standard Deviation (Population) | $13,067 | $17,090 |
Similar Demographics by Householder Income Under 25 years
Demographics Similar to Tlingit-Haida by Householder Income Under 25 years
In terms of householder income under 25 years, the demographic groups most similar to Tlingit-Haida are Immigrants from Israel ($55,913, a difference of 0.0%), Immigrants from Japan ($55,932, a difference of 0.030%), Inupiat ($55,935, a difference of 0.040%), Immigrants from Russia ($55,891, a difference of 0.040%), and Immigrants from Iran ($55,880, a difference of 0.060%).
| Demographics | Rating | Rank | Householder Income Under 25 years |
| Immigrants | Peru | 100.0 /100 | #28 | Exceptional $56,384 |
| Immigrants | Asia | 100.0 /100 | #29 | Exceptional $56,379 |
| Immigrants | Moldova | 100.0 /100 | #30 | Exceptional $56,168 |
| Vietnamese | 100.0 /100 | #31 | Exceptional $56,127 |
| Peruvians | 100.0 /100 | #32 | Exceptional $56,052 |
| Inupiat | 100.0 /100 | #33 | Exceptional $55,935 |
| Immigrants | Japan | 100.0 /100 | #34 | Exceptional $55,932 |
| Tlingit-Haida | 100.0 /100 | #35 | Exceptional $55,914 |
| Immigrants | Israel | 100.0 /100 | #36 | Exceptional $55,913 |
| Immigrants | Russia | 100.0 /100 | #37 | Exceptional $55,891 |
| Immigrants | Iran | 100.0 /100 | #38 | Exceptional $55,880 |
| Immigrants | Belarus | 100.0 /100 | #39 | Exceptional $55,743 |
| Immigrants | Greece | 100.0 /100 | #40 | Exceptional $55,727 |
| Immigrants | Guyana | 100.0 /100 | #41 | Exceptional $55,726 |
| Immigrants | Korea | 100.0 /100 | #42 | Exceptional $55,716 |
Demographics Similar to Cubans by Householder Income Under 25 years
In terms of householder income under 25 years, the demographic groups most similar to Cubans are Immigrants from Thailand ($50,645, a difference of 0.020%), Marshallese ($50,627, a difference of 0.060%), Immigrants from Micronesia ($50,691, a difference of 0.070%), Immigrants from Africa ($50,609, a difference of 0.090%), and Welsh ($50,597, a difference of 0.12%).
| Demographics | Rating | Rank | Householder Income Under 25 years |
| Spanish | 3.3 /100 | #235 | Tragic $50,813 |
| English | 3.3 /100 | #236 | Tragic $50,805 |
| Germans | 3.3 /100 | #237 | Tragic $50,804 |
| Iraqis | 3.2 /100 | #238 | Tragic $50,802 |
| Immigrants | Caribbean | 2.9 /100 | #239 | Tragic $50,757 |
| Immigrants | Lebanon | 2.7 /100 | #240 | Tragic $50,729 |
| Immigrants | Micronesia | 2.5 /100 | #241 | Tragic $50,691 |
| Cubans | 2.3 /100 | #242 | Tragic $50,655 |
| Immigrants | Thailand | 2.2 /100 | #243 | Tragic $50,645 |
| Marshallese | 2.1 /100 | #244 | Tragic $50,627 |
| Immigrants | Africa | 2.0 /100 | #245 | Tragic $50,609 |
| Welsh | 2.0 /100 | #246 | Tragic $50,597 |
| Immigrants | Bosnia and Herzegovina | 1.8 /100 | #247 | Tragic $50,565 |
| Slavs | 1.8 /100 | #248 | Tragic $50,563 |
| Scottish | 1.8 /100 | #249 | Tragic $50,554 |