Tlingit-Haida vs South American Householder Income Under 25 years
COMPARE
Tlingit-Haida
South American
Householder Income Under 25 years
Householder Income Under 25 years Comparison
Tlingit-Haida
South Americans
$55,914
HOUSEHOLDER INCOME UNDER 25 YEARS
100.0/ 100
METRIC RATING
35th/ 347
METRIC RANK
$53,939
HOUSEHOLDER INCOME UNDER 25 YEARS
98.6/ 100
METRIC RATING
101st/ 347
METRIC RANK
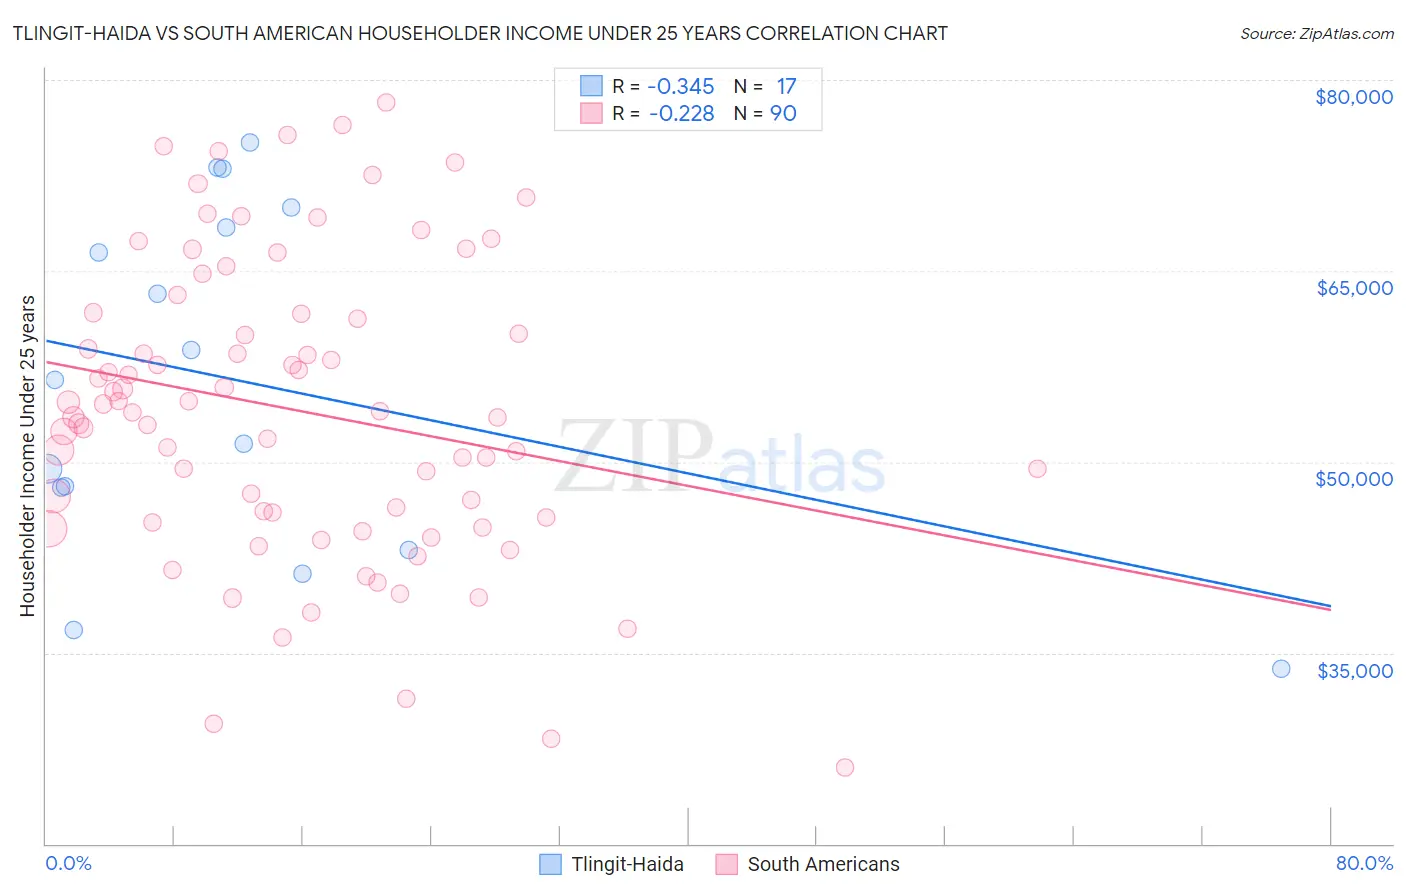
Tlingit-Haida vs South American Householder Income Under 25 years Correlation Chart
The statistical analysis conducted on geographies consisting of 57,369,671 people shows a mild negative correlation between the proportion of Tlingit-Haida and household income with householder under the age of 25 in the United States with a correlation coefficient (R) of -0.345 and weighted average of $55,914. Similarly, the statistical analysis conducted on geographies consisting of 401,700,019 people shows a weak negative correlation between the proportion of South Americans and household income with householder under the age of 25 in the United States with a correlation coefficient (R) of -0.228 and weighted average of $53,939, a difference of 3.7%.
Householder Income Under 25 years Correlation Summary
| Measurement | Tlingit-Haida | South American |
| Minimum | $33,750 | $26,011 |
| Maximum | $75,104 | $78,265 |
| Range | $41,354 | $52,254 |
| Mean | $56,260 | $54,082 |
| Median | $56,462 | $53,957 |
| Interquartile 25% (IQ1) | $45,554 | $45,625 |
| Interquartile 75% (IQ3) | $69,196 | $61,659 |
| Interquartile Range (IQR) | $23,642 | $16,034 |
| Standard Deviation (Sample) | $13,469 | $11,713 |
| Standard Deviation (Population) | $13,067 | $11,648 |
Similar Demographics by Householder Income Under 25 years
Demographics Similar to Tlingit-Haida by Householder Income Under 25 years
In terms of householder income under 25 years, the demographic groups most similar to Tlingit-Haida are Immigrants from Israel ($55,913, a difference of 0.0%), Immigrants from Japan ($55,932, a difference of 0.030%), Inupiat ($55,935, a difference of 0.040%), Immigrants from Russia ($55,891, a difference of 0.040%), and Immigrants from Iran ($55,880, a difference of 0.060%).
| Demographics | Rating | Rank | Householder Income Under 25 years |
| Immigrants | Peru | 100.0 /100 | #28 | Exceptional $56,384 |
| Immigrants | Asia | 100.0 /100 | #29 | Exceptional $56,379 |
| Immigrants | Moldova | 100.0 /100 | #30 | Exceptional $56,168 |
| Vietnamese | 100.0 /100 | #31 | Exceptional $56,127 |
| Peruvians | 100.0 /100 | #32 | Exceptional $56,052 |
| Inupiat | 100.0 /100 | #33 | Exceptional $55,935 |
| Immigrants | Japan | 100.0 /100 | #34 | Exceptional $55,932 |
| Tlingit-Haida | 100.0 /100 | #35 | Exceptional $55,914 |
| Immigrants | Israel | 100.0 /100 | #36 | Exceptional $55,913 |
| Immigrants | Russia | 100.0 /100 | #37 | Exceptional $55,891 |
| Immigrants | Iran | 100.0 /100 | #38 | Exceptional $55,880 |
| Immigrants | Belarus | 100.0 /100 | #39 | Exceptional $55,743 |
| Immigrants | Greece | 100.0 /100 | #40 | Exceptional $55,727 |
| Immigrants | Guyana | 100.0 /100 | #41 | Exceptional $55,726 |
| Immigrants | Korea | 100.0 /100 | #42 | Exceptional $55,716 |
Demographics Similar to South Americans by Householder Income Under 25 years
In terms of householder income under 25 years, the demographic groups most similar to South Americans are Ecuadorian ($53,911, a difference of 0.050%), Immigrants from Kazakhstan ($53,990, a difference of 0.090%), Alaska Native ($54,000, a difference of 0.11%), Ukrainian ($53,843, a difference of 0.18%), and Ethiopian ($53,818, a difference of 0.22%).
| Demographics | Rating | Rank | Householder Income Under 25 years |
| Immigrants | Sierra Leone | 99.3 /100 | #94 | Exceptional $54,190 |
| Immigrants | Malaysia | 99.2 /100 | #95 | Exceptional $54,179 |
| Argentineans | 99.2 /100 | #96 | Exceptional $54,154 |
| Immigrants | Portugal | 99.1 /100 | #97 | Exceptional $54,105 |
| Eastern Europeans | 99.0 /100 | #98 | Exceptional $54,066 |
| Alaska Natives | 98.8 /100 | #99 | Exceptional $54,000 |
| Immigrants | Kazakhstan | 98.8 /100 | #100 | Exceptional $53,990 |
| South Americans | 98.6 /100 | #101 | Exceptional $53,939 |
| Ecuadorians | 98.5 /100 | #102 | Exceptional $53,911 |
| Ukrainians | 98.3 /100 | #103 | Exceptional $53,843 |
| Ethiopians | 98.2 /100 | #104 | Exceptional $53,818 |
| Immigrants | France | 98.1 /100 | #105 | Exceptional $53,805 |
| Albanians | 98.1 /100 | #106 | Exceptional $53,794 |
| Australians | 97.8 /100 | #107 | Exceptional $53,739 |
| Maltese | 97.8 /100 | #108 | Exceptional $53,735 |