Somali vs Bhutanese Median Household Income
COMPARE
Somali
Bhutanese
Median Household Income
Median Household Income Comparison
Somalis
Bhutanese
$75,782
MEDIAN HOUSEHOLD INCOME
0.3/ 100
METRIC RATING
272nd/ 347
METRIC RANK
$100,151
MEDIAN HOUSEHOLD INCOME
100.0/ 100
METRIC RATING
27th/ 347
METRIC RANK
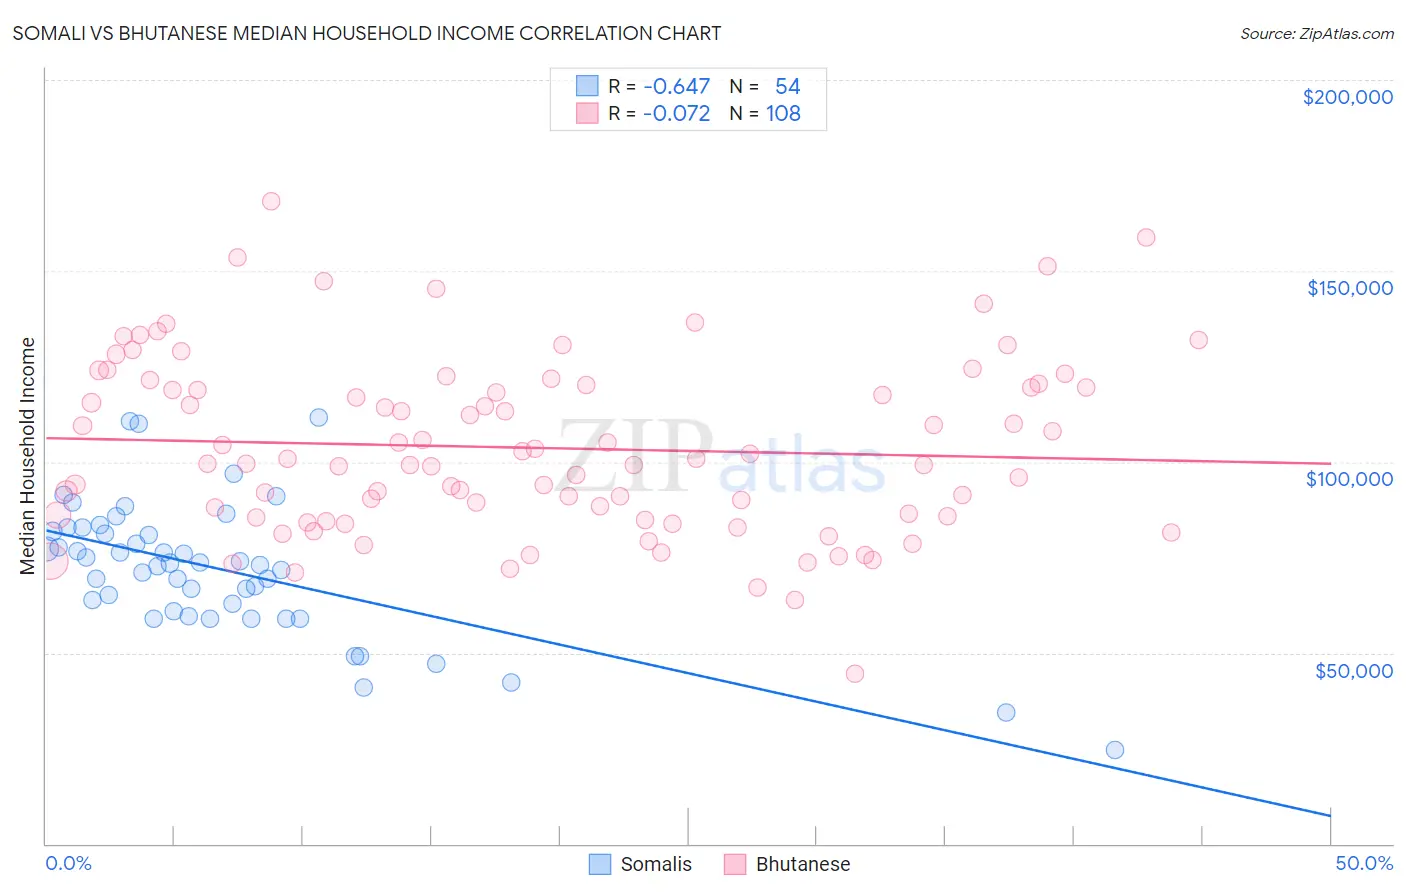
Somali vs Bhutanese Median Household Income Correlation Chart
The statistical analysis conducted on geographies consisting of 99,284,368 people shows a significant negative correlation between the proportion of Somalis and median household income in the United States with a correlation coefficient (R) of -0.647 and weighted average of $75,782. Similarly, the statistical analysis conducted on geographies consisting of 455,036,820 people shows a slight negative correlation between the proportion of Bhutanese and median household income in the United States with a correlation coefficient (R) of -0.072 and weighted average of $100,151, a difference of 32.2%.
Median Household Income Correlation Summary
| Measurement | Somali | Bhutanese |
| Minimum | $24,660 | $44,611 |
| Maximum | $111,550 | $168,247 |
| Range | $86,890 | $123,636 |
| Mean | $71,854 | $103,677 |
| Median | $73,292 | $100,131 |
| Interquartile 25% (IQ1) | $60,808 | $85,552 |
| Interquartile 75% (IQ3) | $81,847 | $119,777 |
| Interquartile Range (IQR) | $21,039 | $34,225 |
| Standard Deviation (Sample) | $17,515 | $23,044 |
| Standard Deviation (Population) | $17,352 | $22,937 |
Similar Demographics by Median Household Income
Demographics Similar to Somalis by Median Household Income
In terms of median household income, the demographic groups most similar to Somalis are Pennsylvania German ($75,814, a difference of 0.040%), Hmong ($75,839, a difference of 0.080%), Immigrants from Jamaica ($75,851, a difference of 0.090%), Cape Verdean ($75,848, a difference of 0.090%), and German Russian ($75,856, a difference of 0.10%).
| Demographics | Rating | Rank | Median Household Income |
| Immigrants | Belize | 0.3 /100 | #265 | Tragic $75,938 |
| Americans | 0.3 /100 | #266 | Tragic $75,932 |
| German Russians | 0.3 /100 | #267 | Tragic $75,856 |
| Immigrants | Jamaica | 0.3 /100 | #268 | Tragic $75,851 |
| Cape Verdeans | 0.3 /100 | #269 | Tragic $75,848 |
| Hmong | 0.3 /100 | #270 | Tragic $75,839 |
| Pennsylvania Germans | 0.3 /100 | #271 | Tragic $75,814 |
| Somalis | 0.3 /100 | #272 | Tragic $75,782 |
| Liberians | 0.2 /100 | #273 | Tragic $75,667 |
| British West Indians | 0.2 /100 | #274 | Tragic $75,647 |
| Immigrants | Micronesia | 0.2 /100 | #275 | Tragic $75,574 |
| Immigrants | Latin America | 0.2 /100 | #276 | Tragic $75,420 |
| Spanish Americans | 0.2 /100 | #277 | Tragic $75,386 |
| Osage | 0.2 /100 | #278 | Tragic $75,240 |
| Immigrants | Guatemala | 0.2 /100 | #279 | Tragic $75,123 |
Demographics Similar to Bhutanese by Median Household Income
In terms of median household income, the demographic groups most similar to Bhutanese are Immigrants from Belgium ($100,306, a difference of 0.15%), Immigrants from Sri Lanka ($99,943, a difference of 0.21%), Immigrants from Asia ($99,933, a difference of 0.22%), Immigrants from Northern Europe ($99,813, a difference of 0.34%), and Immigrants from Sweden ($100,699, a difference of 0.55%).
| Demographics | Rating | Rank | Median Household Income |
| Bolivians | 100.0 /100 | #20 | Exceptional $102,195 |
| Eastern Europeans | 100.0 /100 | #21 | Exceptional $101,781 |
| Asians | 100.0 /100 | #22 | Exceptional $101,681 |
| Immigrants | Bolivia | 100.0 /100 | #23 | Exceptional $101,394 |
| Immigrants | Japan | 100.0 /100 | #24 | Exceptional $100,711 |
| Immigrants | Sweden | 100.0 /100 | #25 | Exceptional $100,699 |
| Immigrants | Belgium | 100.0 /100 | #26 | Exceptional $100,306 |
| Bhutanese | 100.0 /100 | #27 | Exceptional $100,151 |
| Immigrants | Sri Lanka | 100.0 /100 | #28 | Exceptional $99,943 |
| Immigrants | Asia | 100.0 /100 | #29 | Exceptional $99,933 |
| Immigrants | Northern Europe | 100.0 /100 | #30 | Exceptional $99,813 |
| Turks | 100.0 /100 | #31 | Exceptional $99,389 |
| Immigrants | Denmark | 100.0 /100 | #32 | Exceptional $98,510 |
| Chinese | 100.0 /100 | #33 | Exceptional $98,496 |
| Russians | 100.0 /100 | #34 | Exceptional $98,008 |