Somali vs Immigrants from Norway Median Household Income
COMPARE
Somali
Immigrants from Norway
Median Household Income
Median Household Income Comparison
Somalis
Immigrants from Norway
$75,782
MEDIAN HOUSEHOLD INCOME
0.3/ 100
METRIC RATING
272nd/ 347
METRIC RANK
$94,846
MEDIAN HOUSEHOLD INCOME
99.8/ 100
METRIC RATING
62nd/ 347
METRIC RANK
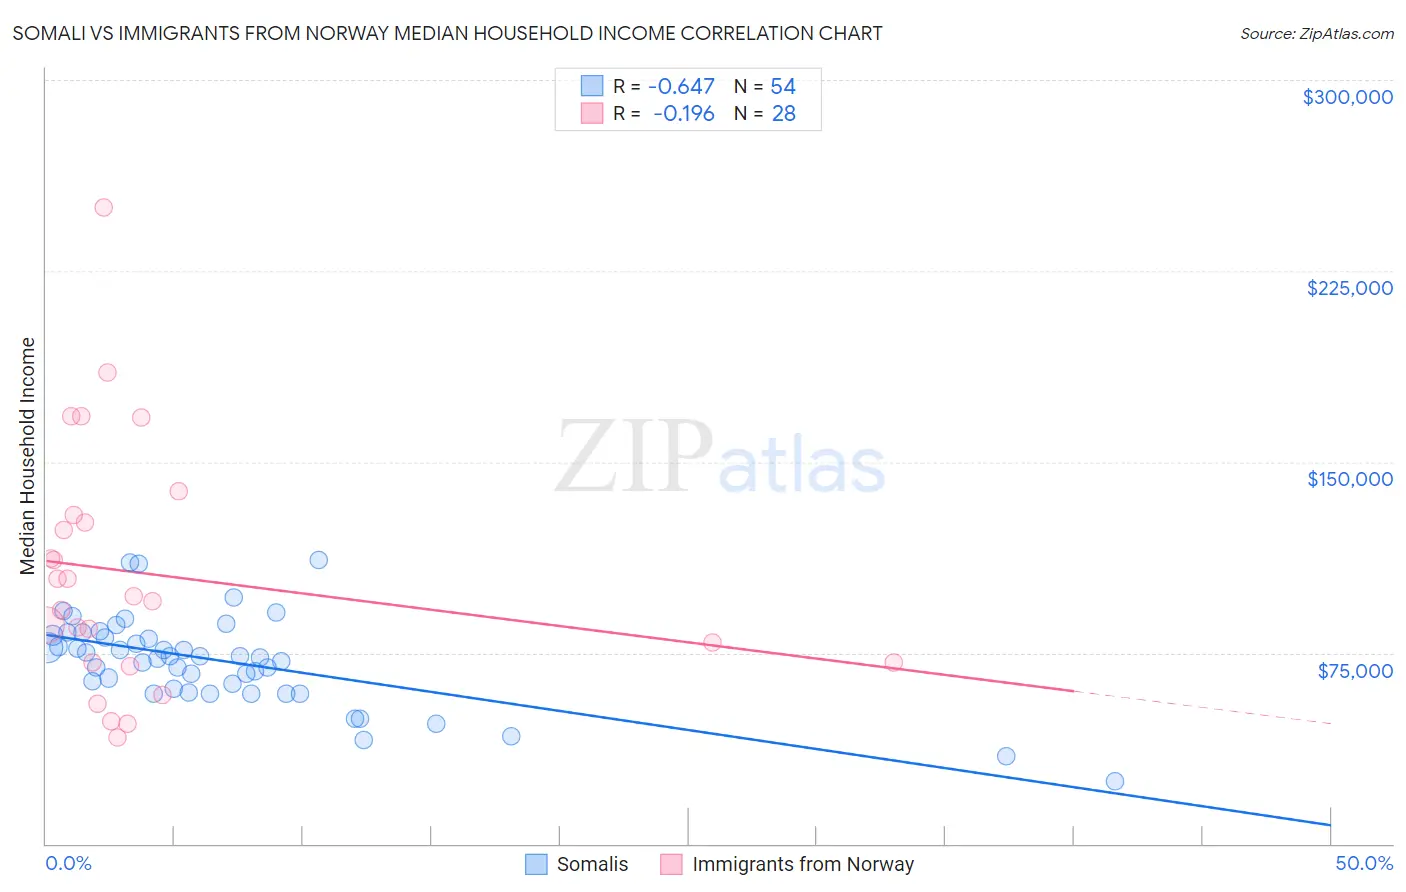
Somali vs Immigrants from Norway Median Household Income Correlation Chart
The statistical analysis conducted on geographies consisting of 99,284,368 people shows a significant negative correlation between the proportion of Somalis and median household income in the United States with a correlation coefficient (R) of -0.647 and weighted average of $75,782. Similarly, the statistical analysis conducted on geographies consisting of 116,683,199 people shows a poor negative correlation between the proportion of Immigrants from Norway and median household income in the United States with a correlation coefficient (R) of -0.196 and weighted average of $94,846, a difference of 25.2%.
Median Household Income Correlation Summary
| Measurement | Somali | Immigrants from Norway |
| Minimum | $24,660 | $41,875 |
| Maximum | $111,550 | $250,001 |
| Range | $86,890 | $208,126 |
| Mean | $71,854 | $106,024 |
| Median | $73,292 | $96,218 |
| Interquartile 25% (IQ1) | $60,808 | $71,155 |
| Interquartile 75% (IQ3) | $81,847 | $127,785 |
| Interquartile Range (IQR) | $21,039 | $56,630 |
| Standard Deviation (Sample) | $17,515 | $48,243 |
| Standard Deviation (Population) | $17,352 | $47,374 |
Similar Demographics by Median Household Income
Demographics Similar to Somalis by Median Household Income
In terms of median household income, the demographic groups most similar to Somalis are Pennsylvania German ($75,814, a difference of 0.040%), Hmong ($75,839, a difference of 0.080%), Immigrants from Jamaica ($75,851, a difference of 0.090%), Cape Verdean ($75,848, a difference of 0.090%), and German Russian ($75,856, a difference of 0.10%).
| Demographics | Rating | Rank | Median Household Income |
| Immigrants | Belize | 0.3 /100 | #265 | Tragic $75,938 |
| Americans | 0.3 /100 | #266 | Tragic $75,932 |
| German Russians | 0.3 /100 | #267 | Tragic $75,856 |
| Immigrants | Jamaica | 0.3 /100 | #268 | Tragic $75,851 |
| Cape Verdeans | 0.3 /100 | #269 | Tragic $75,848 |
| Hmong | 0.3 /100 | #270 | Tragic $75,839 |
| Pennsylvania Germans | 0.3 /100 | #271 | Tragic $75,814 |
| Somalis | 0.3 /100 | #272 | Tragic $75,782 |
| Liberians | 0.2 /100 | #273 | Tragic $75,667 |
| British West Indians | 0.2 /100 | #274 | Tragic $75,647 |
| Immigrants | Micronesia | 0.2 /100 | #275 | Tragic $75,574 |
| Immigrants | Latin America | 0.2 /100 | #276 | Tragic $75,420 |
| Spanish Americans | 0.2 /100 | #277 | Tragic $75,386 |
| Osage | 0.2 /100 | #278 | Tragic $75,240 |
| Immigrants | Guatemala | 0.2 /100 | #279 | Tragic $75,123 |
Demographics Similar to Immigrants from Norway by Median Household Income
In terms of median household income, the demographic groups most similar to Immigrants from Norway are Greek ($94,735, a difference of 0.12%), Laotian ($94,990, a difference of 0.15%), Korean ($95,018, a difference of 0.18%), Immigrants from Europe ($95,032, a difference of 0.20%), and Soviet Union ($95,098, a difference of 0.27%).
| Demographics | Rating | Rank | Median Household Income |
| Immigrants | Czechoslovakia | 99.9 /100 | #55 | Exceptional $95,319 |
| Immigrants | Austria | 99.9 /100 | #56 | Exceptional $95,277 |
| New Zealanders | 99.8 /100 | #57 | Exceptional $95,146 |
| Soviet Union | 99.8 /100 | #58 | Exceptional $95,098 |
| Immigrants | Europe | 99.8 /100 | #59 | Exceptional $95,032 |
| Koreans | 99.8 /100 | #60 | Exceptional $95,018 |
| Laotians | 99.8 /100 | #61 | Exceptional $94,990 |
| Immigrants | Norway | 99.8 /100 | #62 | Exceptional $94,846 |
| Greeks | 99.8 /100 | #63 | Exceptional $94,735 |
| Immigrants | Netherlands | 99.7 /100 | #64 | Exceptional $94,411 |
| Immigrants | Belarus | 99.7 /100 | #65 | Exceptional $94,399 |
| Immigrants | Romania | 99.7 /100 | #66 | Exceptional $94,222 |
| Immigrants | Scotland | 99.7 /100 | #67 | Exceptional $94,091 |
| Mongolians | 99.7 /100 | #68 | Exceptional $93,971 |
| Argentineans | 99.7 /100 | #69 | Exceptional $93,960 |