Filipino vs Bhutanese Median Household Income
COMPARE
Filipino
Bhutanese
Median Household Income
Median Household Income Comparison
Filipinos
Bhutanese
$115,509
MEDIAN HOUSEHOLD INCOME
100.0/ 100
METRIC RATING
2nd/ 347
METRIC RANK
$100,151
MEDIAN HOUSEHOLD INCOME
100.0/ 100
METRIC RATING
27th/ 347
METRIC RANK
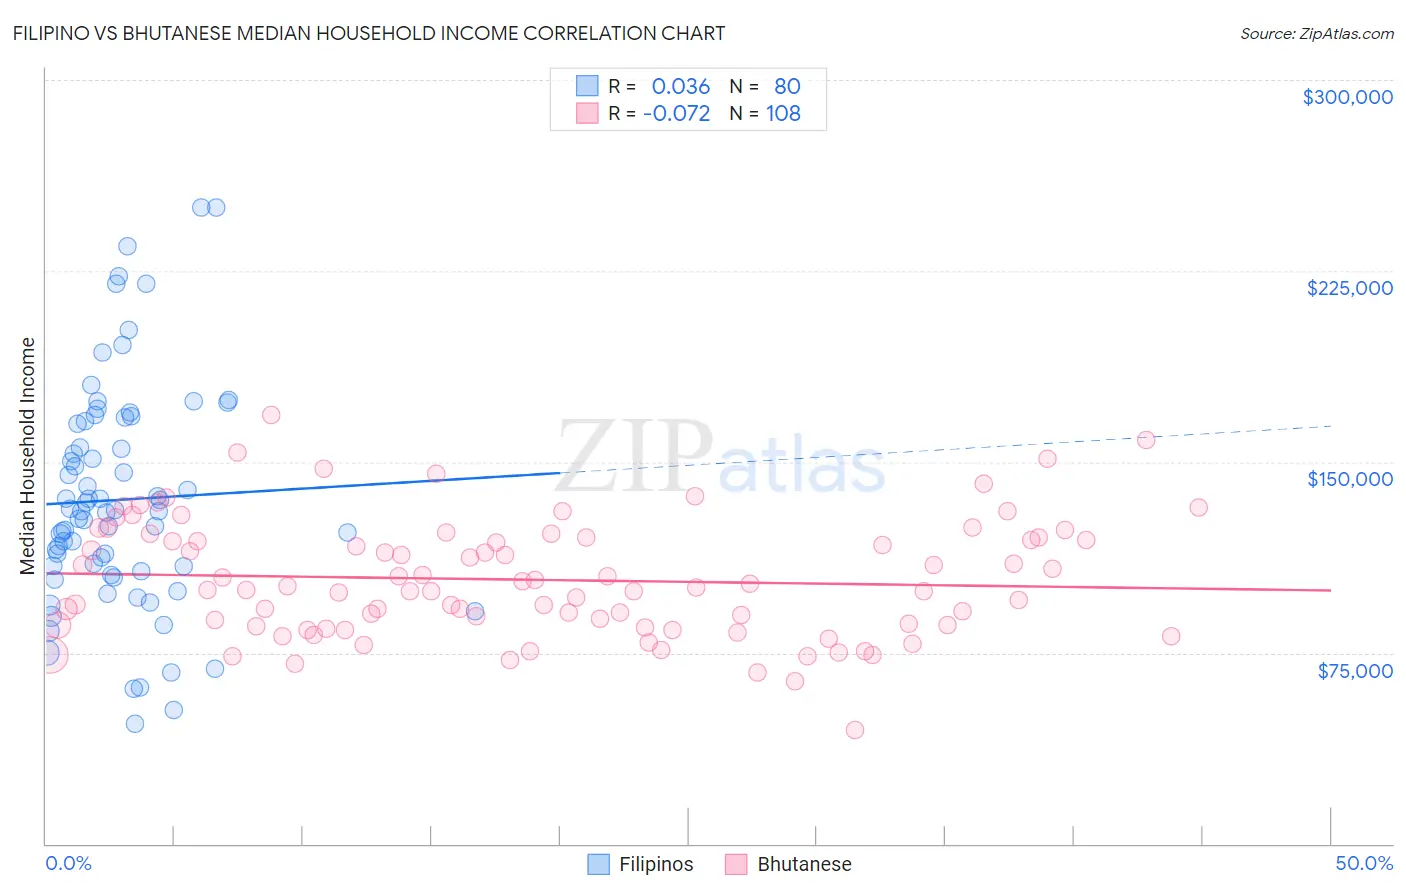
Filipino vs Bhutanese Median Household Income Correlation Chart
The statistical analysis conducted on geographies consisting of 254,115,678 people shows no correlation between the proportion of Filipinos and median household income in the United States with a correlation coefficient (R) of 0.036 and weighted average of $115,509. Similarly, the statistical analysis conducted on geographies consisting of 455,036,820 people shows a slight negative correlation between the proportion of Bhutanese and median household income in the United States with a correlation coefficient (R) of -0.072 and weighted average of $100,151, a difference of 15.3%.
Median Household Income Correlation Summary
| Measurement | Filipino | Bhutanese |
| Minimum | $47,188 | $44,611 |
| Maximum | $250,001 | $168,247 |
| Range | $202,813 | $123,636 |
| Mean | $135,113 | $103,677 |
| Median | $130,633 | $100,131 |
| Interquartile 25% (IQ1) | $107,886 | $85,552 |
| Interquartile 75% (IQ3) | $165,301 | $119,777 |
| Interquartile Range (IQR) | $57,415 | $34,225 |
| Standard Deviation (Sample) | $43,772 | $23,044 |
| Standard Deviation (Population) | $43,498 | $22,937 |
Similar Demographics by Median Household Income
Demographics Similar to Filipinos by Median Household Income
In terms of median household income, the demographic groups most similar to Filipinos are Immigrants from Taiwan ($116,460, a difference of 0.82%), Immigrants from India ($113,009, a difference of 2.2%), Immigrants from Hong Kong ($111,519, a difference of 3.6%), Thai ($110,648, a difference of 4.4%), and Immigrants from Singapore ($110,428, a difference of 4.6%).
| Demographics | Rating | Rank | Median Household Income |
| Immigrants | Taiwan | 100.0 /100 | #1 | Exceptional $116,460 |
| Filipinos | 100.0 /100 | #2 | Exceptional $115,509 |
| Immigrants | India | 100.0 /100 | #3 | Exceptional $113,009 |
| Immigrants | Hong Kong | 100.0 /100 | #4 | Exceptional $111,519 |
| Thais | 100.0 /100 | #5 | Exceptional $110,648 |
| Immigrants | Singapore | 100.0 /100 | #6 | Exceptional $110,428 |
| Iranians | 100.0 /100 | #7 | Exceptional $109,835 |
| Immigrants | Iran | 100.0 /100 | #8 | Exceptional $108,055 |
| Okinawans | 100.0 /100 | #9 | Exceptional $106,624 |
| Immigrants | South Central Asia | 100.0 /100 | #10 | Exceptional $106,057 |
| Immigrants | China | 100.0 /100 | #11 | Exceptional $105,335 |
| Indians (Asian) | 100.0 /100 | #12 | Exceptional $105,262 |
| Immigrants | Eastern Asia | 100.0 /100 | #13 | Exceptional $104,796 |
| Immigrants | Ireland | 100.0 /100 | #14 | Exceptional $104,692 |
| Immigrants | Israel | 100.0 /100 | #15 | Exceptional $104,090 |
Demographics Similar to Bhutanese by Median Household Income
In terms of median household income, the demographic groups most similar to Bhutanese are Immigrants from Belgium ($100,306, a difference of 0.15%), Immigrants from Sri Lanka ($99,943, a difference of 0.21%), Immigrants from Asia ($99,933, a difference of 0.22%), Immigrants from Northern Europe ($99,813, a difference of 0.34%), and Immigrants from Sweden ($100,699, a difference of 0.55%).
| Demographics | Rating | Rank | Median Household Income |
| Bolivians | 100.0 /100 | #20 | Exceptional $102,195 |
| Eastern Europeans | 100.0 /100 | #21 | Exceptional $101,781 |
| Asians | 100.0 /100 | #22 | Exceptional $101,681 |
| Immigrants | Bolivia | 100.0 /100 | #23 | Exceptional $101,394 |
| Immigrants | Japan | 100.0 /100 | #24 | Exceptional $100,711 |
| Immigrants | Sweden | 100.0 /100 | #25 | Exceptional $100,699 |
| Immigrants | Belgium | 100.0 /100 | #26 | Exceptional $100,306 |
| Bhutanese | 100.0 /100 | #27 | Exceptional $100,151 |
| Immigrants | Sri Lanka | 100.0 /100 | #28 | Exceptional $99,943 |
| Immigrants | Asia | 100.0 /100 | #29 | Exceptional $99,933 |
| Immigrants | Northern Europe | 100.0 /100 | #30 | Exceptional $99,813 |
| Turks | 100.0 /100 | #31 | Exceptional $99,389 |
| Immigrants | Denmark | 100.0 /100 | #32 | Exceptional $98,510 |
| Chinese | 100.0 /100 | #33 | Exceptional $98,496 |
| Russians | 100.0 /100 | #34 | Exceptional $98,008 |