Somali vs Immigrants from Germany Median Household Income
COMPARE
Somali
Immigrants from Germany
Median Household Income
Median Household Income Comparison
Somalis
Immigrants from Germany
$75,782
MEDIAN HOUSEHOLD INCOME
0.3/ 100
METRIC RATING
272nd/ 347
METRIC RANK
$86,764
MEDIAN HOUSEHOLD INCOME
74.4/ 100
METRIC RATING
154th/ 347
METRIC RANK
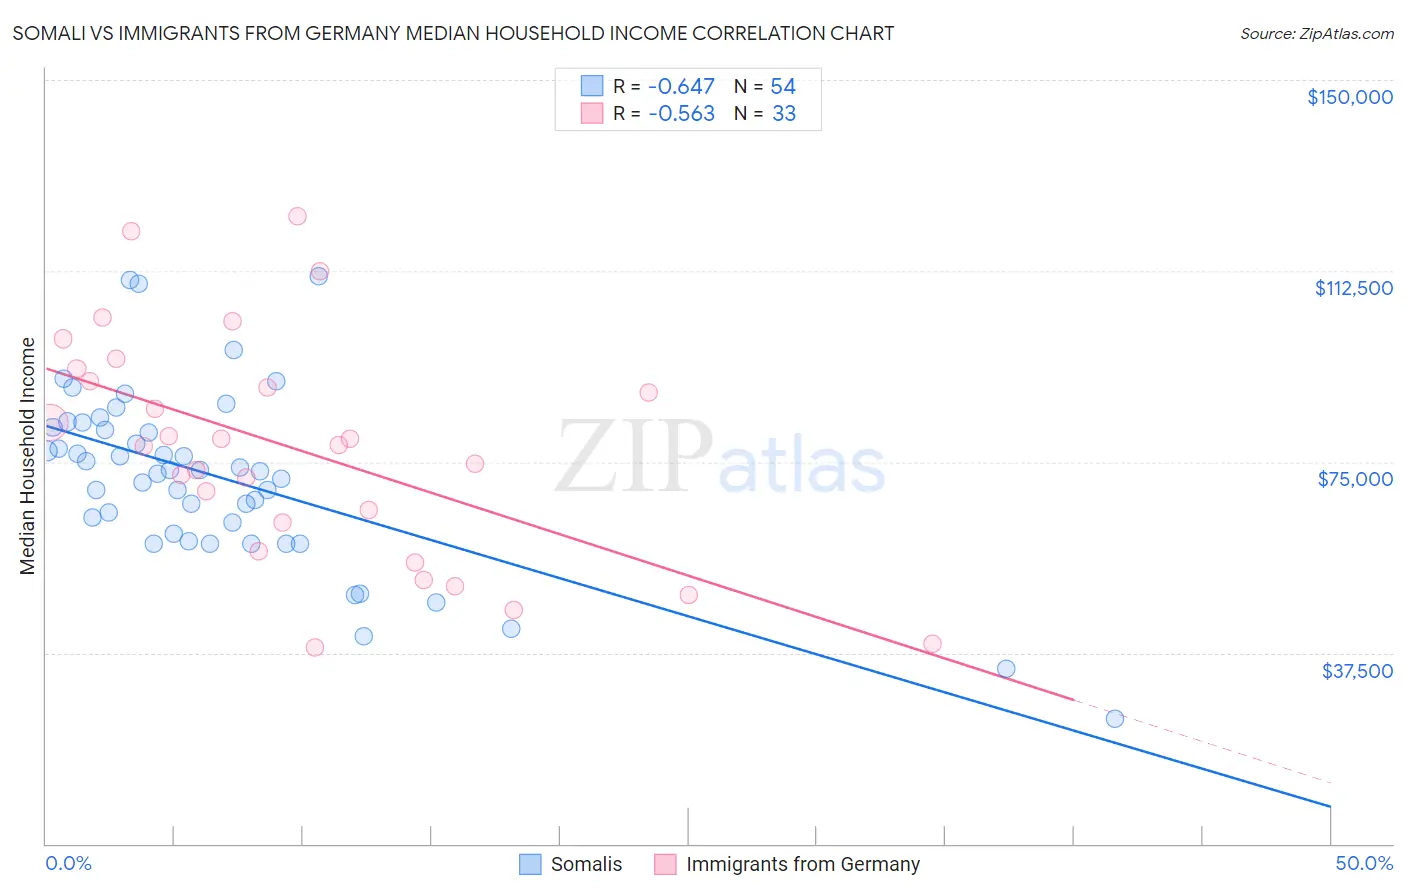
Somali vs Immigrants from Germany Median Household Income Correlation Chart
The statistical analysis conducted on geographies consisting of 99,284,368 people shows a significant negative correlation between the proportion of Somalis and median household income in the United States with a correlation coefficient (R) of -0.647 and weighted average of $75,782. Similarly, the statistical analysis conducted on geographies consisting of 463,670,643 people shows a substantial negative correlation between the proportion of Immigrants from Germany and median household income in the United States with a correlation coefficient (R) of -0.563 and weighted average of $86,764, a difference of 14.5%.
Median Household Income Correlation Summary
| Measurement | Somali | Immigrants from Germany |
| Minimum | $24,660 | $38,452 |
| Maximum | $111,550 | $123,192 |
| Range | $86,890 | $84,740 |
| Mean | $71,854 | $77,580 |
| Median | $73,292 | $78,375 |
| Interquartile 25% (IQ1) | $60,808 | $60,226 |
| Interquartile 75% (IQ3) | $81,847 | $92,055 |
| Interquartile Range (IQR) | $21,039 | $31,829 |
| Standard Deviation (Sample) | $17,515 | $22,106 |
| Standard Deviation (Population) | $17,352 | $21,769 |
Similar Demographics by Median Household Income
Demographics Similar to Somalis by Median Household Income
In terms of median household income, the demographic groups most similar to Somalis are Pennsylvania German ($75,814, a difference of 0.040%), Hmong ($75,839, a difference of 0.080%), Immigrants from Jamaica ($75,851, a difference of 0.090%), Cape Verdean ($75,848, a difference of 0.090%), and German Russian ($75,856, a difference of 0.10%).
| Demographics | Rating | Rank | Median Household Income |
| Immigrants | Belize | 0.3 /100 | #265 | Tragic $75,938 |
| Americans | 0.3 /100 | #266 | Tragic $75,932 |
| German Russians | 0.3 /100 | #267 | Tragic $75,856 |
| Immigrants | Jamaica | 0.3 /100 | #268 | Tragic $75,851 |
| Cape Verdeans | 0.3 /100 | #269 | Tragic $75,848 |
| Hmong | 0.3 /100 | #270 | Tragic $75,839 |
| Pennsylvania Germans | 0.3 /100 | #271 | Tragic $75,814 |
| Somalis | 0.3 /100 | #272 | Tragic $75,782 |
| Liberians | 0.2 /100 | #273 | Tragic $75,667 |
| British West Indians | 0.2 /100 | #274 | Tragic $75,647 |
| Immigrants | Micronesia | 0.2 /100 | #275 | Tragic $75,574 |
| Immigrants | Latin America | 0.2 /100 | #276 | Tragic $75,420 |
| Spanish Americans | 0.2 /100 | #277 | Tragic $75,386 |
| Osage | 0.2 /100 | #278 | Tragic $75,240 |
| Immigrants | Guatemala | 0.2 /100 | #279 | Tragic $75,123 |
Demographics Similar to Immigrants from Germany by Median Household Income
In terms of median household income, the demographic groups most similar to Immigrants from Germany are South American ($86,824, a difference of 0.070%), Immigrants from Saudi Arabia ($86,875, a difference of 0.13%), Carpatho Rusyn ($86,635, a difference of 0.15%), Hungarian ($86,920, a difference of 0.18%), and Basque ($87,001, a difference of 0.27%).
| Demographics | Rating | Rank | Median Household Income |
| South American Indians | 81.8 /100 | #147 | Excellent $87,446 |
| Costa Ricans | 80.0 /100 | #148 | Excellent $87,262 |
| Immigrants | Nepal | 77.7 /100 | #149 | Good $87,046 |
| Basques | 77.2 /100 | #150 | Good $87,001 |
| Hungarians | 76.3 /100 | #151 | Good $86,920 |
| Immigrants | Saudi Arabia | 75.8 /100 | #152 | Good $86,875 |
| South Americans | 75.1 /100 | #153 | Good $86,824 |
| Immigrants | Germany | 74.4 /100 | #154 | Good $86,764 |
| Carpatho Rusyns | 72.8 /100 | #155 | Good $86,635 |
| Immigrants | Albania | 71.5 /100 | #156 | Good $86,534 |
| Samoans | 71.0 /100 | #157 | Good $86,498 |
| Moroccans | 70.6 /100 | #158 | Good $86,468 |
| Immigrants | Uzbekistan | 70.1 /100 | #159 | Good $86,425 |
| Luxembourgers | 70.0 /100 | #160 | Good $86,418 |
| Slavs | 69.7 /100 | #161 | Good $86,398 |