Somali vs Immigrants from Sierra Leone Median Household Income
COMPARE
Somali
Immigrants from Sierra Leone
Median Household Income
Median Household Income Comparison
Somalis
Immigrants from Sierra Leone
$75,782
MEDIAN HOUSEHOLD INCOME
0.3/ 100
METRIC RATING
272nd/ 347
METRIC RANK
$88,498
MEDIAN HOUSEHOLD INCOME
89.9/ 100
METRIC RATING
135th/ 347
METRIC RANK
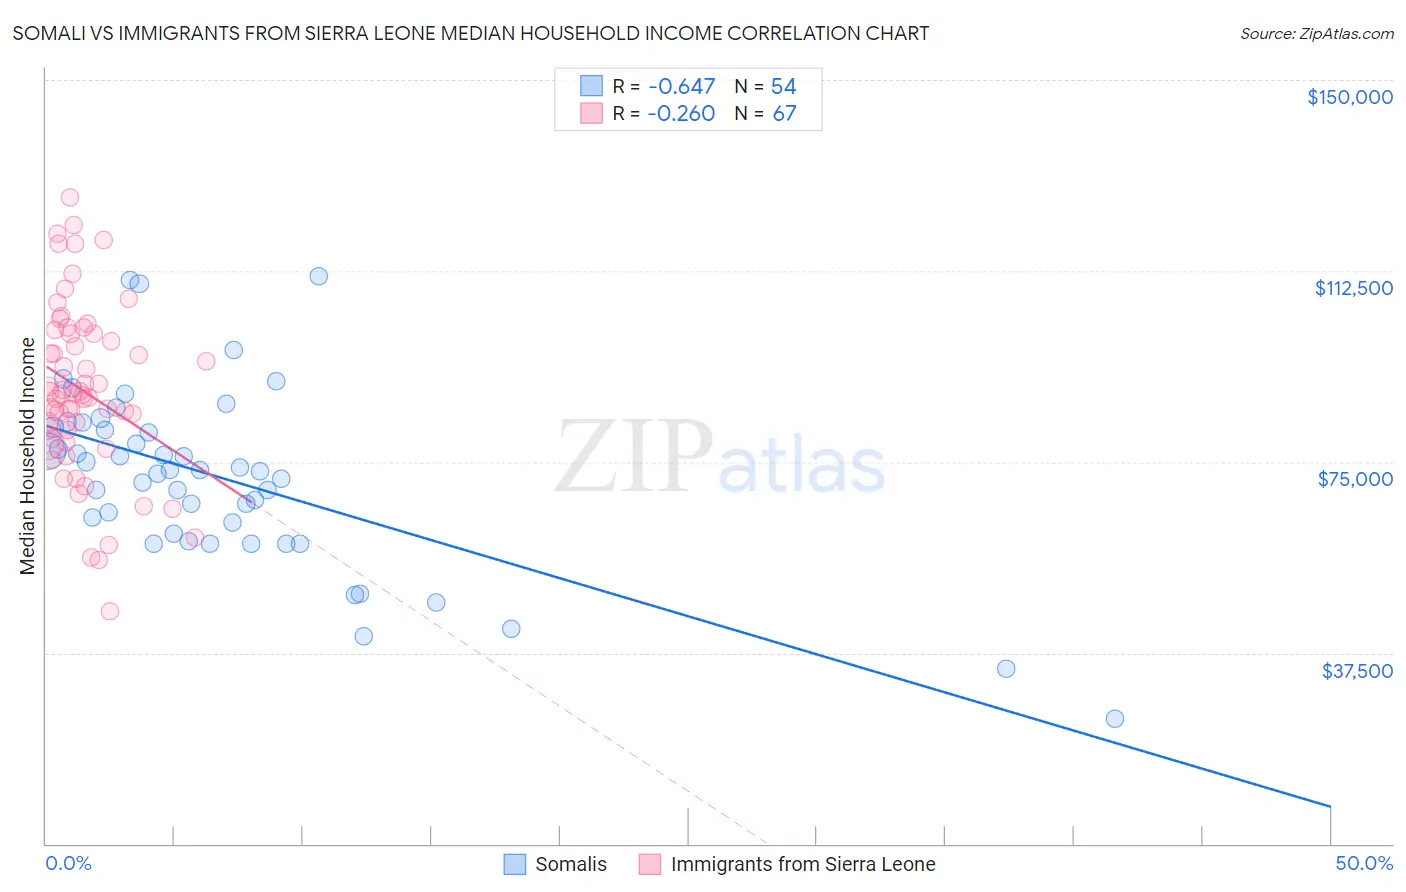
Somali vs Immigrants from Sierra Leone Median Household Income Correlation Chart
The statistical analysis conducted on geographies consisting of 99,284,368 people shows a significant negative correlation between the proportion of Somalis and median household income in the United States with a correlation coefficient (R) of -0.647 and weighted average of $75,782. Similarly, the statistical analysis conducted on geographies consisting of 101,642,850 people shows a weak negative correlation between the proportion of Immigrants from Sierra Leone and median household income in the United States with a correlation coefficient (R) of -0.260 and weighted average of $88,498, a difference of 16.8%.
Median Household Income Correlation Summary
| Measurement | Somali | Immigrants from Sierra Leone |
| Minimum | $24,660 | $45,542 |
| Maximum | $111,550 | $126,910 |
| Range | $86,890 | $81,369 |
| Mean | $71,854 | $89,050 |
| Median | $73,292 | $88,269 |
| Interquartile 25% (IQ1) | $60,808 | $79,610 |
| Interquartile 75% (IQ3) | $81,847 | $100,223 |
| Interquartile Range (IQR) | $21,039 | $20,614 |
| Standard Deviation (Sample) | $17,515 | $16,774 |
| Standard Deviation (Population) | $17,352 | $16,648 |
Similar Demographics by Median Household Income
Demographics Similar to Somalis by Median Household Income
In terms of median household income, the demographic groups most similar to Somalis are Pennsylvania German ($75,814, a difference of 0.040%), Hmong ($75,839, a difference of 0.080%), Immigrants from Jamaica ($75,851, a difference of 0.090%), Cape Verdean ($75,848, a difference of 0.090%), and German Russian ($75,856, a difference of 0.10%).
| Demographics | Rating | Rank | Median Household Income |
| Immigrants | Belize | 0.3 /100 | #265 | Tragic $75,938 |
| Americans | 0.3 /100 | #266 | Tragic $75,932 |
| German Russians | 0.3 /100 | #267 | Tragic $75,856 |
| Immigrants | Jamaica | 0.3 /100 | #268 | Tragic $75,851 |
| Cape Verdeans | 0.3 /100 | #269 | Tragic $75,848 |
| Hmong | 0.3 /100 | #270 | Tragic $75,839 |
| Pennsylvania Germans | 0.3 /100 | #271 | Tragic $75,814 |
| Somalis | 0.3 /100 | #272 | Tragic $75,782 |
| Liberians | 0.2 /100 | #273 | Tragic $75,667 |
| British West Indians | 0.2 /100 | #274 | Tragic $75,647 |
| Immigrants | Micronesia | 0.2 /100 | #275 | Tragic $75,574 |
| Immigrants | Latin America | 0.2 /100 | #276 | Tragic $75,420 |
| Spanish Americans | 0.2 /100 | #277 | Tragic $75,386 |
| Osage | 0.2 /100 | #278 | Tragic $75,240 |
| Immigrants | Guatemala | 0.2 /100 | #279 | Tragic $75,123 |
Demographics Similar to Immigrants from Sierra Leone by Median Household Income
In terms of median household income, the demographic groups most similar to Immigrants from Sierra Leone are Swedish ($88,524, a difference of 0.030%), Polish ($88,472, a difference of 0.030%), Sierra Leonean ($88,463, a difference of 0.040%), Arab ($88,398, a difference of 0.11%), and Immigrants from Chile ($88,388, a difference of 0.12%).
| Demographics | Rating | Rank | Median Household Income |
| Portuguese | 92.3 /100 | #128 | Exceptional $88,976 |
| Brazilians | 92.1 /100 | #129 | Exceptional $88,934 |
| British | 92.0 /100 | #130 | Exceptional $88,914 |
| Immigrants | Syria | 91.4 /100 | #131 | Exceptional $88,792 |
| Europeans | 91.2 /100 | #132 | Exceptional $88,751 |
| Immigrants | Ethiopia | 90.9 /100 | #133 | Exceptional $88,687 |
| Swedes | 90.0 /100 | #134 | Exceptional $88,524 |
| Immigrants | Sierra Leone | 89.9 /100 | #135 | Excellent $88,498 |
| Poles | 89.7 /100 | #136 | Excellent $88,472 |
| Sierra Leoneans | 89.6 /100 | #137 | Excellent $88,463 |
| Arabs | 89.2 /100 | #138 | Excellent $88,398 |
| Immigrants | Chile | 89.2 /100 | #139 | Excellent $88,388 |
| Lebanese | 87.2 /100 | #140 | Excellent $88,091 |
| Immigrants | Morocco | 86.0 /100 | #141 | Excellent $87,930 |
| Canadians | 84.7 /100 | #142 | Excellent $87,769 |