Somali vs Immigrants from Liberia Median Household Income
COMPARE
Somali
Immigrants from Liberia
Median Household Income
Median Household Income Comparison
Somalis
Immigrants from Liberia
$75,782
MEDIAN HOUSEHOLD INCOME
0.3/ 100
METRIC RATING
272nd/ 347
METRIC RANK
$74,896
MEDIAN HOUSEHOLD INCOME
0.1/ 100
METRIC RATING
281st/ 347
METRIC RANK
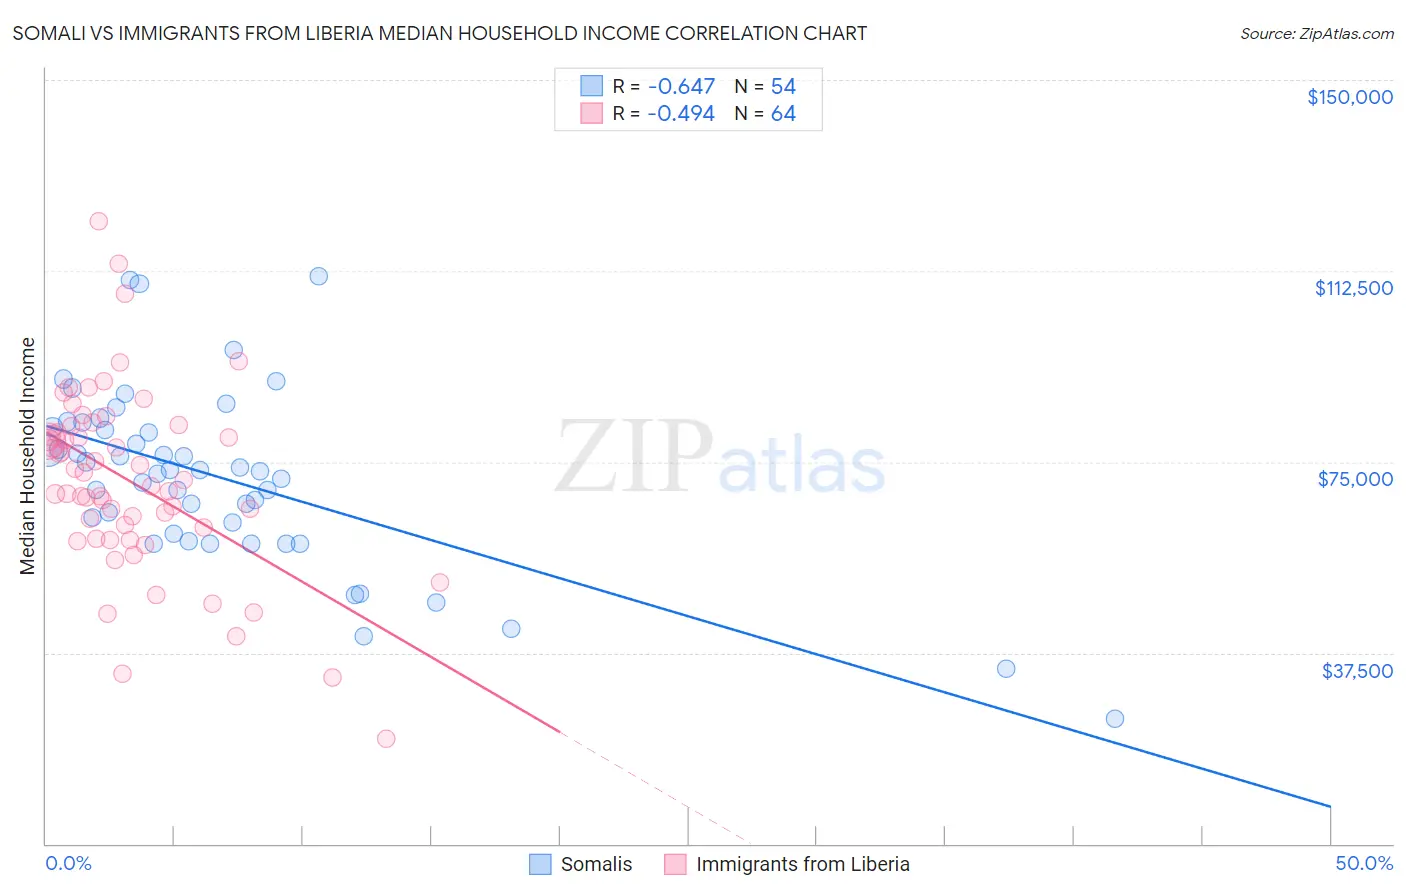
Somali vs Immigrants from Liberia Median Household Income Correlation Chart
The statistical analysis conducted on geographies consisting of 99,284,368 people shows a significant negative correlation between the proportion of Somalis and median household income in the United States with a correlation coefficient (R) of -0.647 and weighted average of $75,782. Similarly, the statistical analysis conducted on geographies consisting of 135,245,010 people shows a moderate negative correlation between the proportion of Immigrants from Liberia and median household income in the United States with a correlation coefficient (R) of -0.494 and weighted average of $74,896, a difference of 1.2%.
Median Household Income Correlation Summary
| Measurement | Somali | Immigrants from Liberia |
| Minimum | $24,660 | $20,699 |
| Maximum | $111,550 | $122,146 |
| Range | $86,890 | $101,447 |
| Mean | $71,854 | $71,180 |
| Median | $73,292 | $70,898 |
| Interquartile 25% (IQ1) | $60,808 | $61,014 |
| Interquartile 75% (IQ3) | $81,847 | $81,401 |
| Interquartile Range (IQR) | $21,039 | $20,387 |
| Standard Deviation (Sample) | $17,515 | $18,219 |
| Standard Deviation (Population) | $17,352 | $18,076 |
Demographics Similar to Somalis and Immigrants from Liberia by Median Household Income
In terms of median household income, the demographic groups most similar to Somalis are Pennsylvania German ($75,814, a difference of 0.040%), Hmong ($75,839, a difference of 0.080%), Immigrants from Jamaica ($75,851, a difference of 0.090%), Cape Verdean ($75,848, a difference of 0.090%), and German Russian ($75,856, a difference of 0.10%). Similarly, the demographic groups most similar to Immigrants from Liberia are Central American Indian ($74,847, a difference of 0.070%), Senegalese ($74,999, a difference of 0.14%), Cree ($74,685, a difference of 0.28%), Immigrants from Guatemala ($75,123, a difference of 0.30%), and Yaqui ($74,596, a difference of 0.40%).
| Demographics | Rating | Rank | Median Household Income |
| Americans | 0.3 /100 | #266 | Tragic $75,932 |
| German Russians | 0.3 /100 | #267 | Tragic $75,856 |
| Immigrants | Jamaica | 0.3 /100 | #268 | Tragic $75,851 |
| Cape Verdeans | 0.3 /100 | #269 | Tragic $75,848 |
| Hmong | 0.3 /100 | #270 | Tragic $75,839 |
| Pennsylvania Germans | 0.3 /100 | #271 | Tragic $75,814 |
| Somalis | 0.3 /100 | #272 | Tragic $75,782 |
| Liberians | 0.2 /100 | #273 | Tragic $75,667 |
| British West Indians | 0.2 /100 | #274 | Tragic $75,647 |
| Immigrants | Micronesia | 0.2 /100 | #275 | Tragic $75,574 |
| Immigrants | Latin America | 0.2 /100 | #276 | Tragic $75,420 |
| Spanish Americans | 0.2 /100 | #277 | Tragic $75,386 |
| Osage | 0.2 /100 | #278 | Tragic $75,240 |
| Immigrants | Guatemala | 0.2 /100 | #279 | Tragic $75,123 |
| Senegalese | 0.2 /100 | #280 | Tragic $74,999 |
| Immigrants | Liberia | 0.1 /100 | #281 | Tragic $74,896 |
| Central American Indians | 0.1 /100 | #282 | Tragic $74,847 |
| Cree | 0.1 /100 | #283 | Tragic $74,685 |
| Yaqui | 0.1 /100 | #284 | Tragic $74,596 |
| Mexicans | 0.1 /100 | #285 | Tragic $74,399 |
| Immigrants | Somalia | 0.1 /100 | #286 | Tragic $74,300 |