Northern European vs Bhutanese Median Household Income
COMPARE
Northern European
Bhutanese
Median Household Income
Median Household Income Comparison
Northern Europeans
Bhutanese
$90,446
MEDIAN HOUSEHOLD INCOME
96.9/ 100
METRIC RATING
112th/ 347
METRIC RANK
$100,151
MEDIAN HOUSEHOLD INCOME
100.0/ 100
METRIC RATING
27th/ 347
METRIC RANK
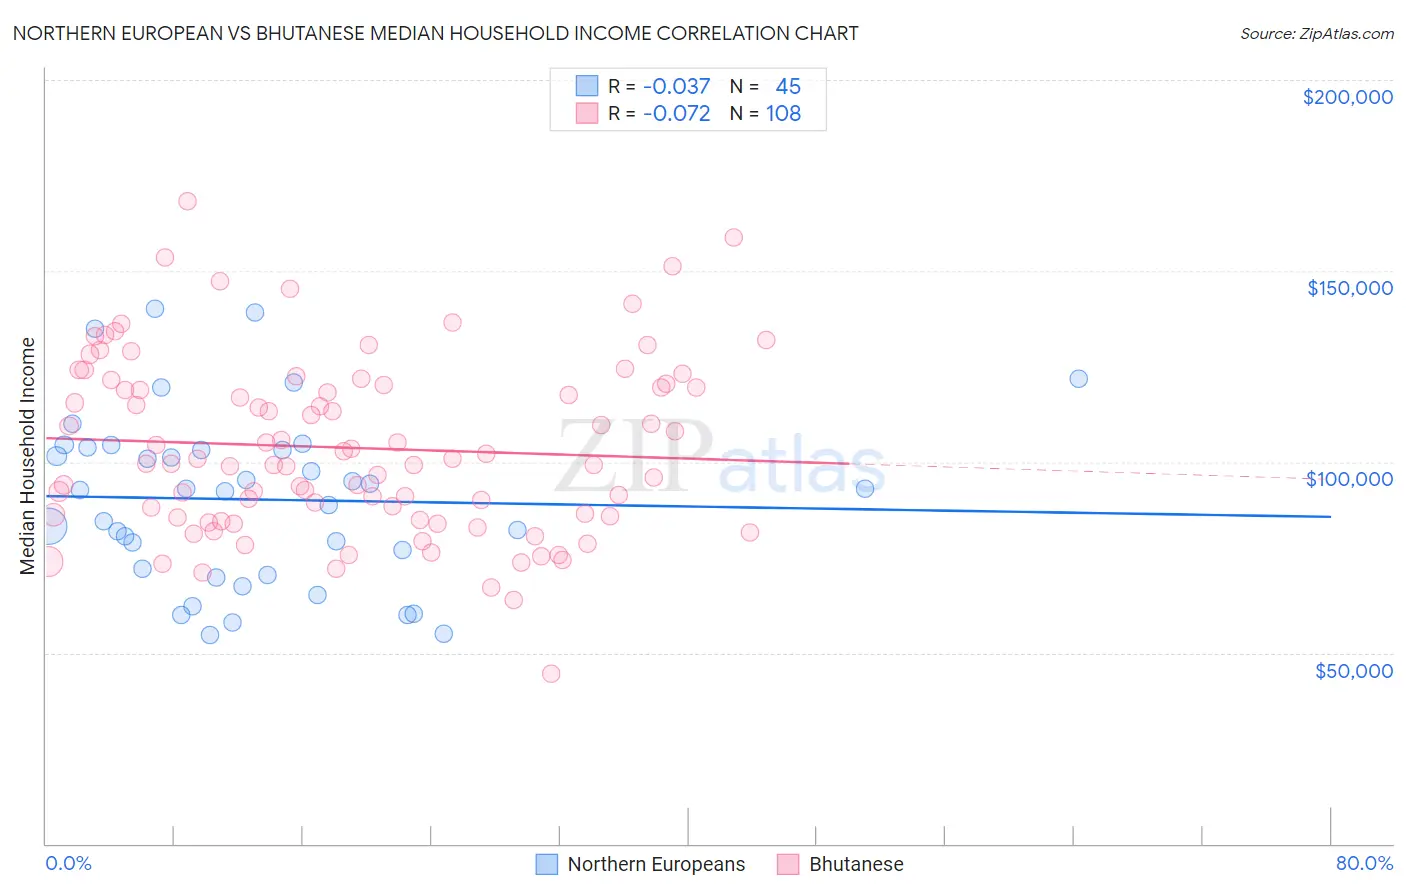
Northern European vs Bhutanese Median Household Income Correlation Chart
The statistical analysis conducted on geographies consisting of 405,886,183 people shows no correlation between the proportion of Northern Europeans and median household income in the United States with a correlation coefficient (R) of -0.037 and weighted average of $90,446. Similarly, the statistical analysis conducted on geographies consisting of 455,036,820 people shows a slight negative correlation between the proportion of Bhutanese and median household income in the United States with a correlation coefficient (R) of -0.072 and weighted average of $100,151, a difference of 10.7%.
Median Household Income Correlation Summary
| Measurement | Northern European | Bhutanese |
| Minimum | $54,809 | $44,611 |
| Maximum | $140,176 | $168,247 |
| Range | $85,367 | $123,636 |
| Mean | $90,148 | $103,677 |
| Median | $92,627 | $100,131 |
| Interquartile 25% (IQ1) | $71,323 | $85,552 |
| Interquartile 75% (IQ3) | $103,516 | $119,777 |
| Interquartile Range (IQR) | $32,192 | $34,225 |
| Standard Deviation (Sample) | $22,235 | $23,044 |
| Standard Deviation (Population) | $21,987 | $22,937 |
Similar Demographics by Median Household Income
Demographics Similar to Northern Europeans by Median Household Income
In terms of median household income, the demographic groups most similar to Northern Europeans are Immigrants from Poland ($90,549, a difference of 0.11%), Palestinian ($90,574, a difference of 0.14%), Chilean ($90,605, a difference of 0.18%), Zimbabwean ($90,618, a difference of 0.19%), and Peruvian ($90,261, a difference of 0.20%).
| Demographics | Rating | Rank | Median Household Income |
| Immigrants | Brazil | 97.7 /100 | #105 | Exceptional $90,907 |
| Macedonians | 97.4 /100 | #106 | Exceptional $90,761 |
| Croatians | 97.3 /100 | #107 | Exceptional $90,685 |
| Zimbabweans | 97.2 /100 | #108 | Exceptional $90,618 |
| Chileans | 97.2 /100 | #109 | Exceptional $90,605 |
| Palestinians | 97.1 /100 | #110 | Exceptional $90,574 |
| Immigrants | Poland | 97.1 /100 | #111 | Exceptional $90,549 |
| Northern Europeans | 96.9 /100 | #112 | Exceptional $90,446 |
| Peruvians | 96.5 /100 | #113 | Exceptional $90,261 |
| Immigrants | Northern Africa | 95.9 /100 | #114 | Exceptional $90,026 |
| Immigrants | Western Asia | 95.9 /100 | #115 | Exceptional $90,005 |
| Native Hawaiians | 95.7 /100 | #116 | Exceptional $89,919 |
| Taiwanese | 95.6 /100 | #117 | Exceptional $89,900 |
| Syrians | 95.4 /100 | #118 | Exceptional $89,830 |
| Albanians | 95.2 /100 | #119 | Exceptional $89,744 |
Demographics Similar to Bhutanese by Median Household Income
In terms of median household income, the demographic groups most similar to Bhutanese are Immigrants from Belgium ($100,306, a difference of 0.15%), Immigrants from Sri Lanka ($99,943, a difference of 0.21%), Immigrants from Asia ($99,933, a difference of 0.22%), Immigrants from Northern Europe ($99,813, a difference of 0.34%), and Immigrants from Sweden ($100,699, a difference of 0.55%).
| Demographics | Rating | Rank | Median Household Income |
| Bolivians | 100.0 /100 | #20 | Exceptional $102,195 |
| Eastern Europeans | 100.0 /100 | #21 | Exceptional $101,781 |
| Asians | 100.0 /100 | #22 | Exceptional $101,681 |
| Immigrants | Bolivia | 100.0 /100 | #23 | Exceptional $101,394 |
| Immigrants | Japan | 100.0 /100 | #24 | Exceptional $100,711 |
| Immigrants | Sweden | 100.0 /100 | #25 | Exceptional $100,699 |
| Immigrants | Belgium | 100.0 /100 | #26 | Exceptional $100,306 |
| Bhutanese | 100.0 /100 | #27 | Exceptional $100,151 |
| Immigrants | Sri Lanka | 100.0 /100 | #28 | Exceptional $99,943 |
| Immigrants | Asia | 100.0 /100 | #29 | Exceptional $99,933 |
| Immigrants | Northern Europe | 100.0 /100 | #30 | Exceptional $99,813 |
| Turks | 100.0 /100 | #31 | Exceptional $99,389 |
| Immigrants | Denmark | 100.0 /100 | #32 | Exceptional $98,510 |
| Chinese | 100.0 /100 | #33 | Exceptional $98,496 |
| Russians | 100.0 /100 | #34 | Exceptional $98,008 |