Somali vs Native Hawaiian Median Household Income
COMPARE
Somali
Native Hawaiian
Median Household Income
Median Household Income Comparison
Somalis
Native Hawaiians
$75,782
MEDIAN HOUSEHOLD INCOME
0.3/ 100
METRIC RATING
272nd/ 347
METRIC RANK
$89,919
MEDIAN HOUSEHOLD INCOME
95.7/ 100
METRIC RATING
116th/ 347
METRIC RANK
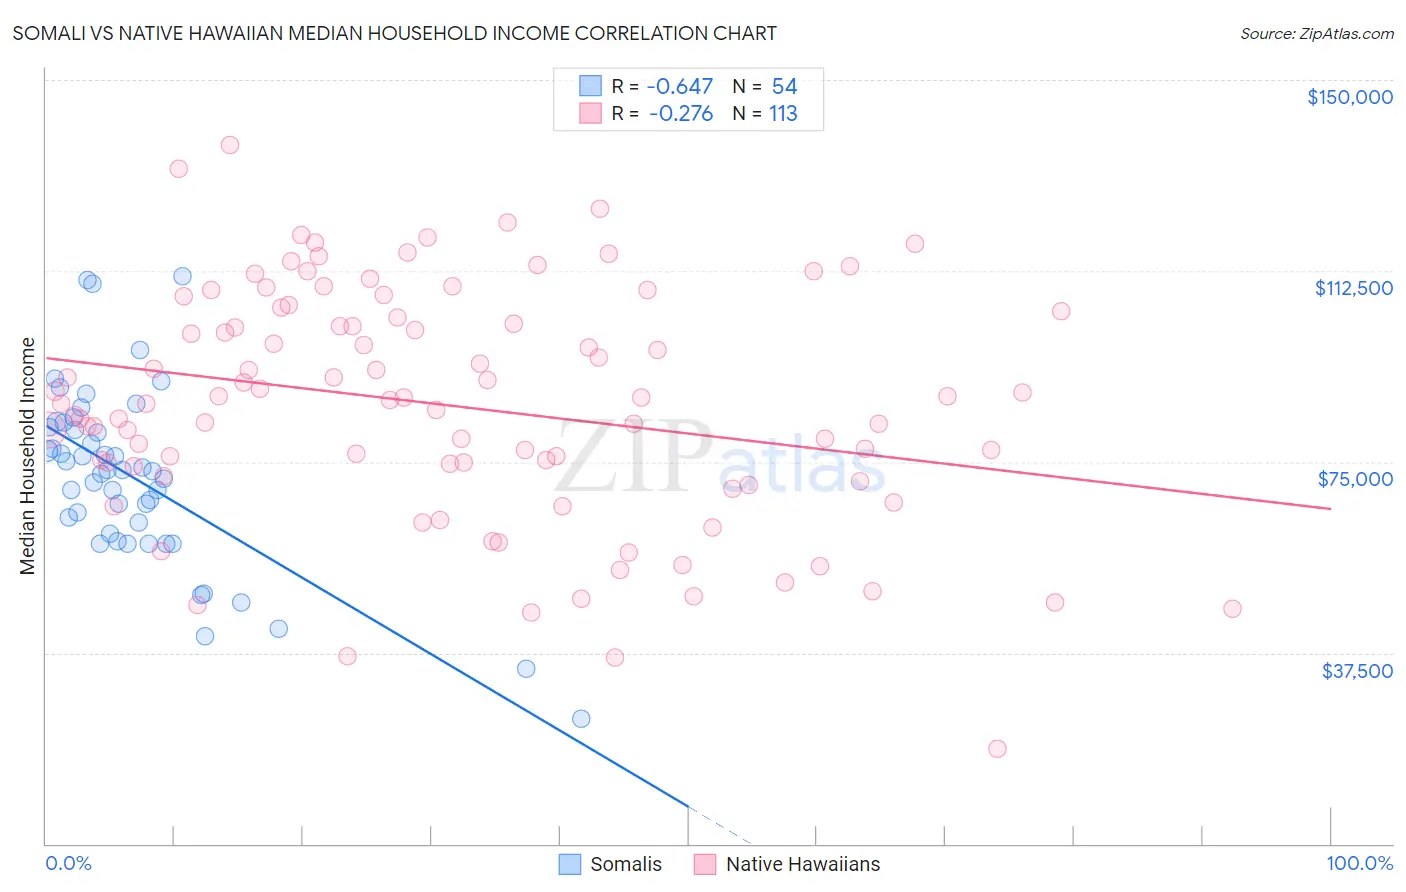
Somali vs Native Hawaiian Median Household Income Correlation Chart
The statistical analysis conducted on geographies consisting of 99,284,368 people shows a significant negative correlation between the proportion of Somalis and median household income in the United States with a correlation coefficient (R) of -0.647 and weighted average of $75,782. Similarly, the statistical analysis conducted on geographies consisting of 331,802,706 people shows a weak negative correlation between the proportion of Native Hawaiians and median household income in the United States with a correlation coefficient (R) of -0.276 and weighted average of $89,919, a difference of 18.7%.
Median Household Income Correlation Summary
| Measurement | Somali | Native Hawaiian |
| Minimum | $24,660 | $18,739 |
| Maximum | $111,550 | $137,302 |
| Range | $86,890 | $118,563 |
| Mean | $71,854 | $86,036 |
| Median | $73,292 | $87,089 |
| Interquartile 25% (IQ1) | $60,808 | $73,233 |
| Interquartile 75% (IQ3) | $81,847 | $104,035 |
| Interquartile Range (IQR) | $21,039 | $30,802 |
| Standard Deviation (Sample) | $17,515 | $23,037 |
| Standard Deviation (Population) | $17,352 | $22,935 |
Similar Demographics by Median Household Income
Demographics Similar to Somalis by Median Household Income
In terms of median household income, the demographic groups most similar to Somalis are Pennsylvania German ($75,814, a difference of 0.040%), Hmong ($75,839, a difference of 0.080%), Immigrants from Jamaica ($75,851, a difference of 0.090%), Cape Verdean ($75,848, a difference of 0.090%), and German Russian ($75,856, a difference of 0.10%).
| Demographics | Rating | Rank | Median Household Income |
| Immigrants | Belize | 0.3 /100 | #265 | Tragic $75,938 |
| Americans | 0.3 /100 | #266 | Tragic $75,932 |
| German Russians | 0.3 /100 | #267 | Tragic $75,856 |
| Immigrants | Jamaica | 0.3 /100 | #268 | Tragic $75,851 |
| Cape Verdeans | 0.3 /100 | #269 | Tragic $75,848 |
| Hmong | 0.3 /100 | #270 | Tragic $75,839 |
| Pennsylvania Germans | 0.3 /100 | #271 | Tragic $75,814 |
| Somalis | 0.3 /100 | #272 | Tragic $75,782 |
| Liberians | 0.2 /100 | #273 | Tragic $75,667 |
| British West Indians | 0.2 /100 | #274 | Tragic $75,647 |
| Immigrants | Micronesia | 0.2 /100 | #275 | Tragic $75,574 |
| Immigrants | Latin America | 0.2 /100 | #276 | Tragic $75,420 |
| Spanish Americans | 0.2 /100 | #277 | Tragic $75,386 |
| Osage | 0.2 /100 | #278 | Tragic $75,240 |
| Immigrants | Guatemala | 0.2 /100 | #279 | Tragic $75,123 |
Demographics Similar to Native Hawaiians by Median Household Income
In terms of median household income, the demographic groups most similar to Native Hawaiians are Taiwanese ($89,900, a difference of 0.020%), Immigrants from Western Asia ($90,005, a difference of 0.10%), Syrian ($89,830, a difference of 0.10%), Immigrants from Northern Africa ($90,026, a difference of 0.12%), and Albanian ($89,744, a difference of 0.20%).
| Demographics | Rating | Rank | Median Household Income |
| Chileans | 97.2 /100 | #109 | Exceptional $90,605 |
| Palestinians | 97.1 /100 | #110 | Exceptional $90,574 |
| Immigrants | Poland | 97.1 /100 | #111 | Exceptional $90,549 |
| Northern Europeans | 96.9 /100 | #112 | Exceptional $90,446 |
| Peruvians | 96.5 /100 | #113 | Exceptional $90,261 |
| Immigrants | Northern Africa | 95.9 /100 | #114 | Exceptional $90,026 |
| Immigrants | Western Asia | 95.9 /100 | #115 | Exceptional $90,005 |
| Native Hawaiians | 95.7 /100 | #116 | Exceptional $89,919 |
| Taiwanese | 95.6 /100 | #117 | Exceptional $89,900 |
| Syrians | 95.4 /100 | #118 | Exceptional $89,830 |
| Albanians | 95.2 /100 | #119 | Exceptional $89,744 |
| Immigrants | North Macedonia | 95.2 /100 | #120 | Exceptional $89,741 |
| Ethiopians | 94.9 /100 | #121 | Exceptional $89,640 |
| Pakistanis | 94.8 /100 | #122 | Exceptional $89,638 |
| Immigrants | Zimbabwe | 94.4 /100 | #123 | Exceptional $89,496 |