Macedonian vs Bhutanese Median Household Income
COMPARE
Macedonian
Bhutanese
Median Household Income
Median Household Income Comparison
Macedonians
Bhutanese
$90,761
MEDIAN HOUSEHOLD INCOME
97.4/ 100
METRIC RATING
106th/ 347
METRIC RANK
$100,151
MEDIAN HOUSEHOLD INCOME
100.0/ 100
METRIC RATING
27th/ 347
METRIC RANK
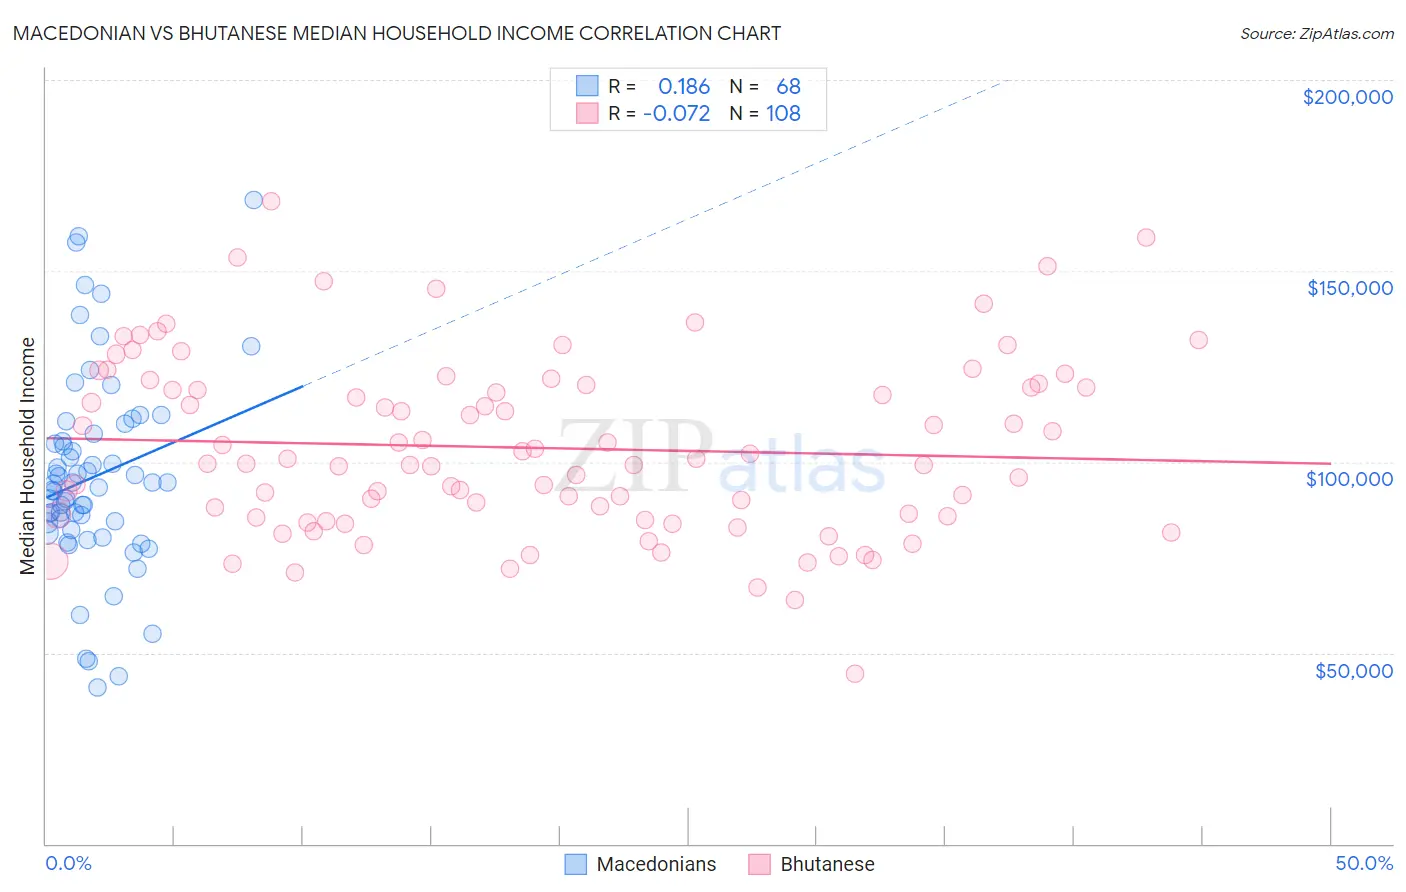
Macedonian vs Bhutanese Median Household Income Correlation Chart
The statistical analysis conducted on geographies consisting of 132,580,342 people shows a poor positive correlation between the proportion of Macedonians and median household income in the United States with a correlation coefficient (R) of 0.186 and weighted average of $90,761. Similarly, the statistical analysis conducted on geographies consisting of 455,036,820 people shows a slight negative correlation between the proportion of Bhutanese and median household income in the United States with a correlation coefficient (R) of -0.072 and weighted average of $100,151, a difference of 10.3%.
Median Household Income Correlation Summary
| Measurement | Macedonian | Bhutanese |
| Minimum | $40,833 | $44,611 |
| Maximum | $168,448 | $168,247 |
| Range | $127,615 | $123,636 |
| Mean | $96,021 | $103,677 |
| Median | $93,863 | $100,131 |
| Interquartile 25% (IQ1) | $83,085 | $85,552 |
| Interquartile 75% (IQ3) | $106,377 | $119,777 |
| Interquartile Range (IQR) | $23,292 | $34,225 |
| Standard Deviation (Sample) | $25,740 | $23,044 |
| Standard Deviation (Population) | $25,550 | $22,937 |
Similar Demographics by Median Household Income
Demographics Similar to Macedonians by Median Household Income
In terms of median household income, the demographic groups most similar to Macedonians are Croatian ($90,685, a difference of 0.080%), Immigrants from Brazil ($90,907, a difference of 0.16%), Zimbabwean ($90,618, a difference of 0.16%), Chilean ($90,605, a difference of 0.17%), and Palestinian ($90,574, a difference of 0.21%).
| Demographics | Rating | Rank | Median Household Income |
| Immigrants | South Eastern Asia | 98.4 /100 | #99 | Exceptional $91,541 |
| Ukrainians | 98.3 /100 | #100 | Exceptional $91,456 |
| Immigrants | Moldova | 98.3 /100 | #101 | Exceptional $91,446 |
| Austrians | 98.2 /100 | #102 | Exceptional $91,339 |
| Immigrants | Ukraine | 98.0 /100 | #103 | Exceptional $91,124 |
| Immigrants | Kazakhstan | 97.8 /100 | #104 | Exceptional $91,015 |
| Immigrants | Brazil | 97.7 /100 | #105 | Exceptional $90,907 |
| Macedonians | 97.4 /100 | #106 | Exceptional $90,761 |
| Croatians | 97.3 /100 | #107 | Exceptional $90,685 |
| Zimbabweans | 97.2 /100 | #108 | Exceptional $90,618 |
| Chileans | 97.2 /100 | #109 | Exceptional $90,605 |
| Palestinians | 97.1 /100 | #110 | Exceptional $90,574 |
| Immigrants | Poland | 97.1 /100 | #111 | Exceptional $90,549 |
| Northern Europeans | 96.9 /100 | #112 | Exceptional $90,446 |
| Peruvians | 96.5 /100 | #113 | Exceptional $90,261 |
Demographics Similar to Bhutanese by Median Household Income
In terms of median household income, the demographic groups most similar to Bhutanese are Immigrants from Belgium ($100,306, a difference of 0.15%), Immigrants from Sri Lanka ($99,943, a difference of 0.21%), Immigrants from Asia ($99,933, a difference of 0.22%), Immigrants from Northern Europe ($99,813, a difference of 0.34%), and Immigrants from Sweden ($100,699, a difference of 0.55%).
| Demographics | Rating | Rank | Median Household Income |
| Bolivians | 100.0 /100 | #20 | Exceptional $102,195 |
| Eastern Europeans | 100.0 /100 | #21 | Exceptional $101,781 |
| Asians | 100.0 /100 | #22 | Exceptional $101,681 |
| Immigrants | Bolivia | 100.0 /100 | #23 | Exceptional $101,394 |
| Immigrants | Japan | 100.0 /100 | #24 | Exceptional $100,711 |
| Immigrants | Sweden | 100.0 /100 | #25 | Exceptional $100,699 |
| Immigrants | Belgium | 100.0 /100 | #26 | Exceptional $100,306 |
| Bhutanese | 100.0 /100 | #27 | Exceptional $100,151 |
| Immigrants | Sri Lanka | 100.0 /100 | #28 | Exceptional $99,943 |
| Immigrants | Asia | 100.0 /100 | #29 | Exceptional $99,933 |
| Immigrants | Northern Europe | 100.0 /100 | #30 | Exceptional $99,813 |
| Turks | 100.0 /100 | #31 | Exceptional $99,389 |
| Immigrants | Denmark | 100.0 /100 | #32 | Exceptional $98,510 |
| Chinese | 100.0 /100 | #33 | Exceptional $98,496 |
| Russians | 100.0 /100 | #34 | Exceptional $98,008 |