Chinese vs Osage Median Male Earnings
COMPARE
Chinese
Osage
Median Male Earnings
Median Male Earnings Comparison
Chinese
Osage
$56,872
MEDIAN MALE EARNINGS
91.1/ 100
METRIC RATING
126th/ 347
METRIC RANK
$50,292
MEDIAN MALE EARNINGS
1.6/ 100
METRIC RATING
250th/ 347
METRIC RANK
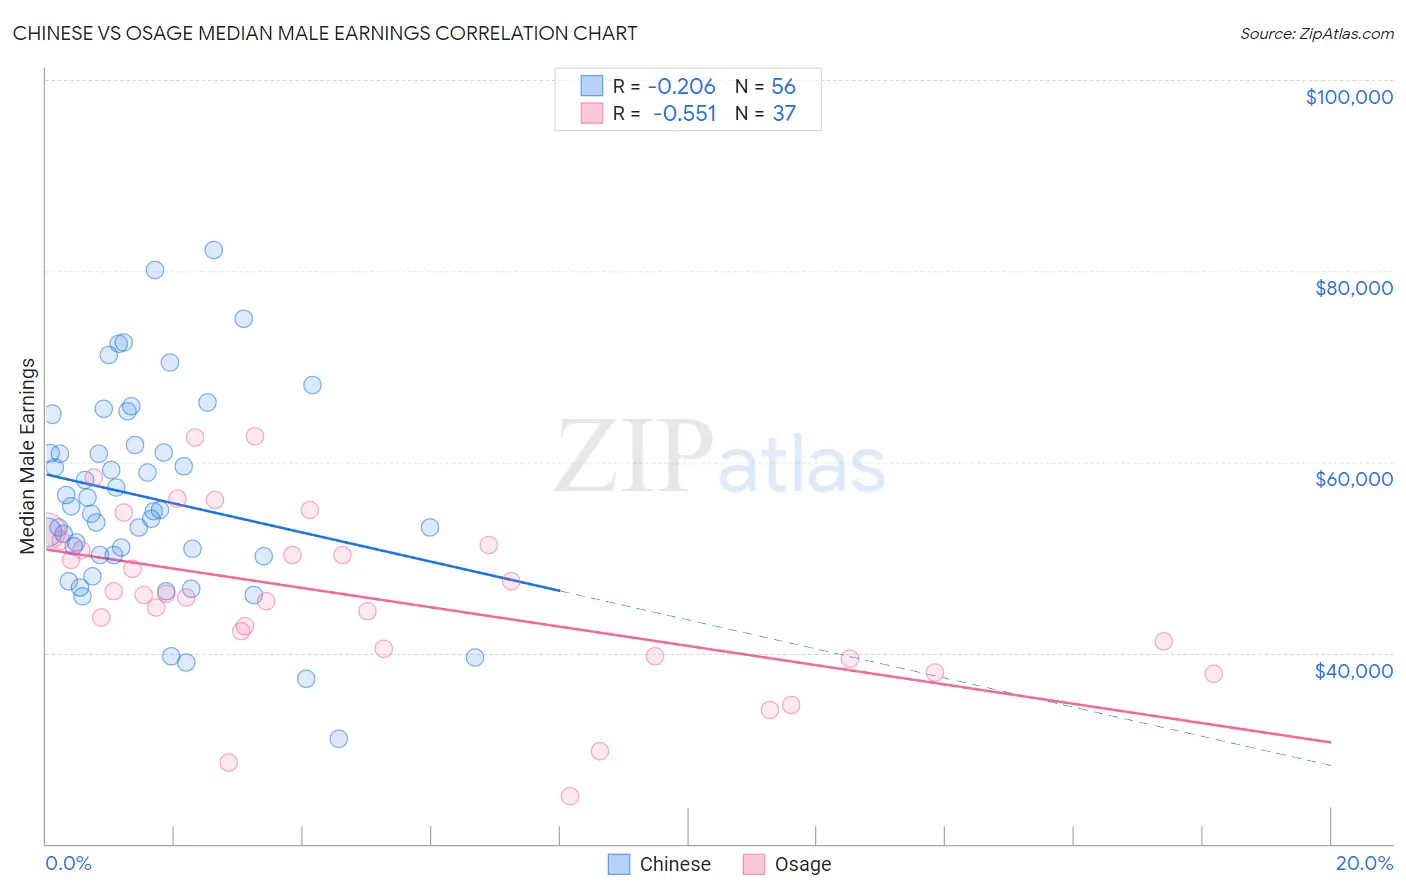
Chinese vs Osage Median Male Earnings Correlation Chart
The statistical analysis conducted on geographies consisting of 64,807,348 people shows a weak negative correlation between the proportion of Chinese and median male earnings in the United States with a correlation coefficient (R) of -0.206 and weighted average of $56,872. Similarly, the statistical analysis conducted on geographies consisting of 91,793,042 people shows a substantial negative correlation between the proportion of Osage and median male earnings in the United States with a correlation coefficient (R) of -0.551 and weighted average of $50,292, a difference of 13.1%.
Median Male Earnings Correlation Summary
| Measurement | Chinese | Osage |
| Minimum | $31,000 | $24,954 |
| Maximum | $82,197 | $62,626 |
| Range | $51,197 | $37,672 |
| Mean | $56,277 | $45,789 |
| Median | $54,905 | $46,052 |
| Interquartile 25% (IQ1) | $50,221 | $40,033 |
| Interquartile 75% (IQ3) | $61,384 | $51,519 |
| Interquartile Range (IQR) | $11,163 | $11,486 |
| Standard Deviation (Sample) | $10,489 | $8,890 |
| Standard Deviation (Population) | $10,395 | $8,769 |
Similar Demographics by Median Male Earnings
Demographics Similar to Chinese by Median Male Earnings
In terms of median male earnings, the demographic groups most similar to Chinese are Brazilian ($56,837, a difference of 0.060%), Immigrants from Syria ($56,830, a difference of 0.070%), Immigrants from Morocco ($56,958, a difference of 0.15%), Chilean ($56,973, a difference of 0.18%), and Pakistani ($56,719, a difference of 0.27%).
| Demographics | Rating | Rank | Median Male Earnings |
| Arabs | 94.0 /100 | #119 | Exceptional $57,298 |
| Canadians | 93.9 /100 | #120 | Exceptional $57,286 |
| Immigrants | Albania | 93.3 /100 | #121 | Exceptional $57,179 |
| Immigrants | Jordan | 93.1 /100 | #122 | Exceptional $57,145 |
| Slovenes | 93.1 /100 | #123 | Exceptional $57,145 |
| Chileans | 91.9 /100 | #124 | Exceptional $56,973 |
| Immigrants | Morocco | 91.8 /100 | #125 | Exceptional $56,958 |
| Chinese | 91.1 /100 | #126 | Exceptional $56,872 |
| Brazilians | 90.9 /100 | #127 | Exceptional $56,837 |
| Immigrants | Syria | 90.8 /100 | #128 | Exceptional $56,830 |
| Pakistanis | 89.9 /100 | #129 | Excellent $56,719 |
| Koreans | 89.4 /100 | #130 | Excellent $56,672 |
| Portuguese | 89.4 /100 | #131 | Excellent $56,663 |
| Czechs | 88.2 /100 | #132 | Excellent $56,546 |
| Immigrants | Germany | 88.2 /100 | #133 | Excellent $56,542 |
Demographics Similar to Osage by Median Male Earnings
In terms of median male earnings, the demographic groups most similar to Osage are Immigrants from Burma/Myanmar ($50,298, a difference of 0.010%), Immigrants from Grenada ($50,279, a difference of 0.020%), Immigrants from Guyana ($50,321, a difference of 0.060%), Subsaharan African ($50,408, a difference of 0.23%), and Immigrants from Ecuador ($50,474, a difference of 0.36%).
| Demographics | Rating | Rank | Median Male Earnings |
| French American Indians | 2.2 /100 | #243 | Tragic $50,611 |
| Houma | 2.0 /100 | #244 | Tragic $50,547 |
| Hawaiians | 1.9 /100 | #245 | Tragic $50,488 |
| Immigrants | Ecuador | 1.9 /100 | #246 | Tragic $50,474 |
| Sub-Saharan Africans | 1.8 /100 | #247 | Tragic $50,408 |
| Immigrants | Guyana | 1.6 /100 | #248 | Tragic $50,321 |
| Immigrants | Burma/Myanmar | 1.6 /100 | #249 | Tragic $50,298 |
| Osage | 1.6 /100 | #250 | Tragic $50,292 |
| Immigrants | Grenada | 1.6 /100 | #251 | Tragic $50,279 |
| Immigrants | Cabo Verde | 1.2 /100 | #252 | Tragic $50,009 |
| German Russians | 1.1 /100 | #253 | Tragic $49,924 |
| Senegalese | 1.0 /100 | #254 | Tragic $49,774 |
| Alaskan Athabascans | 0.9 /100 | #255 | Tragic $49,748 |
| Alaska Natives | 0.9 /100 | #256 | Tragic $49,711 |
| British West Indians | 0.8 /100 | #257 | Tragic $49,636 |