Chinese vs Immigrants from Spain Median Male Earnings
COMPARE
Chinese
Immigrants from Spain
Median Male Earnings
Median Male Earnings Comparison
Chinese
Immigrants from Spain
$56,872
MEDIAN MALE EARNINGS
91.1/ 100
METRIC RATING
126th/ 347
METRIC RANK
$60,750
MEDIAN MALE EARNINGS
99.8/ 100
METRIC RATING
67th/ 347
METRIC RANK
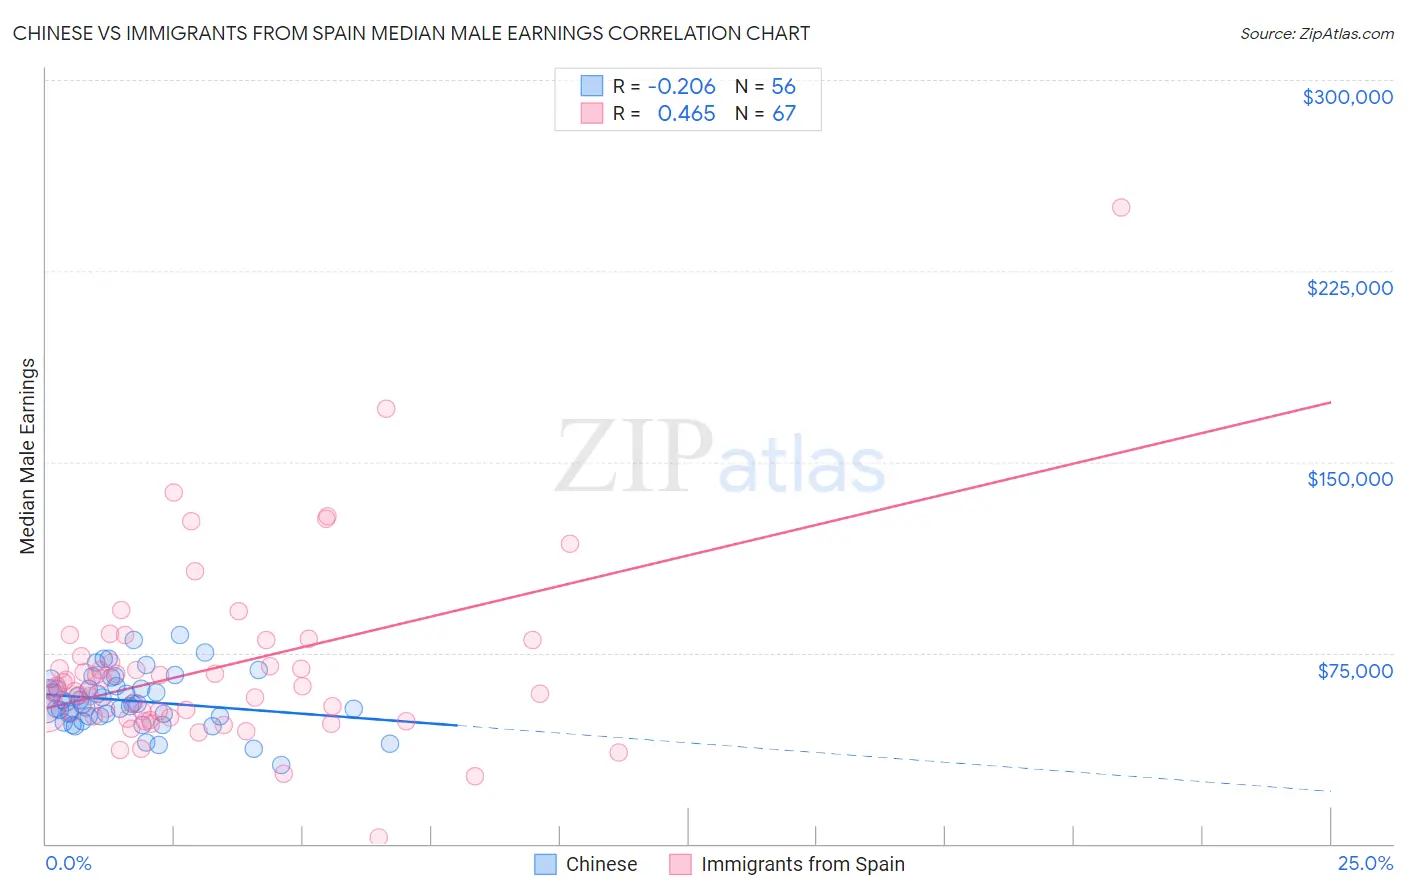
Chinese vs Immigrants from Spain Median Male Earnings Correlation Chart
The statistical analysis conducted on geographies consisting of 64,807,348 people shows a weak negative correlation between the proportion of Chinese and median male earnings in the United States with a correlation coefficient (R) of -0.206 and weighted average of $56,872. Similarly, the statistical analysis conducted on geographies consisting of 239,649,237 people shows a moderate positive correlation between the proportion of Immigrants from Spain and median male earnings in the United States with a correlation coefficient (R) of 0.465 and weighted average of $60,750, a difference of 6.8%.
Median Male Earnings Correlation Summary
| Measurement | Chinese | Immigrants from Spain |
| Minimum | $31,000 | $2,499 |
| Maximum | $82,197 | $250,001 |
| Range | $51,197 | $247,502 |
| Mean | $56,277 | $68,720 |
| Median | $54,905 | $60,260 |
| Interquartile 25% (IQ1) | $50,221 | $49,576 |
| Interquartile 75% (IQ3) | $61,384 | $73,651 |
| Interquartile Range (IQR) | $11,163 | $24,075 |
| Standard Deviation (Sample) | $10,489 | $35,640 |
| Standard Deviation (Population) | $10,395 | $35,373 |
Similar Demographics by Median Male Earnings
Demographics Similar to Chinese by Median Male Earnings
In terms of median male earnings, the demographic groups most similar to Chinese are Brazilian ($56,837, a difference of 0.060%), Immigrants from Syria ($56,830, a difference of 0.070%), Immigrants from Morocco ($56,958, a difference of 0.15%), Chilean ($56,973, a difference of 0.18%), and Pakistani ($56,719, a difference of 0.27%).
| Demographics | Rating | Rank | Median Male Earnings |
| Arabs | 94.0 /100 | #119 | Exceptional $57,298 |
| Canadians | 93.9 /100 | #120 | Exceptional $57,286 |
| Immigrants | Albania | 93.3 /100 | #121 | Exceptional $57,179 |
| Immigrants | Jordan | 93.1 /100 | #122 | Exceptional $57,145 |
| Slovenes | 93.1 /100 | #123 | Exceptional $57,145 |
| Chileans | 91.9 /100 | #124 | Exceptional $56,973 |
| Immigrants | Morocco | 91.8 /100 | #125 | Exceptional $56,958 |
| Chinese | 91.1 /100 | #126 | Exceptional $56,872 |
| Brazilians | 90.9 /100 | #127 | Exceptional $56,837 |
| Immigrants | Syria | 90.8 /100 | #128 | Exceptional $56,830 |
| Pakistanis | 89.9 /100 | #129 | Excellent $56,719 |
| Koreans | 89.4 /100 | #130 | Excellent $56,672 |
| Portuguese | 89.4 /100 | #131 | Excellent $56,663 |
| Czechs | 88.2 /100 | #132 | Excellent $56,546 |
| Immigrants | Germany | 88.2 /100 | #133 | Excellent $56,542 |
Demographics Similar to Immigrants from Spain by Median Male Earnings
In terms of median male earnings, the demographic groups most similar to Immigrants from Spain are Immigrants from Serbia ($60,600, a difference of 0.25%), Immigrants from Croatia ($60,914, a difference of 0.27%), Immigrants from Indonesia ($60,935, a difference of 0.30%), Immigrants from Eastern Europe ($60,958, a difference of 0.34%), and Immigrants from Pakistan ($60,987, a difference of 0.39%).
| Demographics | Rating | Rank | Median Male Earnings |
| Egyptians | 99.8 /100 | #60 | Exceptional $61,095 |
| Bolivians | 99.8 /100 | #61 | Exceptional $61,066 |
| Immigrants | Romania | 99.8 /100 | #62 | Exceptional $61,040 |
| Immigrants | Pakistan | 99.8 /100 | #63 | Exceptional $60,987 |
| Immigrants | Eastern Europe | 99.8 /100 | #64 | Exceptional $60,958 |
| Immigrants | Indonesia | 99.8 /100 | #65 | Exceptional $60,935 |
| Immigrants | Croatia | 99.8 /100 | #66 | Exceptional $60,914 |
| Immigrants | Spain | 99.8 /100 | #67 | Exceptional $60,750 |
| Immigrants | Serbia | 99.7 /100 | #68 | Exceptional $60,600 |
| Immigrants | Canada | 99.7 /100 | #69 | Exceptional $60,388 |
| Immigrants | Bulgaria | 99.7 /100 | #70 | Exceptional $60,358 |
| Mongolians | 99.7 /100 | #71 | Exceptional $60,350 |
| Immigrants | Western Europe | 99.7 /100 | #72 | Exceptional $60,334 |
| Immigrants | North America | 99.7 /100 | #73 | Exceptional $60,265 |
| Argentineans | 99.6 /100 | #74 | Exceptional $60,117 |