Polish vs Osage Median Male Earnings
COMPARE
Polish
Osage
Median Male Earnings
Median Male Earnings Comparison
Poles
Osage
$58,139
MEDIAN MALE EARNINGS
97.3/ 100
METRIC RATING
103rd/ 347
METRIC RANK
$50,292
MEDIAN MALE EARNINGS
1.6/ 100
METRIC RATING
250th/ 347
METRIC RANK
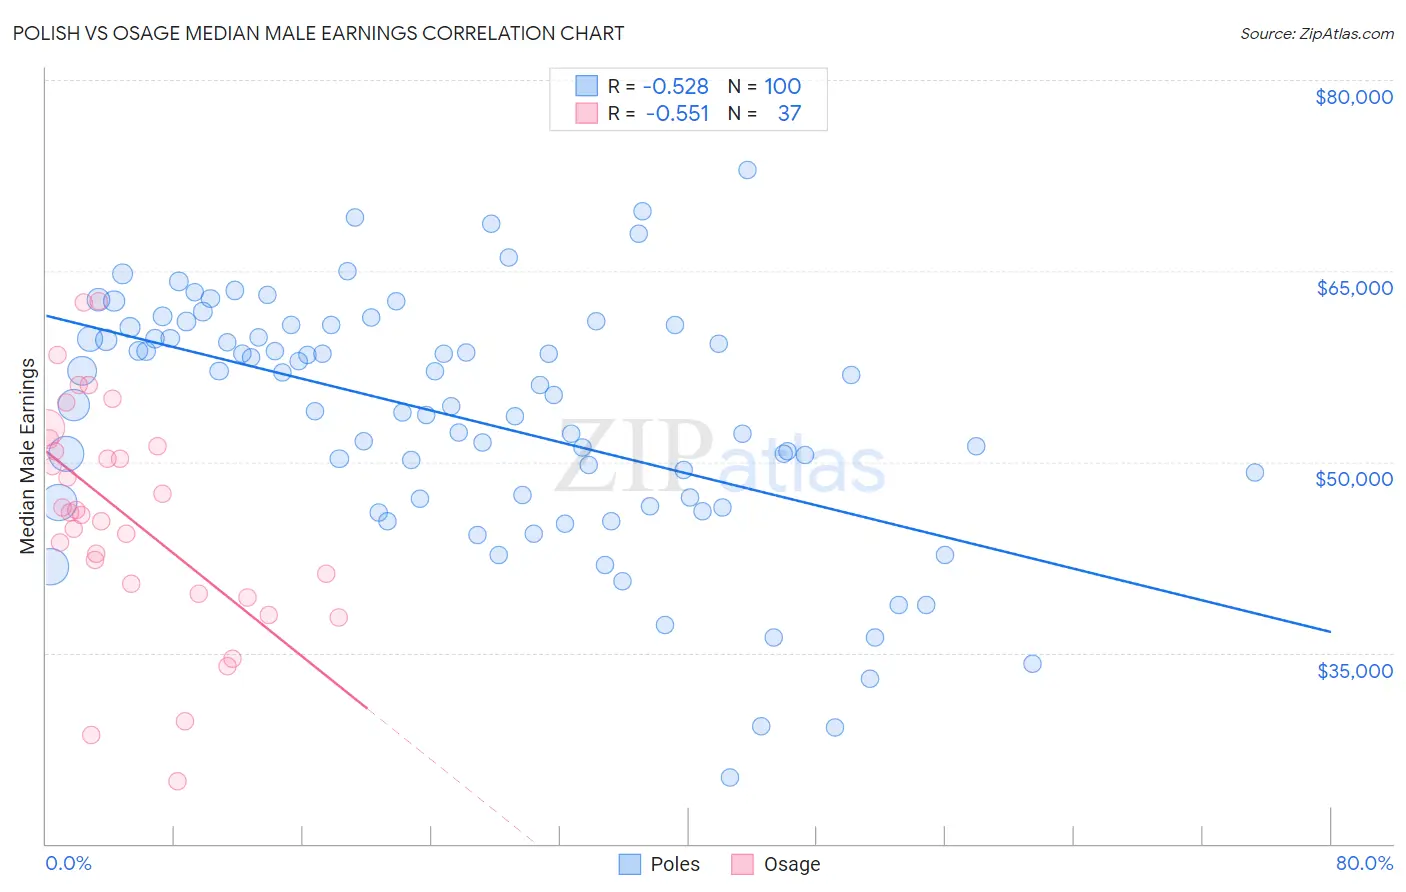
Polish vs Osage Median Male Earnings Correlation Chart
The statistical analysis conducted on geographies consisting of 559,585,611 people shows a substantial negative correlation between the proportion of Poles and median male earnings in the United States with a correlation coefficient (R) of -0.528 and weighted average of $58,139. Similarly, the statistical analysis conducted on geographies consisting of 91,793,042 people shows a substantial negative correlation between the proportion of Osage and median male earnings in the United States with a correlation coefficient (R) of -0.551 and weighted average of $50,292, a difference of 15.6%.
Median Male Earnings Correlation Summary
| Measurement | Polish | Osage |
| Minimum | $25,204 | $24,954 |
| Maximum | $72,933 | $62,626 |
| Range | $47,729 | $37,672 |
| Mean | $53,382 | $45,789 |
| Median | $54,879 | $46,052 |
| Interquartile 25% (IQ1) | $46,953 | $40,033 |
| Interquartile 75% (IQ3) | $60,187 | $51,519 |
| Interquartile Range (IQR) | $13,234 | $11,486 |
| Standard Deviation (Sample) | $9,652 | $8,890 |
| Standard Deviation (Population) | $9,604 | $8,769 |
Similar Demographics by Median Male Earnings
Demographics Similar to Poles by Median Male Earnings
In terms of median male earnings, the demographic groups most similar to Poles are Armenian ($58,134, a difference of 0.010%), Immigrants from Western Asia ($58,131, a difference of 0.020%), Syrian ($58,187, a difference of 0.080%), Immigrants from Northern Africa ($58,008, a difference of 0.23%), and Serbian ($57,975, a difference of 0.28%).
| Demographics | Rating | Rank | Median Male Earnings |
| Albanians | 98.4 /100 | #96 | Exceptional $58,680 |
| Northern Europeans | 98.2 /100 | #97 | Exceptional $58,588 |
| Jordanians | 98.1 /100 | #98 | Exceptional $58,500 |
| Immigrants | Poland | 98.0 /100 | #99 | Exceptional $58,452 |
| Assyrians/Chaldeans/Syriacs | 97.9 /100 | #100 | Exceptional $58,437 |
| Immigrants | Brazil | 97.7 /100 | #101 | Exceptional $58,324 |
| Syrians | 97.4 /100 | #102 | Exceptional $58,187 |
| Poles | 97.3 /100 | #103 | Exceptional $58,139 |
| Armenians | 97.3 /100 | #104 | Exceptional $58,134 |
| Immigrants | Western Asia | 97.3 /100 | #105 | Exceptional $58,131 |
| Immigrants | Northern Africa | 96.9 /100 | #106 | Exceptional $58,008 |
| Serbians | 96.8 /100 | #107 | Exceptional $57,975 |
| Immigrants | Uzbekistan | 96.7 /100 | #108 | Exceptional $57,941 |
| British | 96.5 /100 | #109 | Exceptional $57,890 |
| Palestinians | 96.2 /100 | #110 | Exceptional $57,778 |
Demographics Similar to Osage by Median Male Earnings
In terms of median male earnings, the demographic groups most similar to Osage are Immigrants from Burma/Myanmar ($50,298, a difference of 0.010%), Immigrants from Grenada ($50,279, a difference of 0.020%), Immigrants from Guyana ($50,321, a difference of 0.060%), Subsaharan African ($50,408, a difference of 0.23%), and Immigrants from Ecuador ($50,474, a difference of 0.36%).
| Demographics | Rating | Rank | Median Male Earnings |
| French American Indians | 2.2 /100 | #243 | Tragic $50,611 |
| Houma | 2.0 /100 | #244 | Tragic $50,547 |
| Hawaiians | 1.9 /100 | #245 | Tragic $50,488 |
| Immigrants | Ecuador | 1.9 /100 | #246 | Tragic $50,474 |
| Sub-Saharan Africans | 1.8 /100 | #247 | Tragic $50,408 |
| Immigrants | Guyana | 1.6 /100 | #248 | Tragic $50,321 |
| Immigrants | Burma/Myanmar | 1.6 /100 | #249 | Tragic $50,298 |
| Osage | 1.6 /100 | #250 | Tragic $50,292 |
| Immigrants | Grenada | 1.6 /100 | #251 | Tragic $50,279 |
| Immigrants | Cabo Verde | 1.2 /100 | #252 | Tragic $50,009 |
| German Russians | 1.1 /100 | #253 | Tragic $49,924 |
| Senegalese | 1.0 /100 | #254 | Tragic $49,774 |
| Alaskan Athabascans | 0.9 /100 | #255 | Tragic $49,748 |
| Alaska Natives | 0.9 /100 | #256 | Tragic $49,711 |
| British West Indians | 0.8 /100 | #257 | Tragic $49,636 |