Chinese vs Jordanian Median Male Earnings
COMPARE
Chinese
Jordanian
Median Male Earnings
Median Male Earnings Comparison
Chinese
Jordanians
$56,872
MEDIAN MALE EARNINGS
91.1/ 100
METRIC RATING
126th/ 347
METRIC RANK
$58,500
MEDIAN MALE EARNINGS
98.1/ 100
METRIC RATING
98th/ 347
METRIC RANK
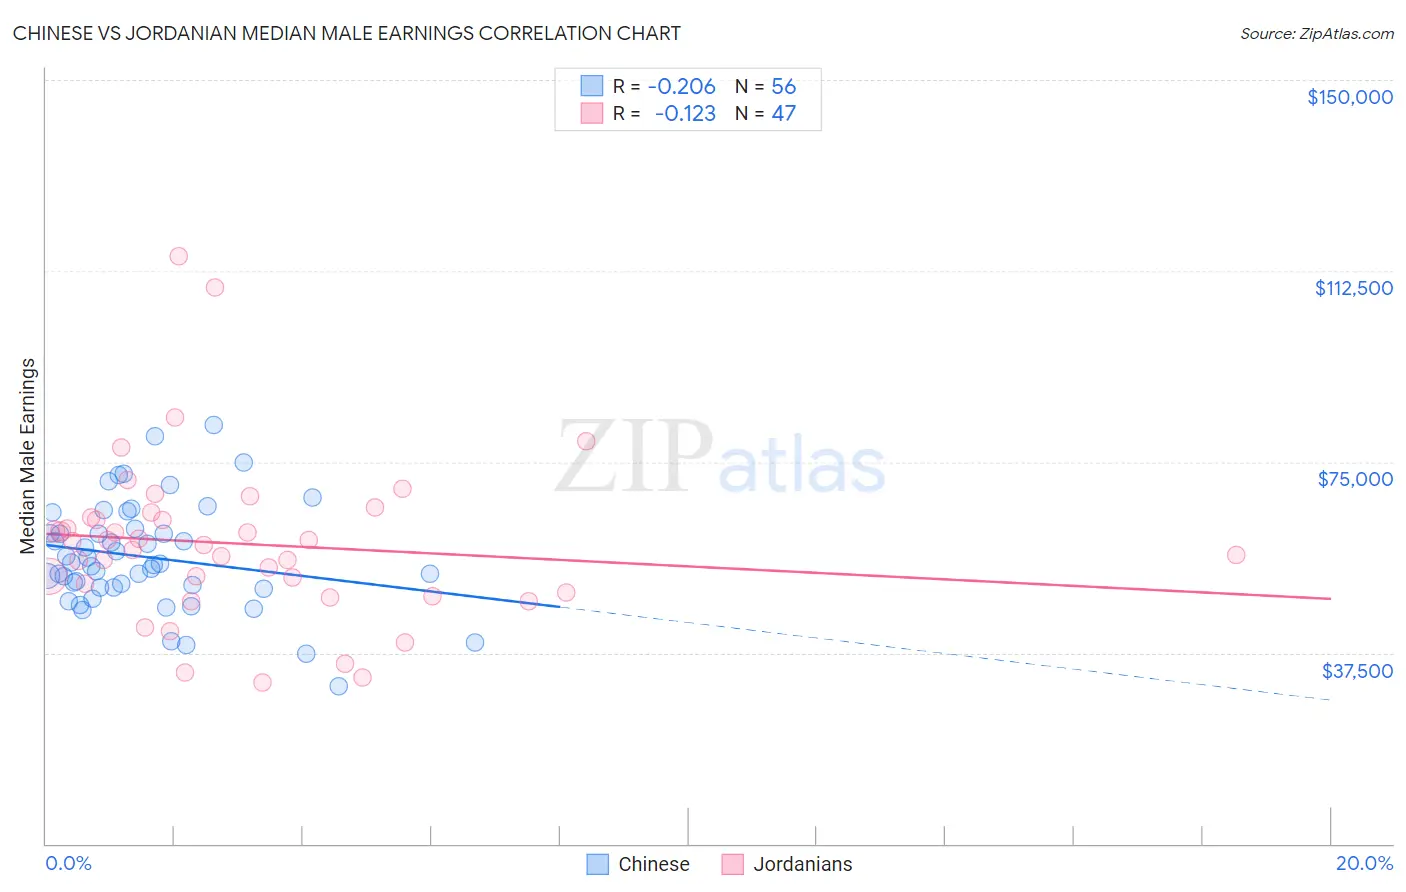
Chinese vs Jordanian Median Male Earnings Correlation Chart
The statistical analysis conducted on geographies consisting of 64,807,348 people shows a weak negative correlation between the proportion of Chinese and median male earnings in the United States with a correlation coefficient (R) of -0.206 and weighted average of $56,872. Similarly, the statistical analysis conducted on geographies consisting of 166,398,060 people shows a poor negative correlation between the proportion of Jordanians and median male earnings in the United States with a correlation coefficient (R) of -0.123 and weighted average of $58,500, a difference of 2.9%.
Median Male Earnings Correlation Summary
| Measurement | Chinese | Jordanian |
| Minimum | $31,000 | $31,660 |
| Maximum | $82,197 | $115,416 |
| Range | $51,197 | $83,756 |
| Mean | $56,277 | $58,929 |
| Median | $54,905 | $58,675 |
| Interquartile 25% (IQ1) | $50,221 | $49,250 |
| Interquartile 75% (IQ3) | $61,384 | $63,996 |
| Interquartile Range (IQR) | $11,163 | $14,746 |
| Standard Deviation (Sample) | $10,489 | $16,248 |
| Standard Deviation (Population) | $10,395 | $16,074 |
Similar Demographics by Median Male Earnings
Demographics Similar to Chinese by Median Male Earnings
In terms of median male earnings, the demographic groups most similar to Chinese are Brazilian ($56,837, a difference of 0.060%), Immigrants from Syria ($56,830, a difference of 0.070%), Immigrants from Morocco ($56,958, a difference of 0.15%), Chilean ($56,973, a difference of 0.18%), and Pakistani ($56,719, a difference of 0.27%).
| Demographics | Rating | Rank | Median Male Earnings |
| Arabs | 94.0 /100 | #119 | Exceptional $57,298 |
| Canadians | 93.9 /100 | #120 | Exceptional $57,286 |
| Immigrants | Albania | 93.3 /100 | #121 | Exceptional $57,179 |
| Immigrants | Jordan | 93.1 /100 | #122 | Exceptional $57,145 |
| Slovenes | 93.1 /100 | #123 | Exceptional $57,145 |
| Chileans | 91.9 /100 | #124 | Exceptional $56,973 |
| Immigrants | Morocco | 91.8 /100 | #125 | Exceptional $56,958 |
| Chinese | 91.1 /100 | #126 | Exceptional $56,872 |
| Brazilians | 90.9 /100 | #127 | Exceptional $56,837 |
| Immigrants | Syria | 90.8 /100 | #128 | Exceptional $56,830 |
| Pakistanis | 89.9 /100 | #129 | Excellent $56,719 |
| Koreans | 89.4 /100 | #130 | Excellent $56,672 |
| Portuguese | 89.4 /100 | #131 | Excellent $56,663 |
| Czechs | 88.2 /100 | #132 | Excellent $56,546 |
| Immigrants | Germany | 88.2 /100 | #133 | Excellent $56,542 |
Demographics Similar to Jordanians by Median Male Earnings
In terms of median male earnings, the demographic groups most similar to Jordanians are Immigrants from Poland ($58,452, a difference of 0.080%), Assyrian/Chaldean/Syriac ($58,437, a difference of 0.11%), Northern European ($58,588, a difference of 0.15%), Immigrants from Brazil ($58,324, a difference of 0.30%), and Albanian ($58,680, a difference of 0.31%).
| Demographics | Rating | Rank | Median Male Earnings |
| Laotians | 99.2 /100 | #91 | Exceptional $59,351 |
| Immigrants | Kazakhstan | 99.1 /100 | #92 | Exceptional $59,278 |
| Immigrants | Southern Europe | 99.0 /100 | #93 | Exceptional $59,217 |
| Immigrants | North Macedonia | 99.0 /100 | #94 | Exceptional $59,189 |
| Immigrants | Lebanon | 98.6 /100 | #95 | Exceptional $58,835 |
| Albanians | 98.4 /100 | #96 | Exceptional $58,680 |
| Northern Europeans | 98.2 /100 | #97 | Exceptional $58,588 |
| Jordanians | 98.1 /100 | #98 | Exceptional $58,500 |
| Immigrants | Poland | 98.0 /100 | #99 | Exceptional $58,452 |
| Assyrians/Chaldeans/Syriacs | 97.9 /100 | #100 | Exceptional $58,437 |
| Immigrants | Brazil | 97.7 /100 | #101 | Exceptional $58,324 |
| Syrians | 97.4 /100 | #102 | Exceptional $58,187 |
| Poles | 97.3 /100 | #103 | Exceptional $58,139 |
| Armenians | 97.3 /100 | #104 | Exceptional $58,134 |
| Immigrants | Western Asia | 97.3 /100 | #105 | Exceptional $58,131 |