Cheyenne vs Osage Median Male Earnings
COMPARE
Cheyenne
Osage
Median Male Earnings
Median Male Earnings Comparison
Cheyenne
Osage
$46,062
MEDIAN MALE EARNINGS
0.0/ 100
METRIC RATING
318th/ 347
METRIC RANK
$50,292
MEDIAN MALE EARNINGS
1.6/ 100
METRIC RATING
250th/ 347
METRIC RANK
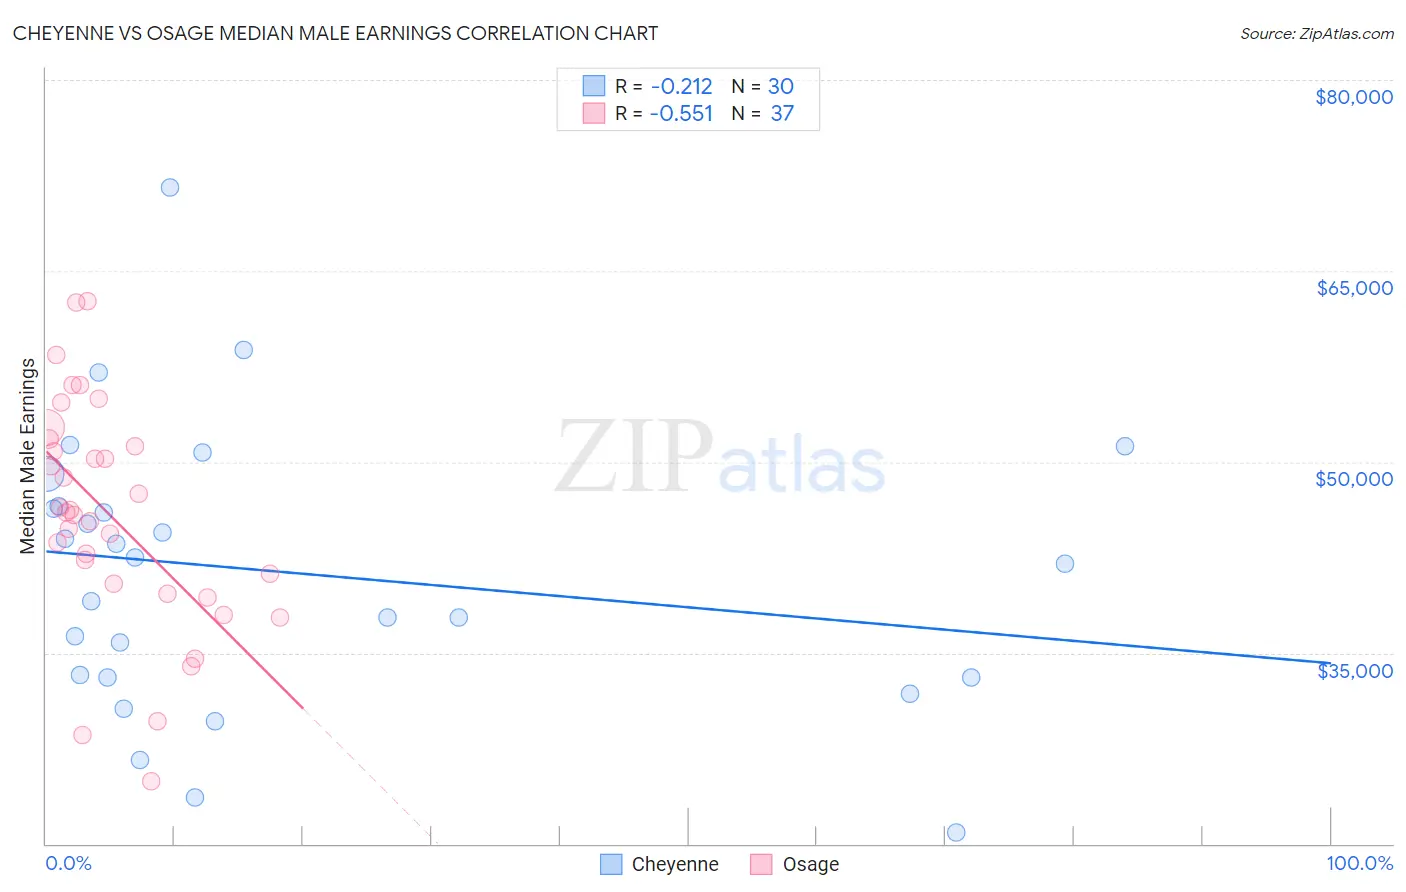
Cheyenne vs Osage Median Male Earnings Correlation Chart
The statistical analysis conducted on geographies consisting of 80,706,071 people shows a weak negative correlation between the proportion of Cheyenne and median male earnings in the United States with a correlation coefficient (R) of -0.212 and weighted average of $46,062. Similarly, the statistical analysis conducted on geographies consisting of 91,793,042 people shows a substantial negative correlation between the proportion of Osage and median male earnings in the United States with a correlation coefficient (R) of -0.551 and weighted average of $50,292, a difference of 9.2%.
Median Male Earnings Correlation Summary
| Measurement | Cheyenne | Osage |
| Minimum | $20,903 | $24,954 |
| Maximum | $71,550 | $62,626 |
| Range | $50,647 | $37,672 |
| Mean | $41,316 | $45,789 |
| Median | $42,260 | $46,052 |
| Interquartile 25% (IQ1) | $33,100 | $40,033 |
| Interquartile 75% (IQ3) | $46,481 | $51,519 |
| Interquartile Range (IQR) | $13,381 | $11,486 |
| Standard Deviation (Sample) | $10,984 | $8,890 |
| Standard Deviation (Population) | $10,799 | $8,769 |
Similar Demographics by Median Male Earnings
Demographics Similar to Cheyenne by Median Male Earnings
In terms of median male earnings, the demographic groups most similar to Cheyenne are Mexican ($46,147, a difference of 0.18%), Immigrants from Caribbean ($46,193, a difference of 0.28%), Haitian ($45,903, a difference of 0.35%), Immigrants from Guatemala ($46,244, a difference of 0.39%), and Immigrants from Honduras ($45,787, a difference of 0.60%).
| Demographics | Rating | Rank | Median Male Earnings |
| Apache | 0.0 /100 | #311 | Tragic $46,429 |
| Hispanics or Latinos | 0.0 /100 | #312 | Tragic $46,419 |
| Hondurans | 0.0 /100 | #313 | Tragic $46,374 |
| Chippewa | 0.0 /100 | #314 | Tragic $46,368 |
| Immigrants | Guatemala | 0.0 /100 | #315 | Tragic $46,244 |
| Immigrants | Caribbean | 0.0 /100 | #316 | Tragic $46,193 |
| Mexicans | 0.0 /100 | #317 | Tragic $46,147 |
| Cheyenne | 0.0 /100 | #318 | Tragic $46,062 |
| Haitians | 0.0 /100 | #319 | Tragic $45,903 |
| Immigrants | Honduras | 0.0 /100 | #320 | Tragic $45,787 |
| Fijians | 0.0 /100 | #321 | Tragic $45,607 |
| Sioux | 0.0 /100 | #322 | Tragic $45,566 |
| Immigrants | Central America | 0.0 /100 | #323 | Tragic $45,538 |
| Blacks/African Americans | 0.0 /100 | #324 | Tragic $45,523 |
| Yuman | 0.0 /100 | #325 | Tragic $45,446 |
Demographics Similar to Osage by Median Male Earnings
In terms of median male earnings, the demographic groups most similar to Osage are Immigrants from Burma/Myanmar ($50,298, a difference of 0.010%), Immigrants from Grenada ($50,279, a difference of 0.020%), Immigrants from Guyana ($50,321, a difference of 0.060%), Subsaharan African ($50,408, a difference of 0.23%), and Immigrants from Ecuador ($50,474, a difference of 0.36%).
| Demographics | Rating | Rank | Median Male Earnings |
| French American Indians | 2.2 /100 | #243 | Tragic $50,611 |
| Houma | 2.0 /100 | #244 | Tragic $50,547 |
| Hawaiians | 1.9 /100 | #245 | Tragic $50,488 |
| Immigrants | Ecuador | 1.9 /100 | #246 | Tragic $50,474 |
| Sub-Saharan Africans | 1.8 /100 | #247 | Tragic $50,408 |
| Immigrants | Guyana | 1.6 /100 | #248 | Tragic $50,321 |
| Immigrants | Burma/Myanmar | 1.6 /100 | #249 | Tragic $50,298 |
| Osage | 1.6 /100 | #250 | Tragic $50,292 |
| Immigrants | Grenada | 1.6 /100 | #251 | Tragic $50,279 |
| Immigrants | Cabo Verde | 1.2 /100 | #252 | Tragic $50,009 |
| German Russians | 1.1 /100 | #253 | Tragic $49,924 |
| Senegalese | 1.0 /100 | #254 | Tragic $49,774 |
| Alaskan Athabascans | 0.9 /100 | #255 | Tragic $49,748 |
| Alaska Natives | 0.9 /100 | #256 | Tragic $49,711 |
| British West Indians | 0.8 /100 | #257 | Tragic $49,636 |