Chinese vs Immigrants from Kenya Median Male Earnings
COMPARE
Chinese
Immigrants from Kenya
Median Male Earnings
Median Male Earnings Comparison
Chinese
Immigrants from Kenya
$56,872
MEDIAN MALE EARNINGS
91.1/ 100
METRIC RATING
126th/ 347
METRIC RANK
$53,427
MEDIAN MALE EARNINGS
26.0/ 100
METRIC RATING
197th/ 347
METRIC RANK
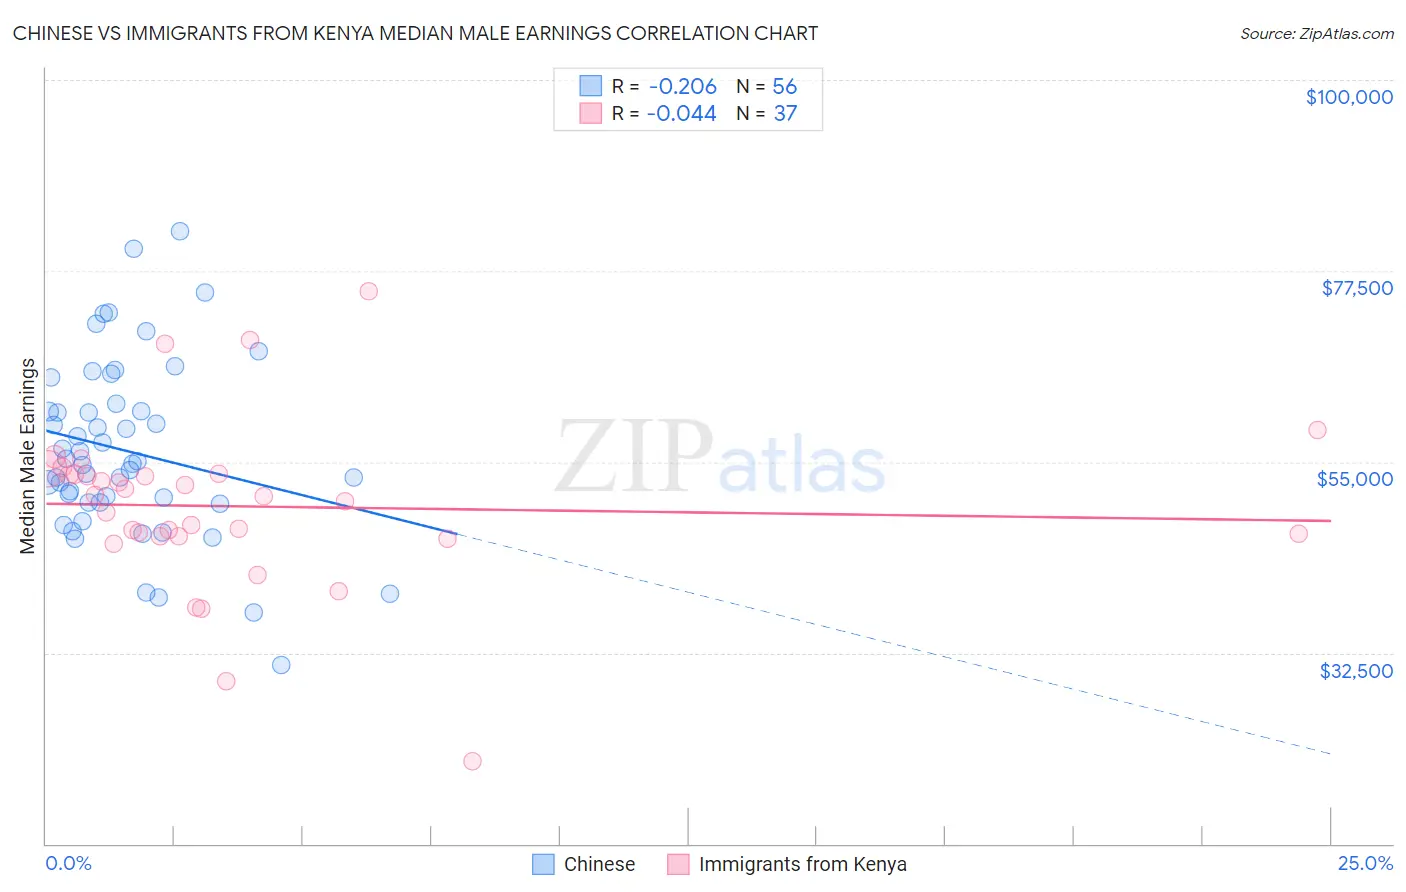
Chinese vs Immigrants from Kenya Median Male Earnings Correlation Chart
The statistical analysis conducted on geographies consisting of 64,807,348 people shows a weak negative correlation between the proportion of Chinese and median male earnings in the United States with a correlation coefficient (R) of -0.206 and weighted average of $56,872. Similarly, the statistical analysis conducted on geographies consisting of 218,068,139 people shows no correlation between the proportion of Immigrants from Kenya and median male earnings in the United States with a correlation coefficient (R) of -0.044 and weighted average of $53,427, a difference of 6.5%.
Median Male Earnings Correlation Summary
| Measurement | Chinese | Immigrants from Kenya |
| Minimum | $31,000 | $19,659 |
| Maximum | $82,197 | $75,179 |
| Range | $51,197 | $55,520 |
| Mean | $56,277 | $49,751 |
| Median | $54,905 | $50,930 |
| Interquartile 25% (IQ1) | $50,221 | $46,171 |
| Interquartile 75% (IQ3) | $61,384 | $53,573 |
| Interquartile Range (IQR) | $11,163 | $7,402 |
| Standard Deviation (Sample) | $10,489 | $9,966 |
| Standard Deviation (Population) | $10,395 | $9,831 |
Similar Demographics by Median Male Earnings
Demographics Similar to Chinese by Median Male Earnings
In terms of median male earnings, the demographic groups most similar to Chinese are Brazilian ($56,837, a difference of 0.060%), Immigrants from Syria ($56,830, a difference of 0.070%), Immigrants from Morocco ($56,958, a difference of 0.15%), Chilean ($56,973, a difference of 0.18%), and Pakistani ($56,719, a difference of 0.27%).
| Demographics | Rating | Rank | Median Male Earnings |
| Arabs | 94.0 /100 | #119 | Exceptional $57,298 |
| Canadians | 93.9 /100 | #120 | Exceptional $57,286 |
| Immigrants | Albania | 93.3 /100 | #121 | Exceptional $57,179 |
| Immigrants | Jordan | 93.1 /100 | #122 | Exceptional $57,145 |
| Slovenes | 93.1 /100 | #123 | Exceptional $57,145 |
| Chileans | 91.9 /100 | #124 | Exceptional $56,973 |
| Immigrants | Morocco | 91.8 /100 | #125 | Exceptional $56,958 |
| Chinese | 91.1 /100 | #126 | Exceptional $56,872 |
| Brazilians | 90.9 /100 | #127 | Exceptional $56,837 |
| Immigrants | Syria | 90.8 /100 | #128 | Exceptional $56,830 |
| Pakistanis | 89.9 /100 | #129 | Excellent $56,719 |
| Koreans | 89.4 /100 | #130 | Excellent $56,672 |
| Portuguese | 89.4 /100 | #131 | Excellent $56,663 |
| Czechs | 88.2 /100 | #132 | Excellent $56,546 |
| Immigrants | Germany | 88.2 /100 | #133 | Excellent $56,542 |
Demographics Similar to Immigrants from Kenya by Median Male Earnings
In terms of median male earnings, the demographic groups most similar to Immigrants from Kenya are Immigrants from Africa ($53,457, a difference of 0.060%), Immigrants from the Azores ($53,503, a difference of 0.14%), Spanish ($53,576, a difference of 0.28%), Immigrants from Costa Rica ($53,237, a difference of 0.36%), and Tongan ($53,218, a difference of 0.39%).
| Demographics | Rating | Rank | Median Male Earnings |
| Uruguayans | 31.1 /100 | #190 | Fair $53,680 |
| Guamanians/Chamorros | 30.7 /100 | #191 | Fair $53,661 |
| Scotch-Irish | 30.6 /100 | #192 | Fair $53,658 |
| Kenyans | 30.4 /100 | #193 | Fair $53,647 |
| Spanish | 29.0 /100 | #194 | Fair $53,576 |
| Immigrants | Azores | 27.5 /100 | #195 | Fair $53,503 |
| Immigrants | Africa | 26.6 /100 | #196 | Fair $53,457 |
| Immigrants | Kenya | 26.0 /100 | #197 | Fair $53,427 |
| Immigrants | Costa Rica | 22.6 /100 | #198 | Fair $53,237 |
| Tongans | 22.3 /100 | #199 | Fair $53,218 |
| Immigrants | Thailand | 17.5 /100 | #200 | Poor $52,908 |
| Immigrants | Bosnia and Herzegovina | 16.9 /100 | #201 | Poor $52,869 |
| Immigrants | Uruguay | 16.8 /100 | #202 | Poor $52,860 |
| Panamanians | 16.5 /100 | #203 | Poor $52,835 |
| Ghanaians | 16.1 /100 | #204 | Poor $52,810 |