Chinese vs Immigrants from El Salvador Median Male Earnings
COMPARE
Chinese
Immigrants from El Salvador
Median Male Earnings
Median Male Earnings Comparison
Chinese
Immigrants from El Salvador
$56,872
MEDIAN MALE EARNINGS
91.1/ 100
METRIC RATING
126th/ 347
METRIC RANK
$47,973
MEDIAN MALE EARNINGS
0.2/ 100
METRIC RATING
287th/ 347
METRIC RANK
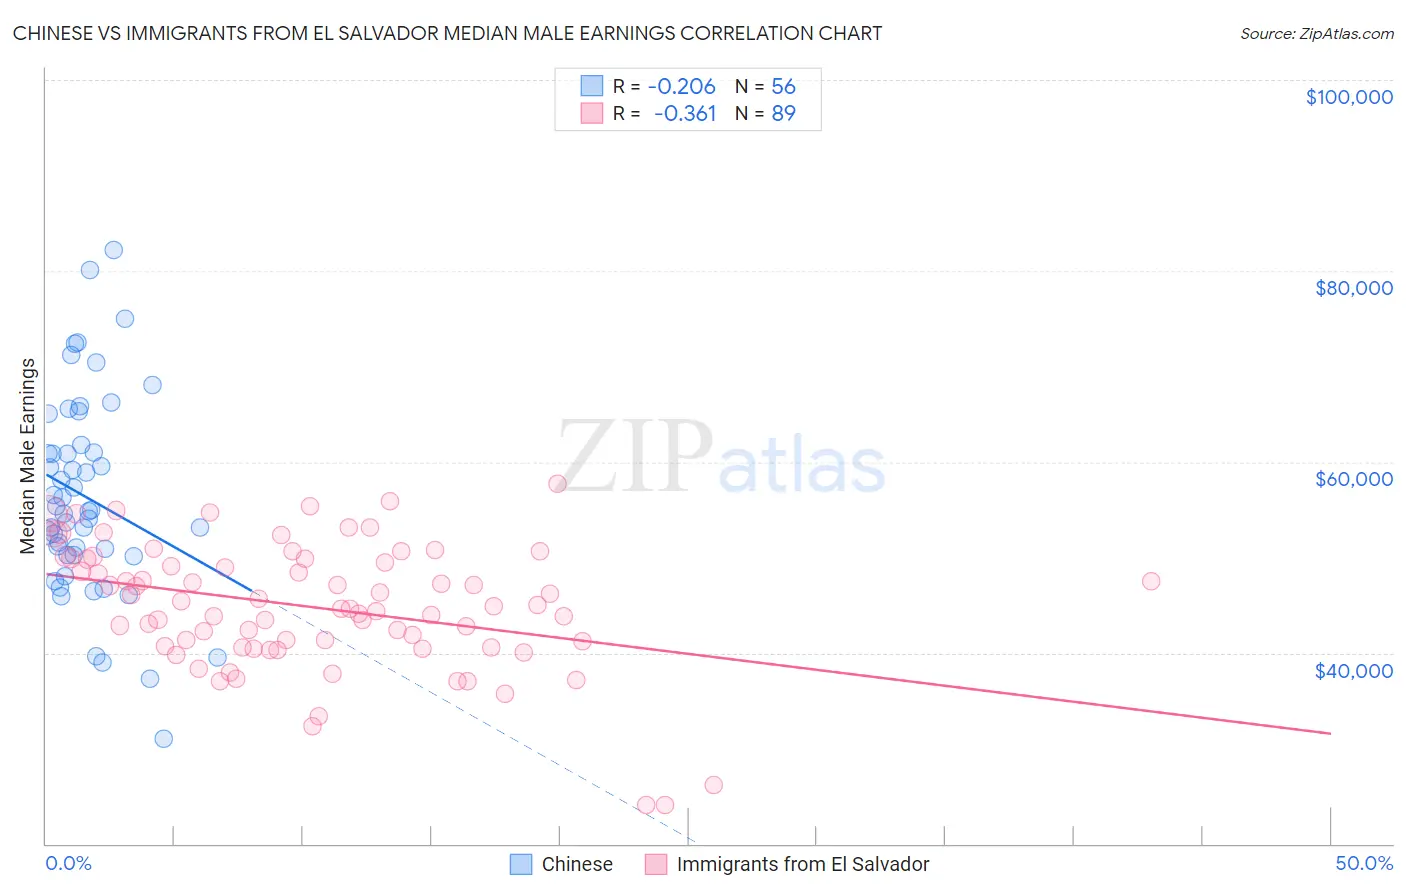
Chinese vs Immigrants from El Salvador Median Male Earnings Correlation Chart
The statistical analysis conducted on geographies consisting of 64,807,348 people shows a weak negative correlation between the proportion of Chinese and median male earnings in the United States with a correlation coefficient (R) of -0.206 and weighted average of $56,872. Similarly, the statistical analysis conducted on geographies consisting of 357,755,814 people shows a mild negative correlation between the proportion of Immigrants from El Salvador and median male earnings in the United States with a correlation coefficient (R) of -0.361 and weighted average of $47,973, a difference of 18.5%.
Median Male Earnings Correlation Summary
| Measurement | Chinese | Immigrants from El Salvador |
| Minimum | $31,000 | $24,025 |
| Maximum | $82,197 | $57,715 |
| Range | $51,197 | $33,690 |
| Mean | $56,277 | $44,787 |
| Median | $54,905 | $44,909 |
| Interquartile 25% (IQ1) | $50,221 | $40,644 |
| Interquartile 75% (IQ3) | $61,384 | $49,826 |
| Interquartile Range (IQR) | $11,163 | $9,182 |
| Standard Deviation (Sample) | $10,489 | $6,677 |
| Standard Deviation (Population) | $10,395 | $6,639 |
Similar Demographics by Median Male Earnings
Demographics Similar to Chinese by Median Male Earnings
In terms of median male earnings, the demographic groups most similar to Chinese are Brazilian ($56,837, a difference of 0.060%), Immigrants from Syria ($56,830, a difference of 0.070%), Immigrants from Morocco ($56,958, a difference of 0.15%), Chilean ($56,973, a difference of 0.18%), and Pakistani ($56,719, a difference of 0.27%).
| Demographics | Rating | Rank | Median Male Earnings |
| Arabs | 94.0 /100 | #119 | Exceptional $57,298 |
| Canadians | 93.9 /100 | #120 | Exceptional $57,286 |
| Immigrants | Albania | 93.3 /100 | #121 | Exceptional $57,179 |
| Immigrants | Jordan | 93.1 /100 | #122 | Exceptional $57,145 |
| Slovenes | 93.1 /100 | #123 | Exceptional $57,145 |
| Chileans | 91.9 /100 | #124 | Exceptional $56,973 |
| Immigrants | Morocco | 91.8 /100 | #125 | Exceptional $56,958 |
| Chinese | 91.1 /100 | #126 | Exceptional $56,872 |
| Brazilians | 90.9 /100 | #127 | Exceptional $56,837 |
| Immigrants | Syria | 90.8 /100 | #128 | Exceptional $56,830 |
| Pakistanis | 89.9 /100 | #129 | Excellent $56,719 |
| Koreans | 89.4 /100 | #130 | Excellent $56,672 |
| Portuguese | 89.4 /100 | #131 | Excellent $56,663 |
| Czechs | 88.2 /100 | #132 | Excellent $56,546 |
| Immigrants | Germany | 88.2 /100 | #133 | Excellent $56,542 |
Demographics Similar to Immigrants from El Salvador by Median Male Earnings
In terms of median male earnings, the demographic groups most similar to Immigrants from El Salvador are African ($47,994, a difference of 0.040%), Paiute ($47,991, a difference of 0.040%), Mexican American Indian ($47,990, a difference of 0.040%), Shoshone ($47,930, a difference of 0.090%), and Immigrants from Jamaica ($48,040, a difference of 0.14%).
| Demographics | Rating | Rank | Median Male Earnings |
| Comanche | 0.2 /100 | #280 | Tragic $48,202 |
| Marshallese | 0.2 /100 | #281 | Tragic $48,137 |
| Central Americans | 0.2 /100 | #282 | Tragic $48,093 |
| Immigrants | Jamaica | 0.2 /100 | #283 | Tragic $48,040 |
| Africans | 0.2 /100 | #284 | Tragic $47,994 |
| Paiute | 0.2 /100 | #285 | Tragic $47,991 |
| Mexican American Indians | 0.2 /100 | #286 | Tragic $47,990 |
| Immigrants | El Salvador | 0.2 /100 | #287 | Tragic $47,973 |
| Shoshone | 0.2 /100 | #288 | Tragic $47,930 |
| Chickasaw | 0.1 /100 | #289 | Tragic $47,832 |
| Immigrants | Belize | 0.1 /100 | #290 | Tragic $47,809 |
| Choctaw | 0.1 /100 | #291 | Tragic $47,729 |
| Immigrants | Dominica | 0.1 /100 | #292 | Tragic $47,651 |
| Indonesians | 0.1 /100 | #293 | Tragic $47,503 |
| Immigrants | Nicaragua | 0.1 /100 | #294 | Tragic $47,482 |