Chinese vs Japanese Median Male Earnings
COMPARE
Chinese
Japanese
Median Male Earnings
Median Male Earnings Comparison
Chinese
Japanese
$56,872
MEDIAN MALE EARNINGS
91.1/ 100
METRIC RATING
126th/ 347
METRIC RANK
$51,473
MEDIAN MALE EARNINGS
4.9/ 100
METRIC RATING
226th/ 347
METRIC RANK
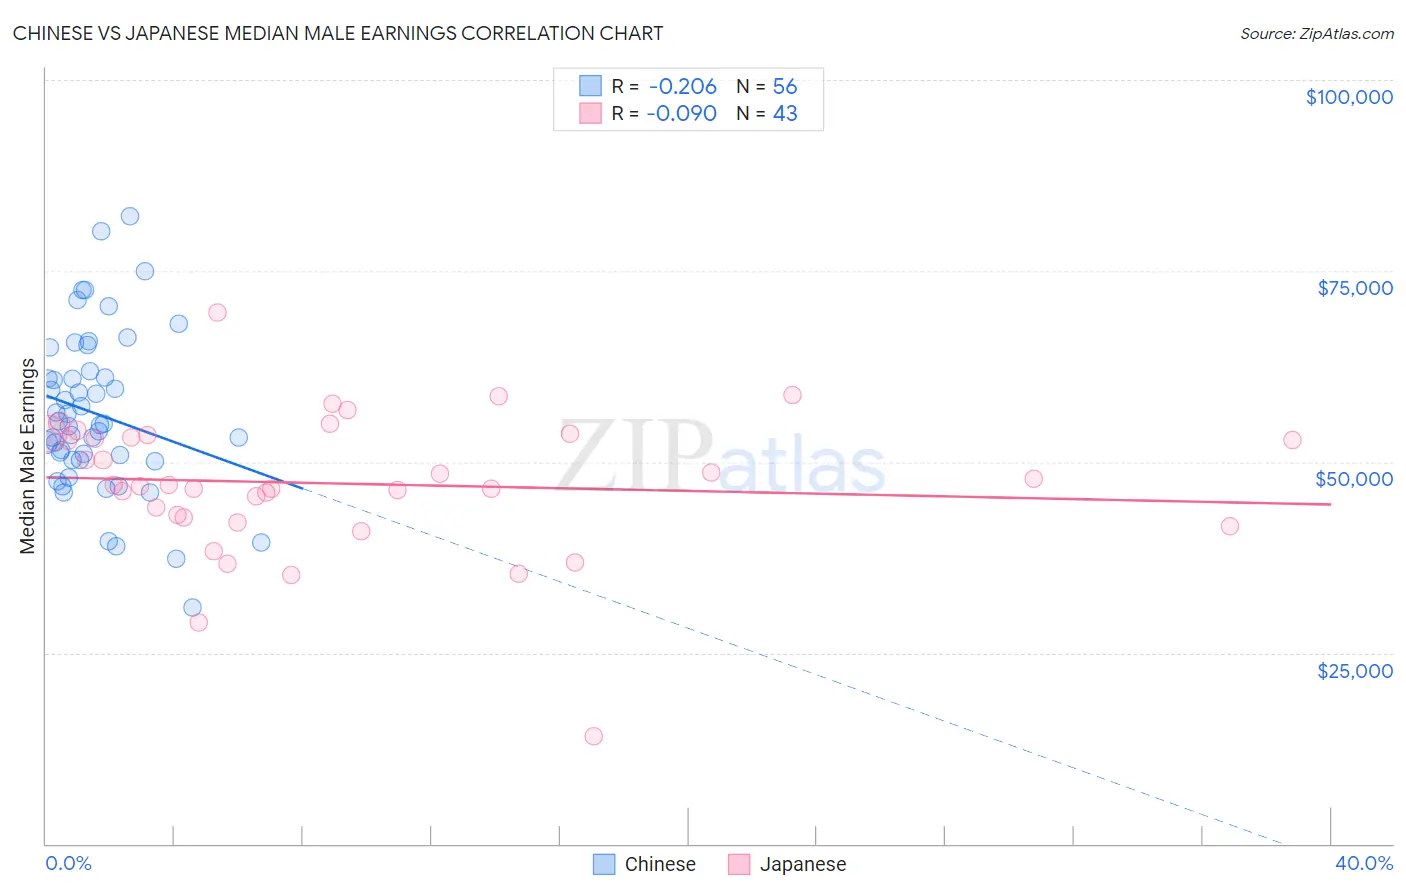
Chinese vs Japanese Median Male Earnings Correlation Chart
The statistical analysis conducted on geographies consisting of 64,807,348 people shows a weak negative correlation between the proportion of Chinese and median male earnings in the United States with a correlation coefficient (R) of -0.206 and weighted average of $56,872. Similarly, the statistical analysis conducted on geographies consisting of 249,157,630 people shows a slight negative correlation between the proportion of Japanese and median male earnings in the United States with a correlation coefficient (R) of -0.090 and weighted average of $51,473, a difference of 10.5%.
Median Male Earnings Correlation Summary
| Measurement | Chinese | Japanese |
| Minimum | $31,000 | $14,032 |
| Maximum | $82,197 | $69,626 |
| Range | $51,197 | $55,594 |
| Mean | $56,277 | $47,153 |
| Median | $54,905 | $47,032 |
| Interquartile 25% (IQ1) | $50,221 | $42,663 |
| Interquartile 75% (IQ3) | $61,384 | $53,598 |
| Interquartile Range (IQR) | $11,163 | $10,935 |
| Standard Deviation (Sample) | $10,489 | $9,237 |
| Standard Deviation (Population) | $10,395 | $9,129 |
Similar Demographics by Median Male Earnings
Demographics Similar to Chinese by Median Male Earnings
In terms of median male earnings, the demographic groups most similar to Chinese are Brazilian ($56,837, a difference of 0.060%), Immigrants from Syria ($56,830, a difference of 0.070%), Immigrants from Morocco ($56,958, a difference of 0.15%), Chilean ($56,973, a difference of 0.18%), and Pakistani ($56,719, a difference of 0.27%).
| Demographics | Rating | Rank | Median Male Earnings |
| Arabs | 94.0 /100 | #119 | Exceptional $57,298 |
| Canadians | 93.9 /100 | #120 | Exceptional $57,286 |
| Immigrants | Albania | 93.3 /100 | #121 | Exceptional $57,179 |
| Immigrants | Jordan | 93.1 /100 | #122 | Exceptional $57,145 |
| Slovenes | 93.1 /100 | #123 | Exceptional $57,145 |
| Chileans | 91.9 /100 | #124 | Exceptional $56,973 |
| Immigrants | Morocco | 91.8 /100 | #125 | Exceptional $56,958 |
| Chinese | 91.1 /100 | #126 | Exceptional $56,872 |
| Brazilians | 90.9 /100 | #127 | Exceptional $56,837 |
| Immigrants | Syria | 90.8 /100 | #128 | Exceptional $56,830 |
| Pakistanis | 89.9 /100 | #129 | Excellent $56,719 |
| Koreans | 89.4 /100 | #130 | Excellent $56,672 |
| Portuguese | 89.4 /100 | #131 | Excellent $56,663 |
| Czechs | 88.2 /100 | #132 | Excellent $56,546 |
| Immigrants | Germany | 88.2 /100 | #133 | Excellent $56,542 |
Demographics Similar to Japanese by Median Male Earnings
In terms of median male earnings, the demographic groups most similar to Japanese are Immigrants from Sudan ($51,489, a difference of 0.030%), Trinidadian and Tobagonian ($51,446, a difference of 0.050%), Samoan ($51,389, a difference of 0.16%), Immigrants from Trinidad and Tobago ($51,376, a difference of 0.19%), and Immigrants from Cambodia ($51,594, a difference of 0.23%).
| Demographics | Rating | Rank | Median Male Earnings |
| Immigrants | Ghana | 6.9 /100 | #219 | Tragic $51,836 |
| Immigrants | Armenia | 6.6 /100 | #220 | Tragic $51,793 |
| Immigrants | Senegal | 5.8 /100 | #221 | Tragic $51,647 |
| Immigrants | Bangladesh | 5.8 /100 | #222 | Tragic $51,642 |
| Ecuadorians | 5.5 /100 | #223 | Tragic $51,596 |
| Immigrants | Cambodia | 5.5 /100 | #224 | Tragic $51,594 |
| Immigrants | Sudan | 5.0 /100 | #225 | Tragic $51,489 |
| Japanese | 4.9 /100 | #226 | Tragic $51,473 |
| Trinidadians and Tobagonians | 4.8 /100 | #227 | Tragic $51,446 |
| Samoans | 4.6 /100 | #228 | Tragic $51,389 |
| Immigrants | Trinidad and Tobago | 4.5 /100 | #229 | Tragic $51,376 |
| Immigrants | Nigeria | 4.2 /100 | #230 | Tragic $51,310 |
| Barbadians | 3.9 /100 | #231 | Tragic $51,236 |
| Sudanese | 3.9 /100 | #232 | Tragic $51,216 |
| Aleuts | 3.7 /100 | #233 | Tragic $51,168 |