Guyanese vs Jordanian Median Male Earnings
COMPARE
Guyanese
Jordanian
Median Male Earnings
Median Male Earnings Comparison
Guyanese
Jordanians
$50,613
MEDIAN MALE EARNINGS
2.2/ 100
METRIC RATING
242nd/ 347
METRIC RANK
$58,500
MEDIAN MALE EARNINGS
98.1/ 100
METRIC RATING
98th/ 347
METRIC RANK
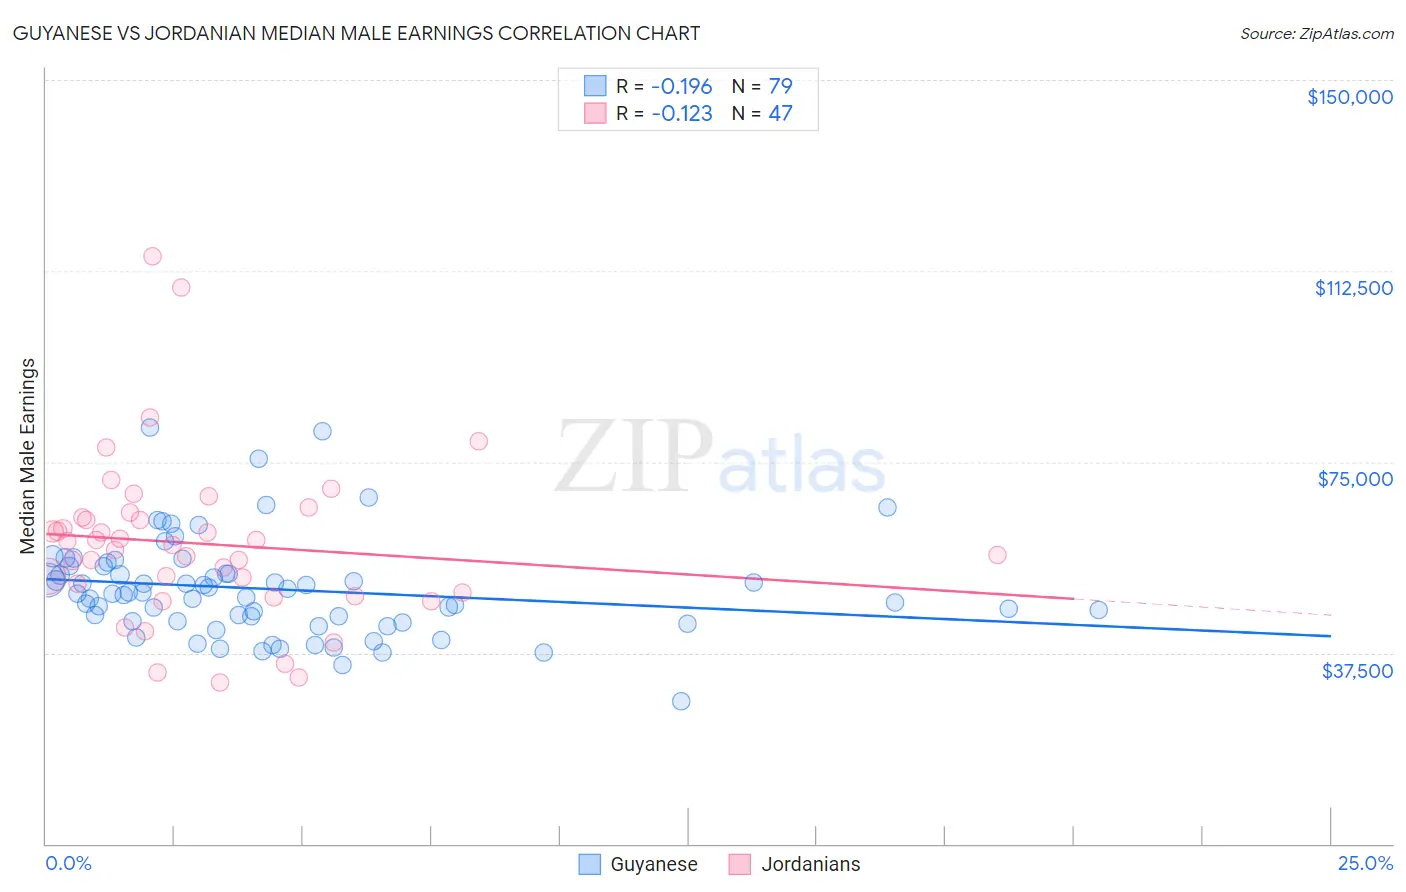
Guyanese vs Jordanian Median Male Earnings Correlation Chart
The statistical analysis conducted on geographies consisting of 176,926,771 people shows a poor negative correlation between the proportion of Guyanese and median male earnings in the United States with a correlation coefficient (R) of -0.196 and weighted average of $50,613. Similarly, the statistical analysis conducted on geographies consisting of 166,398,060 people shows a poor negative correlation between the proportion of Jordanians and median male earnings in the United States with a correlation coefficient (R) of -0.123 and weighted average of $58,500, a difference of 15.6%.
Median Male Earnings Correlation Summary
| Measurement | Guyanese | Jordanian |
| Minimum | $28,099 | $31,660 |
| Maximum | $81,815 | $115,416 |
| Range | $53,716 | $83,756 |
| Mean | $50,024 | $58,929 |
| Median | $49,104 | $58,675 |
| Interquartile 25% (IQ1) | $43,659 | $49,250 |
| Interquartile 75% (IQ3) | $54,533 | $63,996 |
| Interquartile Range (IQR) | $10,874 | $14,746 |
| Standard Deviation (Sample) | $9,787 | $16,248 |
| Standard Deviation (Population) | $9,725 | $16,074 |
Similar Demographics by Median Male Earnings
Demographics Similar to Guyanese by Median Male Earnings
In terms of median male earnings, the demographic groups most similar to Guyanese are French American Indian ($50,611, a difference of 0.0%), Immigrants from St. Vincent and the Grenadines ($50,665, a difference of 0.10%), Houma ($50,547, a difference of 0.13%), West Indian ($50,682, a difference of 0.14%), and Hawaiian ($50,488, a difference of 0.25%).
| Demographics | Rating | Rank | Median Male Earnings |
| Immigrants | Western Africa | 3.0 /100 | #235 | Tragic $50,940 |
| Pennsylvania Germans | 2.8 /100 | #236 | Tragic $50,878 |
| Immigrants | Barbados | 2.6 /100 | #237 | Tragic $50,795 |
| Malaysians | 2.5 /100 | #238 | Tragic $50,772 |
| Americans | 2.5 /100 | #239 | Tragic $50,761 |
| West Indians | 2.3 /100 | #240 | Tragic $50,682 |
| Immigrants | St. Vincent and the Grenadines | 2.3 /100 | #241 | Tragic $50,665 |
| Guyanese | 2.2 /100 | #242 | Tragic $50,613 |
| French American Indians | 2.2 /100 | #243 | Tragic $50,611 |
| Houma | 2.0 /100 | #244 | Tragic $50,547 |
| Hawaiians | 1.9 /100 | #245 | Tragic $50,488 |
| Immigrants | Ecuador | 1.9 /100 | #246 | Tragic $50,474 |
| Sub-Saharan Africans | 1.8 /100 | #247 | Tragic $50,408 |
| Immigrants | Guyana | 1.6 /100 | #248 | Tragic $50,321 |
| Immigrants | Burma/Myanmar | 1.6 /100 | #249 | Tragic $50,298 |
Demographics Similar to Jordanians by Median Male Earnings
In terms of median male earnings, the demographic groups most similar to Jordanians are Immigrants from Poland ($58,452, a difference of 0.080%), Assyrian/Chaldean/Syriac ($58,437, a difference of 0.11%), Northern European ($58,588, a difference of 0.15%), Immigrants from Brazil ($58,324, a difference of 0.30%), and Albanian ($58,680, a difference of 0.31%).
| Demographics | Rating | Rank | Median Male Earnings |
| Laotians | 99.2 /100 | #91 | Exceptional $59,351 |
| Immigrants | Kazakhstan | 99.1 /100 | #92 | Exceptional $59,278 |
| Immigrants | Southern Europe | 99.0 /100 | #93 | Exceptional $59,217 |
| Immigrants | North Macedonia | 99.0 /100 | #94 | Exceptional $59,189 |
| Immigrants | Lebanon | 98.6 /100 | #95 | Exceptional $58,835 |
| Albanians | 98.4 /100 | #96 | Exceptional $58,680 |
| Northern Europeans | 98.2 /100 | #97 | Exceptional $58,588 |
| Jordanians | 98.1 /100 | #98 | Exceptional $58,500 |
| Immigrants | Poland | 98.0 /100 | #99 | Exceptional $58,452 |
| Assyrians/Chaldeans/Syriacs | 97.9 /100 | #100 | Exceptional $58,437 |
| Immigrants | Brazil | 97.7 /100 | #101 | Exceptional $58,324 |
| Syrians | 97.4 /100 | #102 | Exceptional $58,187 |
| Poles | 97.3 /100 | #103 | Exceptional $58,139 |
| Armenians | 97.3 /100 | #104 | Exceptional $58,134 |
| Immigrants | Western Asia | 97.3 /100 | #105 | Exceptional $58,131 |