Creek vs Jordanian Median Male Earnings
COMPARE
Creek
Jordanian
Median Male Earnings
Median Male Earnings Comparison
Creek
Jordanians
$46,594
MEDIAN MALE EARNINGS
0.0/ 100
METRIC RATING
309th/ 347
METRIC RANK
$58,500
MEDIAN MALE EARNINGS
98.1/ 100
METRIC RATING
98th/ 347
METRIC RANK
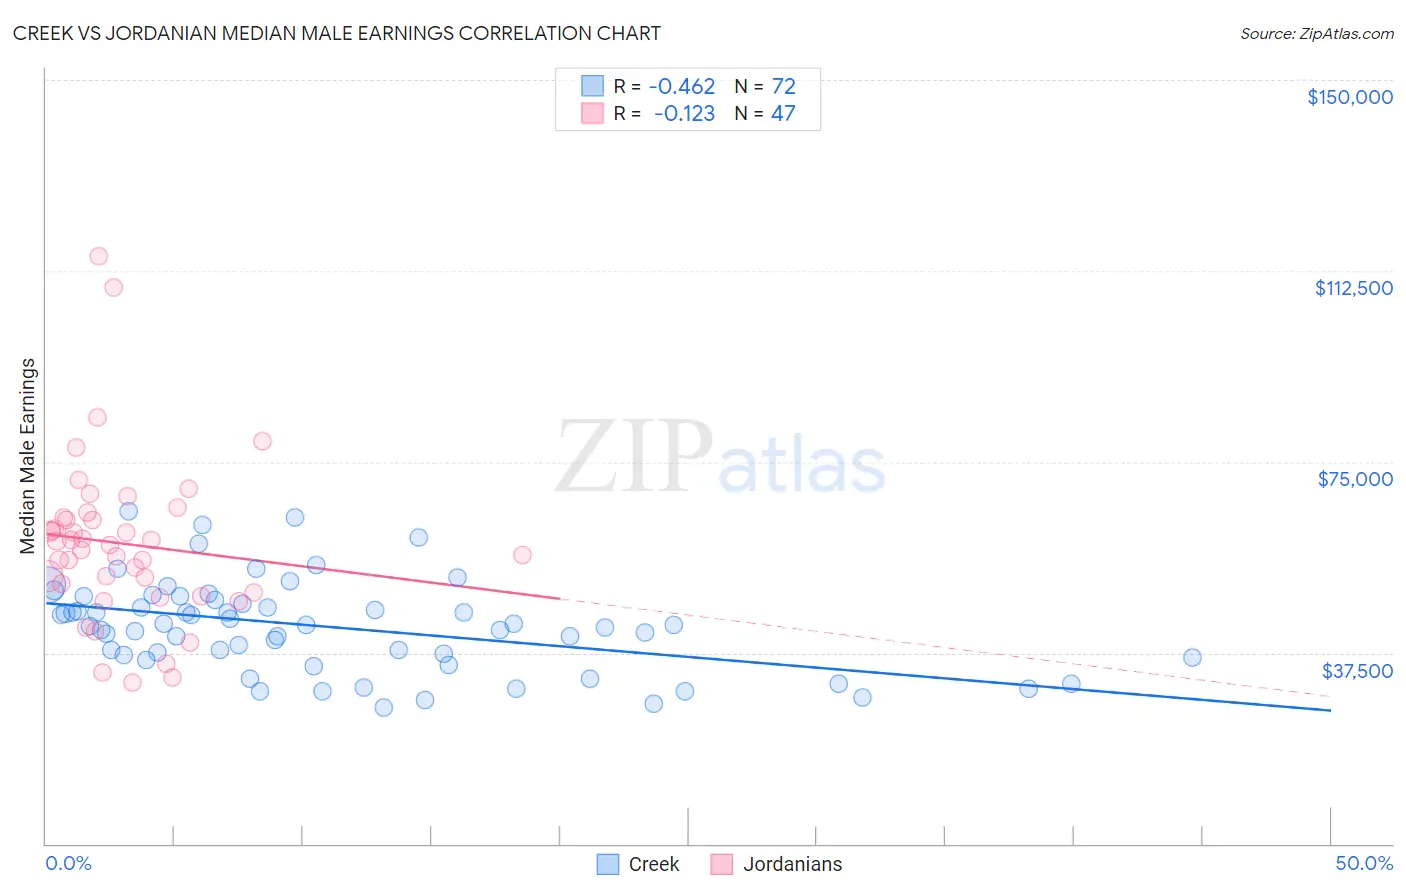
Creek vs Jordanian Median Male Earnings Correlation Chart
The statistical analysis conducted on geographies consisting of 178,430,593 people shows a moderate negative correlation between the proportion of Creek and median male earnings in the United States with a correlation coefficient (R) of -0.462 and weighted average of $46,594. Similarly, the statistical analysis conducted on geographies consisting of 166,398,060 people shows a poor negative correlation between the proportion of Jordanians and median male earnings in the United States with a correlation coefficient (R) of -0.123 and weighted average of $58,500, a difference of 25.6%.
Median Male Earnings Correlation Summary
| Measurement | Creek | Jordanian |
| Minimum | $26,855 | $31,660 |
| Maximum | $65,299 | $115,416 |
| Range | $38,444 | $83,756 |
| Mean | $42,595 | $58,929 |
| Median | $42,837 | $58,675 |
| Interquartile 25% (IQ1) | $36,835 | $49,250 |
| Interquartile 75% (IQ3) | $47,588 | $63,996 |
| Interquartile Range (IQR) | $10,753 | $14,746 |
| Standard Deviation (Sample) | $8,932 | $16,248 |
| Standard Deviation (Population) | $8,870 | $16,074 |
Similar Demographics by Median Male Earnings
Demographics Similar to Creek by Median Male Earnings
In terms of median male earnings, the demographic groups most similar to Creek are Cuban ($46,580, a difference of 0.030%), Ottawa ($46,611, a difference of 0.040%), Dutch West Indian ($46,656, a difference of 0.13%), Immigrants from Dominican Republic ($46,655, a difference of 0.13%), and Guatemalan ($46,736, a difference of 0.30%).
| Demographics | Rating | Rank | Median Male Earnings |
| Seminole | 0.1 /100 | #302 | Tragic $46,783 |
| Yaqui | 0.1 /100 | #303 | Tragic $46,777 |
| Bangladeshis | 0.1 /100 | #304 | Tragic $46,744 |
| Guatemalans | 0.0 /100 | #305 | Tragic $46,736 |
| Dutch West Indians | 0.0 /100 | #306 | Tragic $46,656 |
| Immigrants | Dominican Republic | 0.0 /100 | #307 | Tragic $46,655 |
| Ottawa | 0.0 /100 | #308 | Tragic $46,611 |
| Creek | 0.0 /100 | #309 | Tragic $46,594 |
| Cubans | 0.0 /100 | #310 | Tragic $46,580 |
| Apache | 0.0 /100 | #311 | Tragic $46,429 |
| Hispanics or Latinos | 0.0 /100 | #312 | Tragic $46,419 |
| Hondurans | 0.0 /100 | #313 | Tragic $46,374 |
| Chippewa | 0.0 /100 | #314 | Tragic $46,368 |
| Immigrants | Guatemala | 0.0 /100 | #315 | Tragic $46,244 |
| Immigrants | Caribbean | 0.0 /100 | #316 | Tragic $46,193 |
Demographics Similar to Jordanians by Median Male Earnings
In terms of median male earnings, the demographic groups most similar to Jordanians are Immigrants from Poland ($58,452, a difference of 0.080%), Assyrian/Chaldean/Syriac ($58,437, a difference of 0.11%), Northern European ($58,588, a difference of 0.15%), Immigrants from Brazil ($58,324, a difference of 0.30%), and Albanian ($58,680, a difference of 0.31%).
| Demographics | Rating | Rank | Median Male Earnings |
| Laotians | 99.2 /100 | #91 | Exceptional $59,351 |
| Immigrants | Kazakhstan | 99.1 /100 | #92 | Exceptional $59,278 |
| Immigrants | Southern Europe | 99.0 /100 | #93 | Exceptional $59,217 |
| Immigrants | North Macedonia | 99.0 /100 | #94 | Exceptional $59,189 |
| Immigrants | Lebanon | 98.6 /100 | #95 | Exceptional $58,835 |
| Albanians | 98.4 /100 | #96 | Exceptional $58,680 |
| Northern Europeans | 98.2 /100 | #97 | Exceptional $58,588 |
| Jordanians | 98.1 /100 | #98 | Exceptional $58,500 |
| Immigrants | Poland | 98.0 /100 | #99 | Exceptional $58,452 |
| Assyrians/Chaldeans/Syriacs | 97.9 /100 | #100 | Exceptional $58,437 |
| Immigrants | Brazil | 97.7 /100 | #101 | Exceptional $58,324 |
| Syrians | 97.4 /100 | #102 | Exceptional $58,187 |
| Poles | 97.3 /100 | #103 | Exceptional $58,139 |
| Armenians | 97.3 /100 | #104 | Exceptional $58,134 |
| Immigrants | Western Asia | 97.3 /100 | #105 | Exceptional $58,131 |