Immigrants from Israel vs Jordanian Median Male Earnings
COMPARE
Immigrants from Israel
Jordanian
Median Male Earnings
Median Male Earnings Comparison
Immigrants from Israel
Jordanians
$68,716
MEDIAN MALE EARNINGS
100.0/ 100
METRIC RATING
10th/ 347
METRIC RANK
$58,500
MEDIAN MALE EARNINGS
98.1/ 100
METRIC RATING
98th/ 347
METRIC RANK
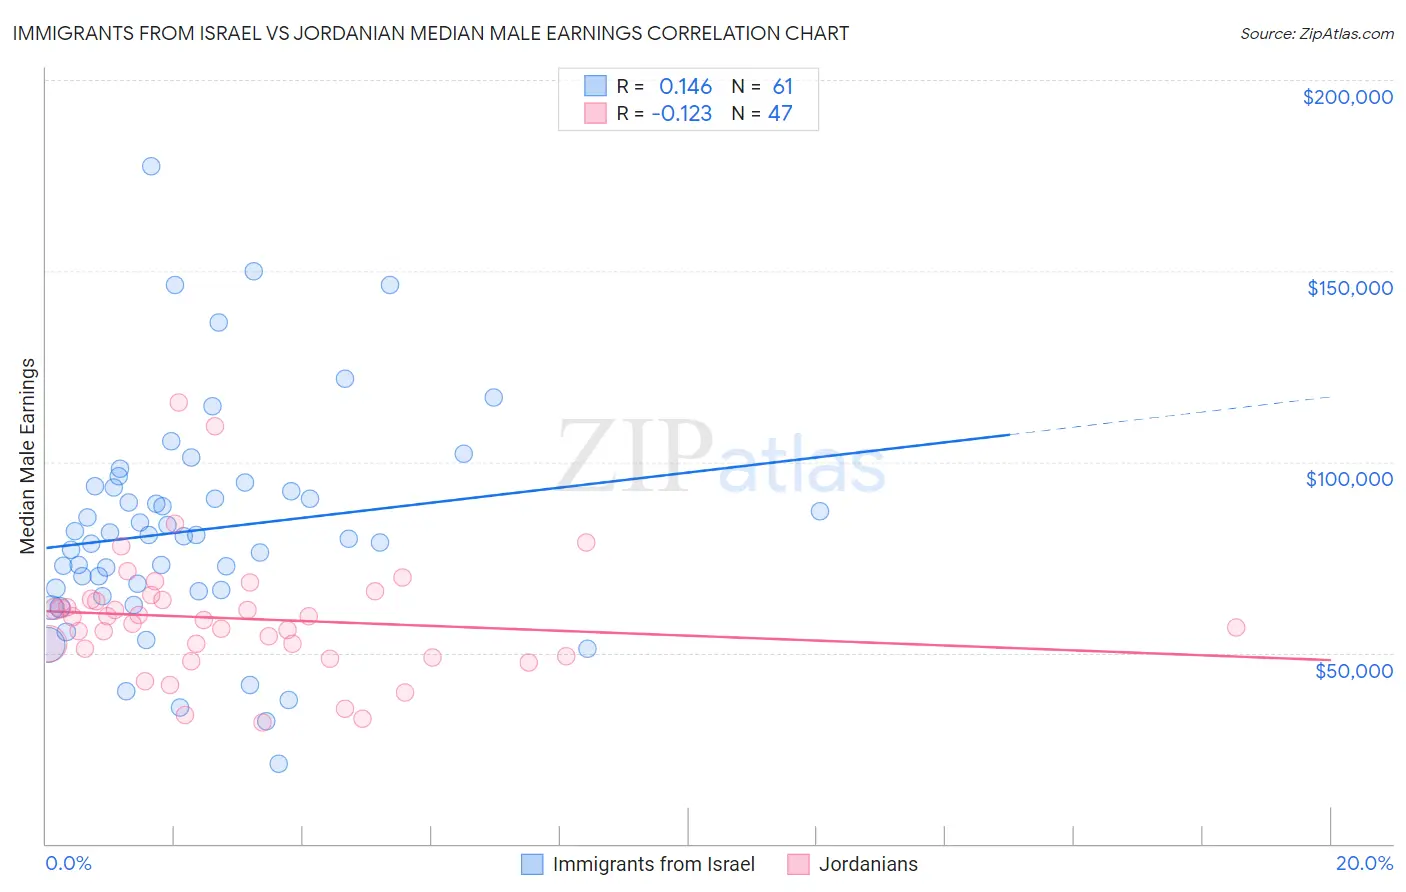
Immigrants from Israel vs Jordanian Median Male Earnings Correlation Chart
The statistical analysis conducted on geographies consisting of 209,997,525 people shows a poor positive correlation between the proportion of Immigrants from Israel and median male earnings in the United States with a correlation coefficient (R) of 0.146 and weighted average of $68,716. Similarly, the statistical analysis conducted on geographies consisting of 166,398,060 people shows a poor negative correlation between the proportion of Jordanians and median male earnings in the United States with a correlation coefficient (R) of -0.123 and weighted average of $58,500, a difference of 17.5%.
Median Male Earnings Correlation Summary
| Measurement | Immigrants from Israel | Jordanian |
| Minimum | $21,056 | $31,660 |
| Maximum | $177,500 | $115,416 |
| Range | $156,444 | $83,756 |
| Mean | $82,160 | $58,929 |
| Median | $80,676 | $58,675 |
| Interquartile 25% (IQ1) | $66,232 | $49,250 |
| Interquartile 75% (IQ3) | $93,582 | $63,996 |
| Interquartile Range (IQR) | $27,350 | $14,746 |
| Standard Deviation (Sample) | $29,382 | $16,248 |
| Standard Deviation (Population) | $29,141 | $16,074 |
Similar Demographics by Median Male Earnings
Demographics Similar to Immigrants from Israel by Median Male Earnings
In terms of median male earnings, the demographic groups most similar to Immigrants from Israel are Immigrants from South Central Asia ($68,960, a difference of 0.35%), Immigrants from Iran ($69,284, a difference of 0.83%), Immigrants from Ireland ($67,698, a difference of 1.5%), Immigrants from Australia ($67,634, a difference of 1.6%), and Immigrants from China ($67,353, a difference of 2.0%).
| Demographics | Rating | Rank | Median Male Earnings |
| Immigrants | Taiwan | 100.0 /100 | #3 | Exceptional $74,031 |
| Thais | 100.0 /100 | #4 | Exceptional $72,135 |
| Immigrants | Singapore | 100.0 /100 | #5 | Exceptional $71,348 |
| Iranians | 100.0 /100 | #6 | Exceptional $70,648 |
| Immigrants | Hong Kong | 100.0 /100 | #7 | Exceptional $70,146 |
| Immigrants | Iran | 100.0 /100 | #8 | Exceptional $69,284 |
| Immigrants | South Central Asia | 100.0 /100 | #9 | Exceptional $68,960 |
| Immigrants | Israel | 100.0 /100 | #10 | Exceptional $68,716 |
| Immigrants | Ireland | 100.0 /100 | #11 | Exceptional $67,698 |
| Immigrants | Australia | 100.0 /100 | #12 | Exceptional $67,634 |
| Immigrants | China | 100.0 /100 | #13 | Exceptional $67,353 |
| Okinawans | 100.0 /100 | #14 | Exceptional $67,232 |
| Immigrants | Eastern Asia | 100.0 /100 | #15 | Exceptional $66,903 |
| Eastern Europeans | 100.0 /100 | #16 | Exceptional $66,472 |
| Immigrants | Belgium | 100.0 /100 | #17 | Exceptional $66,125 |
Demographics Similar to Jordanians by Median Male Earnings
In terms of median male earnings, the demographic groups most similar to Jordanians are Immigrants from Poland ($58,452, a difference of 0.080%), Assyrian/Chaldean/Syriac ($58,437, a difference of 0.11%), Northern European ($58,588, a difference of 0.15%), Immigrants from Brazil ($58,324, a difference of 0.30%), and Albanian ($58,680, a difference of 0.31%).
| Demographics | Rating | Rank | Median Male Earnings |
| Laotians | 99.2 /100 | #91 | Exceptional $59,351 |
| Immigrants | Kazakhstan | 99.1 /100 | #92 | Exceptional $59,278 |
| Immigrants | Southern Europe | 99.0 /100 | #93 | Exceptional $59,217 |
| Immigrants | North Macedonia | 99.0 /100 | #94 | Exceptional $59,189 |
| Immigrants | Lebanon | 98.6 /100 | #95 | Exceptional $58,835 |
| Albanians | 98.4 /100 | #96 | Exceptional $58,680 |
| Northern Europeans | 98.2 /100 | #97 | Exceptional $58,588 |
| Jordanians | 98.1 /100 | #98 | Exceptional $58,500 |
| Immigrants | Poland | 98.0 /100 | #99 | Exceptional $58,452 |
| Assyrians/Chaldeans/Syriacs | 97.9 /100 | #100 | Exceptional $58,437 |
| Immigrants | Brazil | 97.7 /100 | #101 | Exceptional $58,324 |
| Syrians | 97.4 /100 | #102 | Exceptional $58,187 |
| Poles | 97.3 /100 | #103 | Exceptional $58,139 |
| Armenians | 97.3 /100 | #104 | Exceptional $58,134 |
| Immigrants | Western Asia | 97.3 /100 | #105 | Exceptional $58,131 |