Inupiat vs Immigrants from Kenya Median Male Earnings
COMPARE
Inupiat
Immigrants from Kenya
Median Male Earnings
Median Male Earnings Comparison
Inupiat
Immigrants from Kenya
$47,281
MEDIAN MALE EARNINGS
0.1/ 100
METRIC RATING
296th/ 347
METRIC RANK
$53,427
MEDIAN MALE EARNINGS
26.0/ 100
METRIC RATING
197th/ 347
METRIC RANK
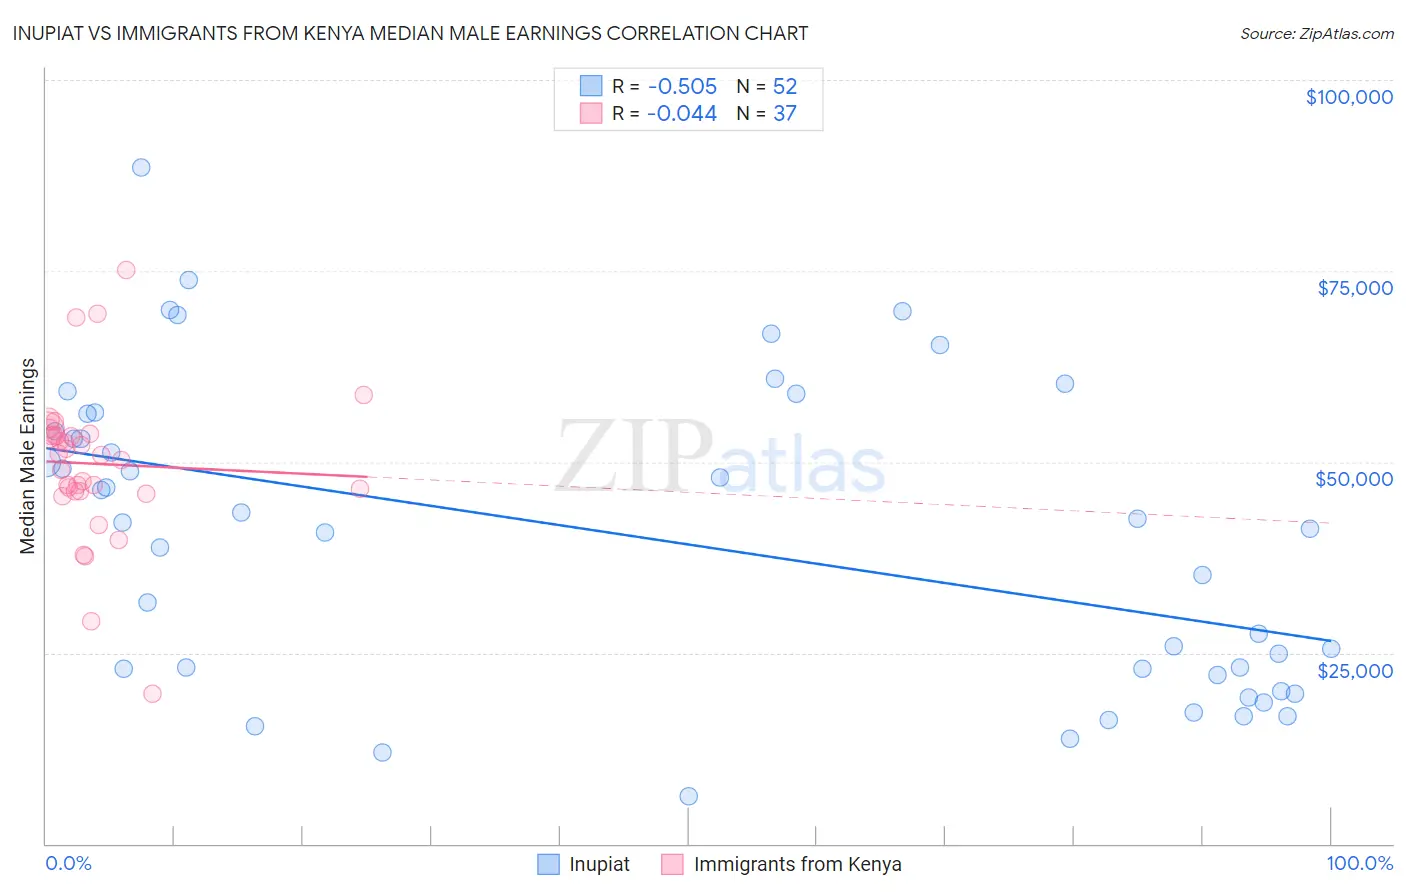
Inupiat vs Immigrants from Kenya Median Male Earnings Correlation Chart
The statistical analysis conducted on geographies consisting of 96,323,006 people shows a substantial negative correlation between the proportion of Inupiat and median male earnings in the United States with a correlation coefficient (R) of -0.505 and weighted average of $47,281. Similarly, the statistical analysis conducted on geographies consisting of 218,068,139 people shows no correlation between the proportion of Immigrants from Kenya and median male earnings in the United States with a correlation coefficient (R) of -0.044 and weighted average of $53,427, a difference of 13.0%.
Median Male Earnings Correlation Summary
| Measurement | Inupiat | Immigrants from Kenya |
| Minimum | $6,250 | $19,659 |
| Maximum | $88,594 | $75,179 |
| Range | $82,344 | $55,520 |
| Mean | $40,024 | $49,751 |
| Median | $41,688 | $50,930 |
| Interquartile 25% (IQ1) | $22,499 | $46,171 |
| Interquartile 75% (IQ3) | $55,179 | $53,573 |
| Interquartile Range (IQR) | $32,680 | $7,402 |
| Standard Deviation (Sample) | $19,878 | $9,966 |
| Standard Deviation (Population) | $19,686 | $9,831 |
Similar Demographics by Median Male Earnings
Demographics Similar to Inupiat by Median Male Earnings
In terms of median male earnings, the demographic groups most similar to Inupiat are Dominican ($47,204, a difference of 0.16%), Immigrants from Micronesia ($47,177, a difference of 0.22%), Central American Indian ($47,433, a difference of 0.32%), Immigrants from Nicaragua ($47,482, a difference of 0.43%), and Immigrants from Zaire ($47,070, a difference of 0.45%).
| Demographics | Rating | Rank | Median Male Earnings |
| Chickasaw | 0.1 /100 | #289 | Tragic $47,832 |
| Immigrants | Belize | 0.1 /100 | #290 | Tragic $47,809 |
| Choctaw | 0.1 /100 | #291 | Tragic $47,729 |
| Immigrants | Dominica | 0.1 /100 | #292 | Tragic $47,651 |
| Indonesians | 0.1 /100 | #293 | Tragic $47,503 |
| Immigrants | Nicaragua | 0.1 /100 | #294 | Tragic $47,482 |
| Central American Indians | 0.1 /100 | #295 | Tragic $47,433 |
| Inupiat | 0.1 /100 | #296 | Tragic $47,281 |
| Dominicans | 0.1 /100 | #297 | Tragic $47,204 |
| Immigrants | Micronesia | 0.1 /100 | #298 | Tragic $47,177 |
| Immigrants | Zaire | 0.1 /100 | #299 | Tragic $47,070 |
| U.S. Virgin Islanders | 0.1 /100 | #300 | Tragic $47,066 |
| Immigrants | Latin America | 0.1 /100 | #301 | Tragic $46,941 |
| Seminole | 0.1 /100 | #302 | Tragic $46,783 |
| Yaqui | 0.1 /100 | #303 | Tragic $46,777 |
Demographics Similar to Immigrants from Kenya by Median Male Earnings
In terms of median male earnings, the demographic groups most similar to Immigrants from Kenya are Immigrants from Africa ($53,457, a difference of 0.060%), Immigrants from the Azores ($53,503, a difference of 0.14%), Spanish ($53,576, a difference of 0.28%), Immigrants from Costa Rica ($53,237, a difference of 0.36%), and Tongan ($53,218, a difference of 0.39%).
| Demographics | Rating | Rank | Median Male Earnings |
| Uruguayans | 31.1 /100 | #190 | Fair $53,680 |
| Guamanians/Chamorros | 30.7 /100 | #191 | Fair $53,661 |
| Scotch-Irish | 30.6 /100 | #192 | Fair $53,658 |
| Kenyans | 30.4 /100 | #193 | Fair $53,647 |
| Spanish | 29.0 /100 | #194 | Fair $53,576 |
| Immigrants | Azores | 27.5 /100 | #195 | Fair $53,503 |
| Immigrants | Africa | 26.6 /100 | #196 | Fair $53,457 |
| Immigrants | Kenya | 26.0 /100 | #197 | Fair $53,427 |
| Immigrants | Costa Rica | 22.6 /100 | #198 | Fair $53,237 |
| Tongans | 22.3 /100 | #199 | Fair $53,218 |
| Immigrants | Thailand | 17.5 /100 | #200 | Poor $52,908 |
| Immigrants | Bosnia and Herzegovina | 16.9 /100 | #201 | Poor $52,869 |
| Immigrants | Uruguay | 16.8 /100 | #202 | Poor $52,860 |
| Panamanians | 16.5 /100 | #203 | Poor $52,835 |
| Ghanaians | 16.1 /100 | #204 | Poor $52,810 |