Northern European vs Immigrants from Kenya Median Male Earnings
COMPARE
Northern European
Immigrants from Kenya
Median Male Earnings
Median Male Earnings Comparison
Northern Europeans
Immigrants from Kenya
$58,588
MEDIAN MALE EARNINGS
98.2/ 100
METRIC RATING
97th/ 347
METRIC RANK
$53,427
MEDIAN MALE EARNINGS
26.0/ 100
METRIC RATING
197th/ 347
METRIC RANK
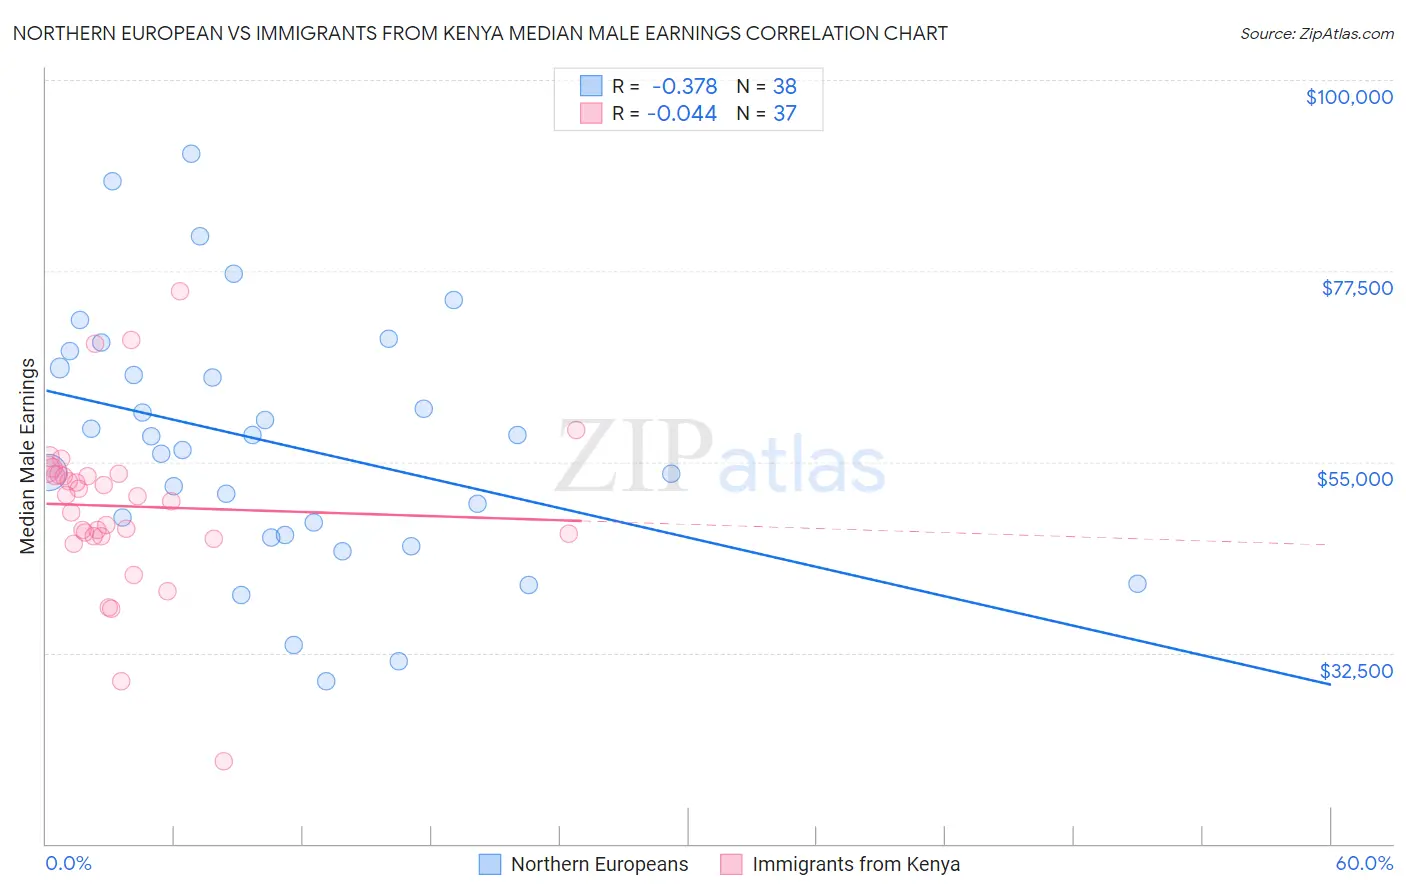
Northern European vs Immigrants from Kenya Median Male Earnings Correlation Chart
The statistical analysis conducted on geographies consisting of 405,884,643 people shows a mild negative correlation between the proportion of Northern Europeans and median male earnings in the United States with a correlation coefficient (R) of -0.378 and weighted average of $58,588. Similarly, the statistical analysis conducted on geographies consisting of 218,068,139 people shows no correlation between the proportion of Immigrants from Kenya and median male earnings in the United States with a correlation coefficient (R) of -0.044 and weighted average of $53,427, a difference of 9.7%.
Median Male Earnings Correlation Summary
| Measurement | Northern European | Immigrants from Kenya |
| Minimum | $29,177 | $19,659 |
| Maximum | $91,267 | $75,179 |
| Range | $62,090 | $55,520 |
| Mean | $57,049 | $49,751 |
| Median | $57,215 | $50,930 |
| Interquartile 25% (IQ1) | $46,389 | $46,171 |
| Interquartile 75% (IQ3) | $66,077 | $53,573 |
| Interquartile Range (IQR) | $19,687 | $7,402 |
| Standard Deviation (Sample) | $14,710 | $9,966 |
| Standard Deviation (Population) | $14,515 | $9,831 |
Similar Demographics by Median Male Earnings
Demographics Similar to Northern Europeans by Median Male Earnings
In terms of median male earnings, the demographic groups most similar to Northern Europeans are Jordanian ($58,500, a difference of 0.15%), Albanian ($58,680, a difference of 0.16%), Immigrants from Poland ($58,452, a difference of 0.23%), Assyrian/Chaldean/Syriac ($58,437, a difference of 0.26%), and Immigrants from Lebanon ($58,835, a difference of 0.42%).
| Demographics | Rating | Rank | Median Male Earnings |
| Austrians | 99.2 /100 | #90 | Exceptional $59,359 |
| Laotians | 99.2 /100 | #91 | Exceptional $59,351 |
| Immigrants | Kazakhstan | 99.1 /100 | #92 | Exceptional $59,278 |
| Immigrants | Southern Europe | 99.0 /100 | #93 | Exceptional $59,217 |
| Immigrants | North Macedonia | 99.0 /100 | #94 | Exceptional $59,189 |
| Immigrants | Lebanon | 98.6 /100 | #95 | Exceptional $58,835 |
| Albanians | 98.4 /100 | #96 | Exceptional $58,680 |
| Northern Europeans | 98.2 /100 | #97 | Exceptional $58,588 |
| Jordanians | 98.1 /100 | #98 | Exceptional $58,500 |
| Immigrants | Poland | 98.0 /100 | #99 | Exceptional $58,452 |
| Assyrians/Chaldeans/Syriacs | 97.9 /100 | #100 | Exceptional $58,437 |
| Immigrants | Brazil | 97.7 /100 | #101 | Exceptional $58,324 |
| Syrians | 97.4 /100 | #102 | Exceptional $58,187 |
| Poles | 97.3 /100 | #103 | Exceptional $58,139 |
| Armenians | 97.3 /100 | #104 | Exceptional $58,134 |
Demographics Similar to Immigrants from Kenya by Median Male Earnings
In terms of median male earnings, the demographic groups most similar to Immigrants from Kenya are Immigrants from Africa ($53,457, a difference of 0.060%), Immigrants from the Azores ($53,503, a difference of 0.14%), Spanish ($53,576, a difference of 0.28%), Immigrants from Costa Rica ($53,237, a difference of 0.36%), and Tongan ($53,218, a difference of 0.39%).
| Demographics | Rating | Rank | Median Male Earnings |
| Uruguayans | 31.1 /100 | #190 | Fair $53,680 |
| Guamanians/Chamorros | 30.7 /100 | #191 | Fair $53,661 |
| Scotch-Irish | 30.6 /100 | #192 | Fair $53,658 |
| Kenyans | 30.4 /100 | #193 | Fair $53,647 |
| Spanish | 29.0 /100 | #194 | Fair $53,576 |
| Immigrants | Azores | 27.5 /100 | #195 | Fair $53,503 |
| Immigrants | Africa | 26.6 /100 | #196 | Fair $53,457 |
| Immigrants | Kenya | 26.0 /100 | #197 | Fair $53,427 |
| Immigrants | Costa Rica | 22.6 /100 | #198 | Fair $53,237 |
| Tongans | 22.3 /100 | #199 | Fair $53,218 |
| Immigrants | Thailand | 17.5 /100 | #200 | Poor $52,908 |
| Immigrants | Bosnia and Herzegovina | 16.9 /100 | #201 | Poor $52,869 |
| Immigrants | Uruguay | 16.8 /100 | #202 | Poor $52,860 |
| Panamanians | 16.5 /100 | #203 | Poor $52,835 |
| Ghanaians | 16.1 /100 | #204 | Poor $52,810 |