Bahamian vs Immigrants from Kenya Median Male Earnings
COMPARE
Bahamian
Immigrants from Kenya
Median Male Earnings
Median Male Earnings Comparison
Bahamians
Immigrants from Kenya
$44,756
MEDIAN MALE EARNINGS
0.0/ 100
METRIC RATING
332nd/ 347
METRIC RANK
$53,427
MEDIAN MALE EARNINGS
26.0/ 100
METRIC RATING
197th/ 347
METRIC RANK
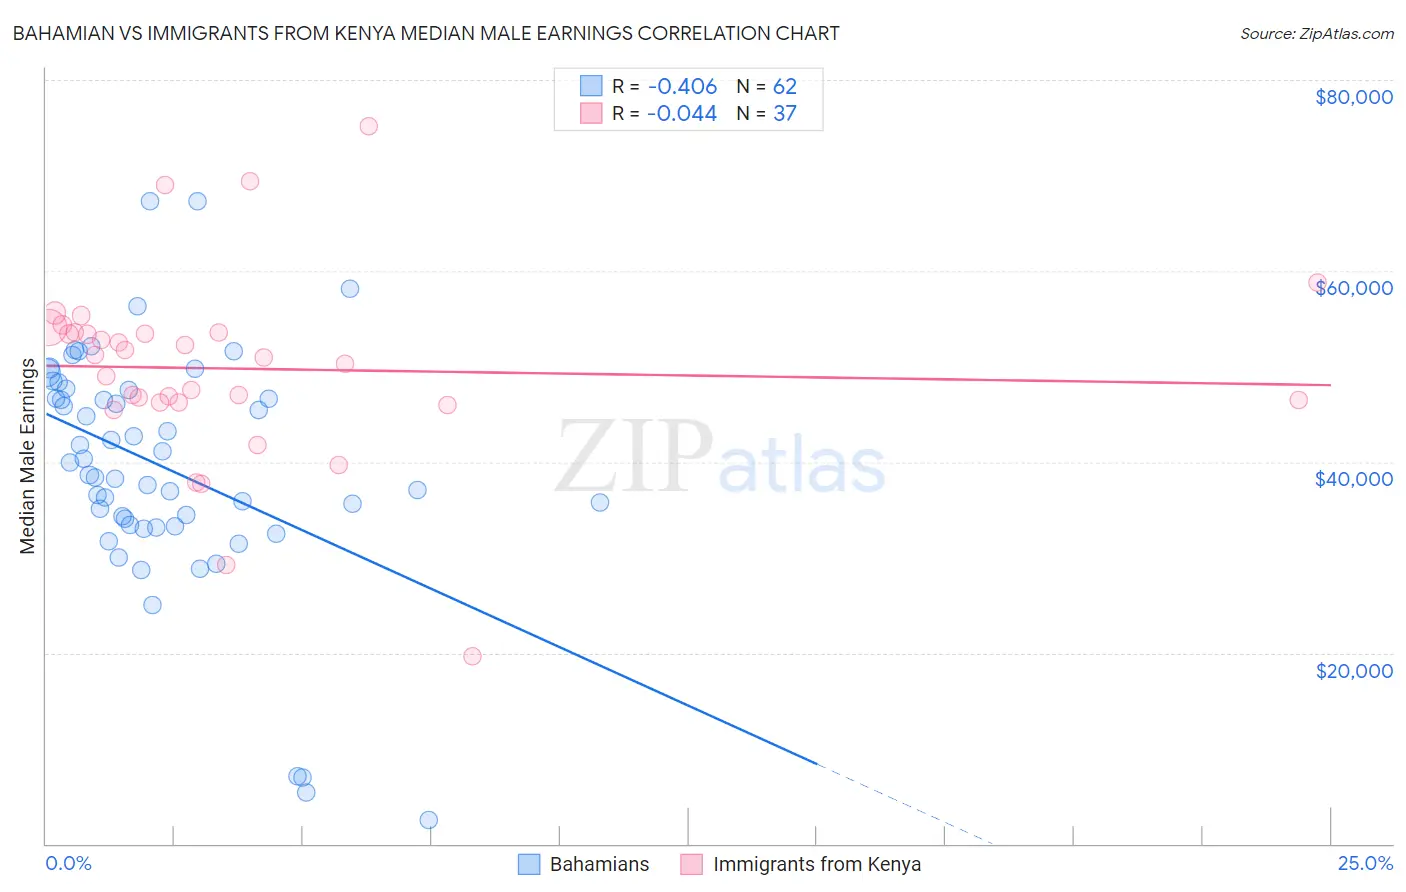
Bahamian vs Immigrants from Kenya Median Male Earnings Correlation Chart
The statistical analysis conducted on geographies consisting of 112,679,918 people shows a moderate negative correlation between the proportion of Bahamians and median male earnings in the United States with a correlation coefficient (R) of -0.406 and weighted average of $44,756. Similarly, the statistical analysis conducted on geographies consisting of 218,068,139 people shows no correlation between the proportion of Immigrants from Kenya and median male earnings in the United States with a correlation coefficient (R) of -0.044 and weighted average of $53,427, a difference of 19.4%.
Median Male Earnings Correlation Summary
| Measurement | Bahamian | Immigrants from Kenya |
| Minimum | $2,499 | $19,659 |
| Maximum | $67,317 | $75,179 |
| Range | $64,818 | $55,520 |
| Mean | $39,425 | $49,751 |
| Median | $39,316 | $50,930 |
| Interquartile 25% (IQ1) | $33,442 | $46,171 |
| Interquartile 75% (IQ3) | $47,537 | $53,573 |
| Interquartile Range (IQR) | $14,095 | $7,402 |
| Standard Deviation (Sample) | $12,607 | $9,966 |
| Standard Deviation (Population) | $12,505 | $9,831 |
Similar Demographics by Median Male Earnings
Demographics Similar to Bahamians by Median Male Earnings
In terms of median male earnings, the demographic groups most similar to Bahamians are Native/Alaskan ($44,775, a difference of 0.040%), Immigrants from Mexico ($44,960, a difference of 0.46%), Yakama ($45,002, a difference of 0.55%), Kiowa ($45,094, a difference of 0.76%), and Immigrants from Bahamas ($45,176, a difference of 0.94%).
| Demographics | Rating | Rank | Median Male Earnings |
| Yuman | 0.0 /100 | #325 | Tragic $45,446 |
| Immigrants | Haiti | 0.0 /100 | #326 | Tragic $45,266 |
| Immigrants | Bahamas | 0.0 /100 | #327 | Tragic $45,176 |
| Kiowa | 0.0 /100 | #328 | Tragic $45,094 |
| Yakama | 0.0 /100 | #329 | Tragic $45,002 |
| Immigrants | Mexico | 0.0 /100 | #330 | Tragic $44,960 |
| Natives/Alaskans | 0.0 /100 | #331 | Tragic $44,775 |
| Bahamians | 0.0 /100 | #332 | Tragic $44,756 |
| Immigrants | Congo | 0.0 /100 | #333 | Tragic $44,204 |
| Immigrants | Yemen | 0.0 /100 | #334 | Tragic $44,083 |
| Spanish American Indians | 0.0 /100 | #335 | Tragic $44,010 |
| Immigrants | Cuba | 0.0 /100 | #336 | Tragic $43,461 |
| Menominee | 0.0 /100 | #337 | Tragic $42,581 |
| Crow | 0.0 /100 | #338 | Tragic $42,434 |
| Pima | 0.0 /100 | #339 | Tragic $42,357 |
Demographics Similar to Immigrants from Kenya by Median Male Earnings
In terms of median male earnings, the demographic groups most similar to Immigrants from Kenya are Immigrants from Africa ($53,457, a difference of 0.060%), Immigrants from the Azores ($53,503, a difference of 0.14%), Spanish ($53,576, a difference of 0.28%), Immigrants from Costa Rica ($53,237, a difference of 0.36%), and Tongan ($53,218, a difference of 0.39%).
| Demographics | Rating | Rank | Median Male Earnings |
| Uruguayans | 31.1 /100 | #190 | Fair $53,680 |
| Guamanians/Chamorros | 30.7 /100 | #191 | Fair $53,661 |
| Scotch-Irish | 30.6 /100 | #192 | Fair $53,658 |
| Kenyans | 30.4 /100 | #193 | Fair $53,647 |
| Spanish | 29.0 /100 | #194 | Fair $53,576 |
| Immigrants | Azores | 27.5 /100 | #195 | Fair $53,503 |
| Immigrants | Africa | 26.6 /100 | #196 | Fair $53,457 |
| Immigrants | Kenya | 26.0 /100 | #197 | Fair $53,427 |
| Immigrants | Costa Rica | 22.6 /100 | #198 | Fair $53,237 |
| Tongans | 22.3 /100 | #199 | Fair $53,218 |
| Immigrants | Thailand | 17.5 /100 | #200 | Poor $52,908 |
| Immigrants | Bosnia and Herzegovina | 16.9 /100 | #201 | Poor $52,869 |
| Immigrants | Uruguay | 16.8 /100 | #202 | Poor $52,860 |
| Panamanians | 16.5 /100 | #203 | Poor $52,835 |
| Ghanaians | 16.1 /100 | #204 | Poor $52,810 |