Zip Codes with the Most Immigrants from Burma / Myanmar in Fort Wayne, IN

RELATED REPORTS & OPTIONS

Burma / Myanmar
Population
Families and Households
Female Fertility
Female Fertility (Unmarried)
Race (Community Size)
Race (Percentage)
Ancestry (Community Size)
AfricanAlbanianAmericanApacheArabArgentineanArmenianAustralianAustrianBelgianBhutaneseBlackfeetBrazilianBritishBulgarianBurmeseCanadianCarpatho RusynCelticCentral AmericanCentral American IndianCherokeeChickasawChippewaChoctawColombianCroatianCubanCzechCzechoslovakianDanishDominicanDutchEastern EuropeanEcuadorianEnglishEthiopianEuropeanFilipinoFinnishFrenchFrench American IndianFrench CanadianGermanGerman RussianGhanaianGreekGuamanian / ChamorroGuatemalanHaitianHonduranHungarianIndian (Asian)IndonesianIranianIraqiIrishIroquoisIsraeliItalianJamaicanJordanianKenyanKoreanLatvianLebaneseLiberianLithuanianLuxembourgerMacedonianMalaysianMexicanMexican American IndianMongolianMoroccanNative HawaiianNavajoNicaraguanNigerianNorthern EuropeanNorwegianOttawaPakistaniPalestinianPanamanianPennsylvania GermanPeruvianPolishPortuguesePuerto RicanRomanianRussianSalvadoranScandinavianScotch-IrishScottishSerbianSiouxSlavicSlovakSloveneSouth AfricanSouth AmericanSouth American IndianSpaniardSpanishSri LankanSubsaharan AfricanSudaneseSwedishSwissSyrianThaiTrinidadian and TobagonianUkrainianVenezuelanVietnameseWelshWest IndianYugoslavian
Ancestry (Percentage)
AfricanAlbanianAmericanApacheArabArgentineanArmenianAustralianAustrianBelgianBhutaneseBlackfeetBrazilianBritishBulgarianBurmeseCanadianCarpatho RusynCelticCentral AmericanCentral American IndianCherokeeChickasawChippewaChoctawColombianCroatianCubanCzechCzechoslovakianDanishDominicanDutchEastern EuropeanEcuadorianEnglishEthiopianEuropeanFilipinoFinnishFrenchFrench American IndianFrench CanadianGermanGerman RussianGhanaianGreekGuamanian / ChamorroGuatemalanHaitianHonduranHungarianIndian (Asian)IndonesianIranianIraqiIrishIroquoisIsraeliItalianJamaicanJordanianKenyanKoreanLatvianLebaneseLiberianLithuanianLuxembourgerMacedonianMalaysianMexicanMexican American IndianMongolianMoroccanNative HawaiianNavajoNicaraguanNigerianNorthern EuropeanNorwegianOttawaPakistaniPalestinianPanamanianPennsylvania GermanPeruvianPolishPortuguesePuerto RicanRomanianRussianSalvadoranScandinavianScotch-IrishScottishSerbianSiouxSlavicSlovakSloveneSouth AfricanSouth AmericanSouth American IndianSpaniardSpanishSri LankanSubsaharan AfricanSudaneseSwedishSwissSyrianThaiTrinidadian and TobagonianUkrainianVenezuelanVietnameseWelshWest IndianYugoslavian
Immigrant Origin (Total)
Immigrant Origin (Percentage)
Income
Income (Families)
Income (Households)
Poverty
Poverty (Families)
Unemployment
Employment Occupations
Employment Industries
Employer Class
Commute Time
Commute Means
School Enrollment
Education by Degree Field
Occupancy
Finances
Physical Characteristics
Fort Wayne
Compare Zip Codes
Comparison Subject

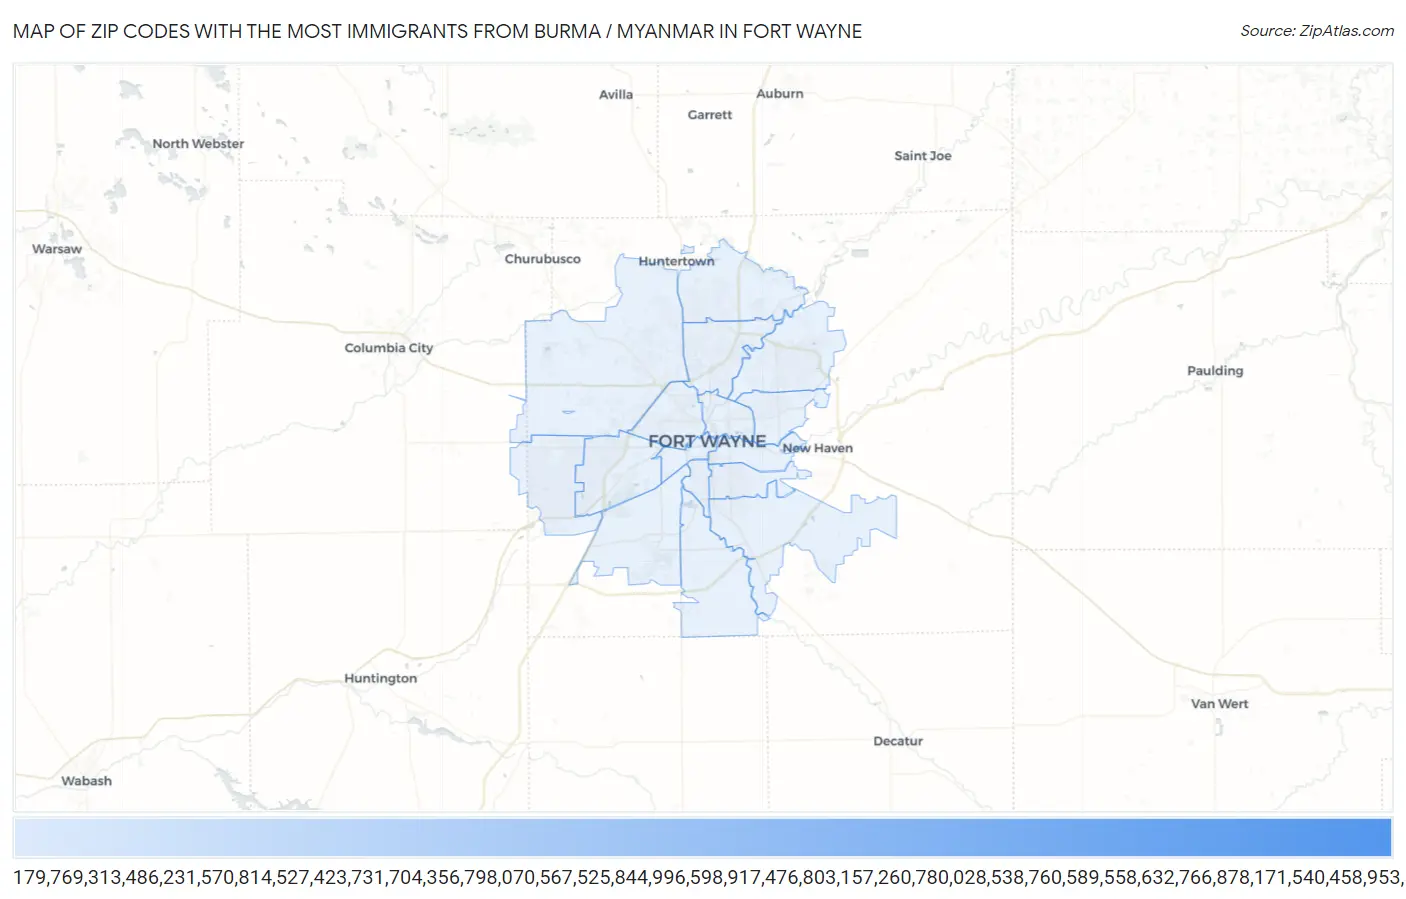
Map of Zip Codes with the Most Immigrants from Burma / Myanmar in Fort Wayne

0
1,500
Zip Codes with the Most Immigrants from Burma / Myanmar in Fort Wayne Map

Zip Codes with the Most Immigrants from Burma / Myanmar in Fort Wayne, IN

Zip Code Burma / Myanmar vs State vs National
1.468161,25716,289(7.72%)#-1157,000(0.80%)#0
2.4680674716,289(4.59%)#0157,000(0.48%)#1
3.4680557216,289(3.51%)#1157,000(0.36%)#2
4.4681556216,289(3.45%)#2157,000(0.36%)#3
5.4682548816,289(3.00%)#3157,000(0.31%)#4
6.4680821016,289(1.29%)#4157,000(0.13%)#5
7.4680717816,289(1.09%)#5157,000(0.11%)#6
8.4683516816,289(1.03%)#6157,000(0.11%)#7
9.4681811716,289(0.72%)#7157,000(0.07%)#8
10.468034716,289(0.29%)#8157,000(0.03%)#9
11.468042916,289(0.18%)#9157,000(0.02%)#10
12.468092216,289(0.14%)#10157,000(0.01%)#11
13.468022116,289(0.13%)#11157,000(0.01%)#12
14.468451116,289(0.07%)#12157,000(0.01%)#13

Common Questions

What are the Top 10 Zip Codes with the Most Immigrants from Burma / Myanmar in Fort Wayne, IN?
Top 10 Zip Codes with the Most Immigrants from Burma / Myanmar in Fort Wayne, IN are:
#1
1,257
#2
747
#3
572
#4
562
#5
488
#6
210
#7
178
#8
168
#9
117
#10
47
What zip code has the Most Immigrants from Burma / Myanmar in Fort Wayne, IN?
46816 has the Most Immigrants from Burma / Myanmar in Fort Wayne, IN with 1,257.
What is the Total Immigrants from Burma / Myanmar in Fort Wayne, IN?
Total Immigrants from Burma / Myanmar in Fort Wayne is 4,319.
What is the Total Immigrants from Burma / Myanmar in Indiana?
Total Immigrants from Burma / Myanmar in Indiana is 16,289.
What is the Total Immigrants from Burma / Myanmar in the United States?
Total Immigrants from Burma / Myanmar in the United States is 157,000.