Zip Codes with the Highest Percentage of Private Company Employees in Fort Wayne, IN

RELATED REPORTS & OPTIONS

Private Company Employees
Population
Families and Households
Female Fertility
Female Fertility (Unmarried)
Race (Community Size)
Race (Percentage)
Ancestry (Community Size)
AfricanAlbanianAmericanApacheArabArgentineanArmenianAustralianAustrianBelgianBhutaneseBlackfeetBrazilianBritishBulgarianBurmeseCanadianCarpatho RusynCelticCentral AmericanCentral American IndianCherokeeChickasawChippewaChoctawColombianCroatianCubanCzechCzechoslovakianDanishDominicanDutchEastern EuropeanEcuadorianEnglishEthiopianEuropeanFilipinoFinnishFrenchFrench American IndianFrench CanadianGermanGerman RussianGhanaianGreekGuamanian / ChamorroGuatemalanHaitianHonduranHungarianIndian (Asian)IndonesianIranianIraqiIrishIroquoisIsraeliItalianJamaicanJordanianKenyanKoreanLatvianLebaneseLiberianLithuanianLuxembourgerMacedonianMalaysianMexicanMexican American IndianMongolianMoroccanNative HawaiianNavajoNicaraguanNigerianNorthern EuropeanNorwegianOttawaPakistaniPalestinianPanamanianPennsylvania GermanPeruvianPolishPortuguesePuerto RicanRomanianRussianSalvadoranScandinavianScotch-IrishScottishSerbianSiouxSlavicSlovakSloveneSouth AfricanSouth AmericanSouth American IndianSpaniardSpanishSri LankanSubsaharan AfricanSudaneseSwedishSwissSyrianThaiTrinidadian and TobagonianUkrainianVenezuelanVietnameseWelshWest IndianYugoslavian
Ancestry (Percentage)
AfricanAlbanianAmericanApacheArabArgentineanArmenianAustralianAustrianBelgianBhutaneseBlackfeetBrazilianBritishBulgarianBurmeseCanadianCarpatho RusynCelticCentral AmericanCentral American IndianCherokeeChickasawChippewaChoctawColombianCroatianCubanCzechCzechoslovakianDanishDominicanDutchEastern EuropeanEcuadorianEnglishEthiopianEuropeanFilipinoFinnishFrenchFrench American IndianFrench CanadianGermanGerman RussianGhanaianGreekGuamanian / ChamorroGuatemalanHaitianHonduranHungarianIndian (Asian)IndonesianIranianIraqiIrishIroquoisIsraeliItalianJamaicanJordanianKenyanKoreanLatvianLebaneseLiberianLithuanianLuxembourgerMacedonianMalaysianMexicanMexican American IndianMongolianMoroccanNative HawaiianNavajoNicaraguanNigerianNorthern EuropeanNorwegianOttawaPakistaniPalestinianPanamanianPennsylvania GermanPeruvianPolishPortuguesePuerto RicanRomanianRussianSalvadoranScandinavianScotch-IrishScottishSerbianSiouxSlavicSlovakSloveneSouth AfricanSouth AmericanSouth American IndianSpaniardSpanishSri LankanSubsaharan AfricanSudaneseSwedishSwissSyrianThaiTrinidadian and TobagonianUkrainianVenezuelanVietnameseWelshWest IndianYugoslavian
Immigrant Origin (Total)
Immigrant Origin (Percentage)
Income
Income (Families)
Income (Households)
Poverty
Poverty (Families)
Unemployment
Employment Occupations
Employment Industries
Employer Class
Commute Time
Commute Means
School Enrollment
Education by Degree Field
Occupancy
Finances
Physical Characteristics
Fort Wayne
Compare Zip Codes
Comparison Subject

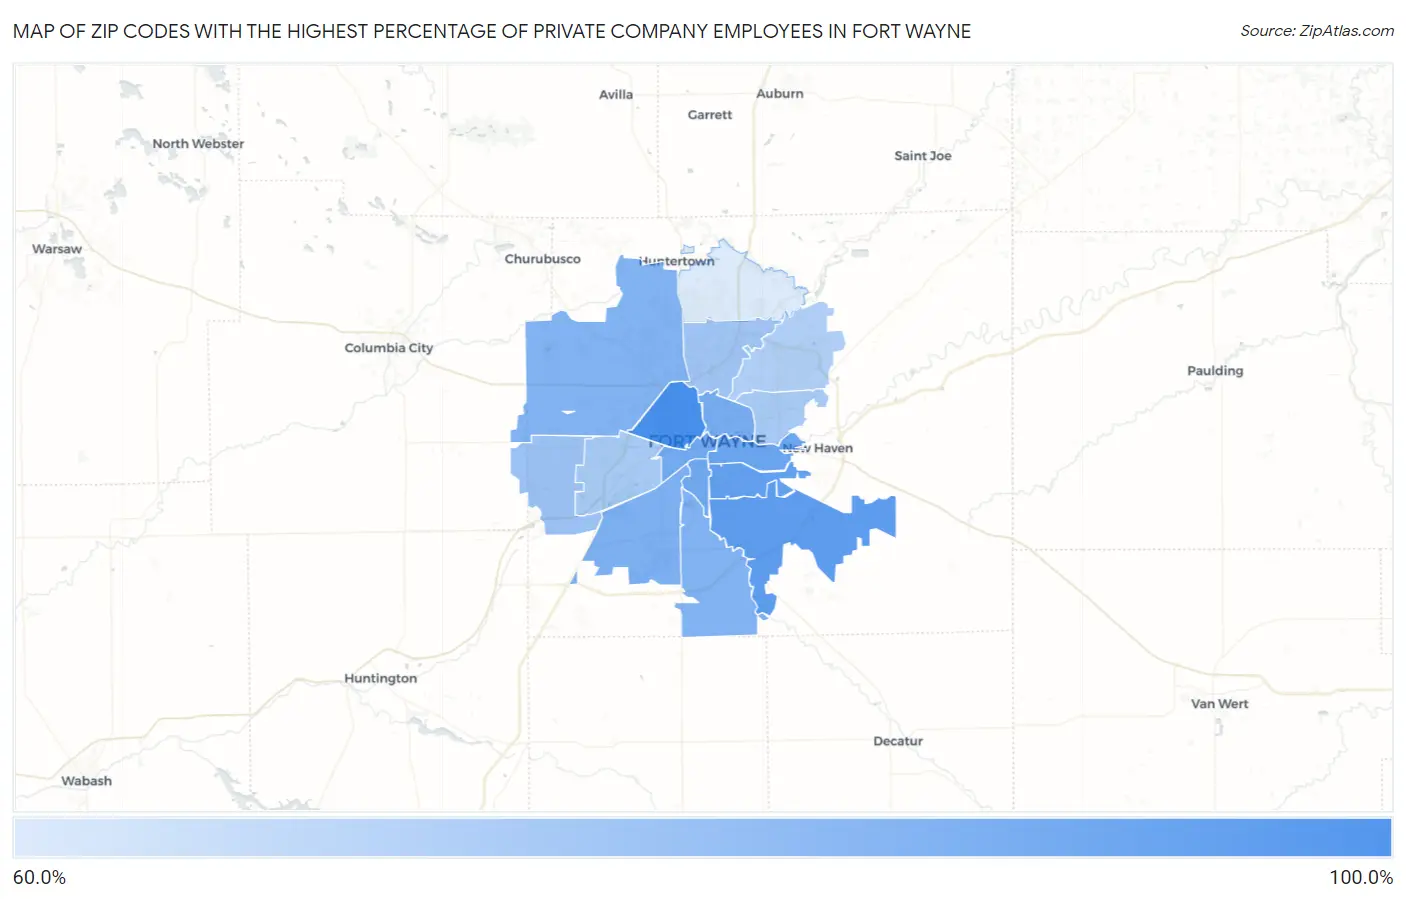
Map of Zip Codes with the Highest Percentage of Private Company Employees in Fort Wayne

0.0%
100.0%
Zip Codes with the Highest Percentage of Private Company Employees in Fort Wayne Map

Zip Codes with the Highest Percentage of Private Company Employees in Fort Wayne, IN

Zip Code % Private Company Employees vs State vs National
1.4680881.3%70.9%(+10.4)#6366.9%(+14.4)#1,952
2.4681678.4%70.9%(+7.40)#11766.9%(+11.5)#2,920
3.4680677.8%70.9%(+6.84)#13166.9%(+10.9)#3,197
4.4680376.8%70.9%(+5.83)#15366.9%(+9.89)#3,703
5.4680775.9%70.9%(+4.93)#18466.9%(+8.99)#4,253
6.4680275.9%70.9%(+4.93)#18566.9%(+8.99)#4,254
7.4680575.4%70.9%(+4.40)#20566.9%(+8.46)#4,624
8.4680974.9%70.9%(+3.92)#21966.9%(+7.97)#5,018
9.4681874.1%70.9%(+3.14)#25366.9%(+7.20)#5,696
10.4681974.1%70.9%(+3.14)#25466.9%(+7.20)#5,700
11.4681471.0%70.9%(+0.035)#39566.9%(+4.09)#9,065
12.4682570.3%70.9%(-0.658)#41766.9%(+3.40)#9,974
13.4681569.6%70.9%(-1.30)#44966.9%(+2.76)#10,823
14.4680469.6%70.9%(-1.31)#45066.9%(+2.75)#10,844
15.4683568.4%70.9%(-2.57)#50766.9%(+1.48)#12,535
16.4684563.4%70.9%(-7.54)#65066.9%(-3.48)#18,887

Common Questions

What are the Top 10 Zip Codes with the Highest Percentage of Private Company Employees in Fort Wayne, IN?
Top 10 Zip Codes with the Highest Percentage of Private Company Employees in Fort Wayne, IN are:
#1
81.3%
#2
78.4%
#3
77.8%
#4
76.8%
#5
75.9%
#6
75.9%
#7
75.4%
#8
74.9%
#9
74.1%
#10
74.1%
What zip code has the Highest Percentage of Private Company Employees in Fort Wayne, IN?
46808 has the Highest Percentage of Private Company Employees in Fort Wayne, IN with 81.3%.
What is the Percentage of Private Company Employees in Fort Wayne, IN?
Percentage of Private Company Employees in Fort Wayne is 73.1%.
What is the Percentage of Private Company Employees in Indiana?
Percentage of Private Company Employees in Indiana is 70.9%.
What is the Percentage of Private Company Employees in the United States?
Percentage of Private Company Employees in the United States is 66.9%.