Zip Codes with the Highest Costs of Housing as Percentage of Income in Fort Wayne, IN

RELATED REPORTS & OPTIONS

Highest Housing Costs / Income
Population
Families and Households
Female Fertility
Female Fertility (Unmarried)
Race (Community Size)
Race (Percentage)
Ancestry (Community Size)
AfricanAlbanianAmericanApacheArabArgentineanArmenianAustralianAustrianBelgianBhutaneseBlackfeetBrazilianBritishBulgarianBurmeseCanadianCarpatho RusynCelticCentral AmericanCentral American IndianCherokeeChickasawChippewaChoctawColombianCroatianCubanCzechCzechoslovakianDanishDominicanDutchEastern EuropeanEcuadorianEnglishEthiopianEuropeanFilipinoFinnishFrenchFrench American IndianFrench CanadianGermanGerman RussianGhanaianGreekGuamanian / ChamorroGuatemalanHaitianHonduranHungarianIndian (Asian)IndonesianIranianIraqiIrishIroquoisIsraeliItalianJamaicanJordanianKenyanKoreanLatvianLebaneseLiberianLithuanianLuxembourgerMacedonianMalaysianMexicanMexican American IndianMongolianMoroccanNative HawaiianNavajoNicaraguanNigerianNorthern EuropeanNorwegianOttawaPakistaniPalestinianPanamanianPennsylvania GermanPeruvianPolishPortuguesePuerto RicanRomanianRussianSalvadoranScandinavianScotch-IrishScottishSerbianSiouxSlavicSlovakSloveneSouth AfricanSouth AmericanSouth American IndianSpaniardSpanishSri LankanSubsaharan AfricanSudaneseSwedishSwissSyrianThaiTrinidadian and TobagonianUkrainianVenezuelanVietnameseWelshWest IndianYugoslavian
Ancestry (Percentage)
AfricanAlbanianAmericanApacheArabArgentineanArmenianAustralianAustrianBelgianBhutaneseBlackfeetBrazilianBritishBulgarianBurmeseCanadianCarpatho RusynCelticCentral AmericanCentral American IndianCherokeeChickasawChippewaChoctawColombianCroatianCubanCzechCzechoslovakianDanishDominicanDutchEastern EuropeanEcuadorianEnglishEthiopianEuropeanFilipinoFinnishFrenchFrench American IndianFrench CanadianGermanGerman RussianGhanaianGreekGuamanian / ChamorroGuatemalanHaitianHonduranHungarianIndian (Asian)IndonesianIranianIraqiIrishIroquoisIsraeliItalianJamaicanJordanianKenyanKoreanLatvianLebaneseLiberianLithuanianLuxembourgerMacedonianMalaysianMexicanMexican American IndianMongolianMoroccanNative HawaiianNavajoNicaraguanNigerianNorthern EuropeanNorwegianOttawaPakistaniPalestinianPanamanianPennsylvania GermanPeruvianPolishPortuguesePuerto RicanRomanianRussianSalvadoranScandinavianScotch-IrishScottishSerbianSiouxSlavicSlovakSloveneSouth AfricanSouth AmericanSouth American IndianSpaniardSpanishSri LankanSubsaharan AfricanSudaneseSwedishSwissSyrianThaiTrinidadian and TobagonianUkrainianVenezuelanVietnameseWelshWest IndianYugoslavian
Immigrant Origin (Total)
Immigrant Origin (Percentage)
Income
Income (Families)
Income (Households)
Poverty
Poverty (Families)
Unemployment
Employment Occupations
Employment Industries
Employer Class
Commute Time
Commute Means
School Enrollment
Education by Degree Field
Occupancy
Finances
Physical Characteristics
Fort Wayne
Compare Zip Codes
Comparison Subject

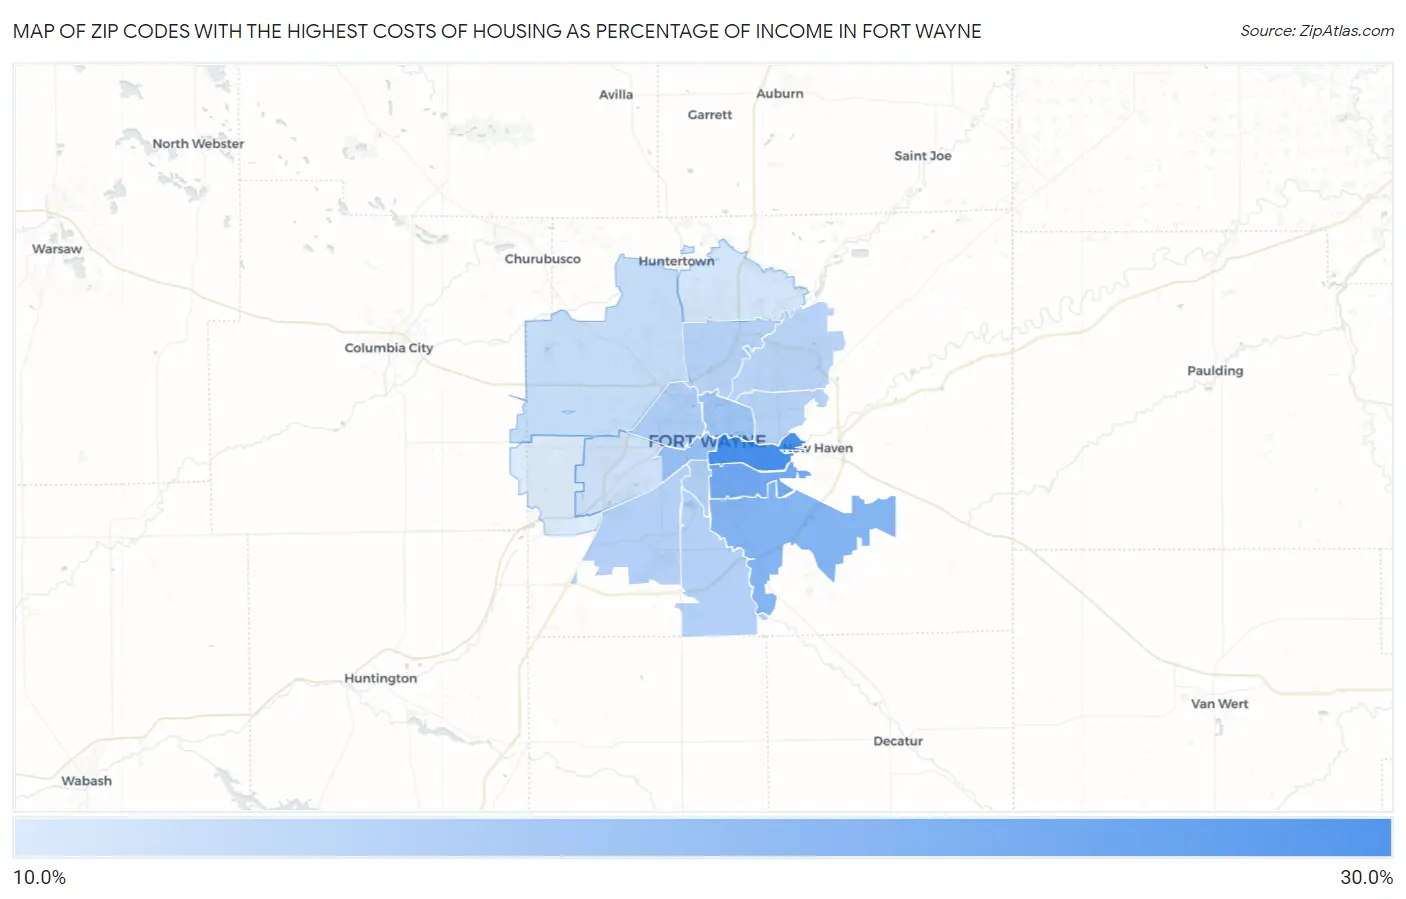
Map of Zip Codes with the Highest Costs of Housing as Percentage of Income in Fort Wayne

0.0%
30.0%
Zip Codes with the Highest Costs of Housing as Percentage of Income in Fort Wayne Map

Zip Codes with the Highest Costs of Housing as Percentage of Income in Fort Wayne, IN

Zip Code Housing Costs / Income vs State vs National
1.4680328.0%17.5%(+10.5)#1320.4%(+7.59)#1,527
2.4680624.0%17.5%(+6.47)#3820.4%(+3.59)#3,746
3.4681622.2%17.5%(+4.73)#6220.4%(+1.84)#5,494
4.4680220.7%17.5%(+3.21)#8020.4%(+0.320)#7,618
5.4680519.8%17.5%(+2.28)#10420.4%(-0.603)#9,209
6.4680818.6%17.5%(+1.09)#15220.4%(-1.80)#11,734
7.4680718.0%17.5%(+0.545)#17320.4%(-2.34)#12,972
8.4680918.0%17.5%(+0.468)#17820.4%(-2.42)#13,165
9.4681917.8%17.5%(+0.346)#18720.4%(-2.54)#13,475
10.4682517.7%17.5%(+0.244)#19720.4%(-2.64)#13,727
11.4681517.7%17.5%(+0.239)#19920.4%(-2.65)#13,739
12.4683517.4%17.5%(-0.069)#21620.4%(-2.96)#14,567
13.4681816.2%17.5%(-1.32)#33120.4%(-4.20)#17,853
14.4680415.4%17.5%(-2.06)#41620.4%(-4.95)#19,752
15.4684515.0%17.5%(-2.50)#44920.4%(-5.38)#20,915
16.4681414.2%17.5%(-3.25)#52420.4%(-6.13)#22,622

Common Questions

What are the Top 10 Zip Codes with the Highest Costs of Housing as Percentage of Income in Fort Wayne, IN?
Top 10 Zip Codes with the Highest Costs of Housing as Percentage of Income in Fort Wayne, IN are:
#1
28.0%
#2
24.0%
#3
22.2%
#4
20.7%
#5
19.8%
#6
18.6%
#7
18.0%
#8
18.0%
#9
17.8%
#10
17.7%
What zip code has the Highest Costs of Housing as Percentage of Income in Fort Wayne, IN?
46803 has the Highest Costs of Housing as Percentage of Income in Fort Wayne, IN with 28.0%.
What is the Average Housing Costs as Percentage of Income in Fort Wayne, IN?
Average Housing Costs as Percentage of Income in Fort Wayne is 18.5%.
What is the Average Housing Costs as Percentage of Income in Indiana?
Average Housing Costs as Percentage of Income in Indiana is 17.5%.
What is the Average Housing Costs as Percentage of Income in the United States?
Average Housing Costs as Percentage of Income in the United States is 20.4%.