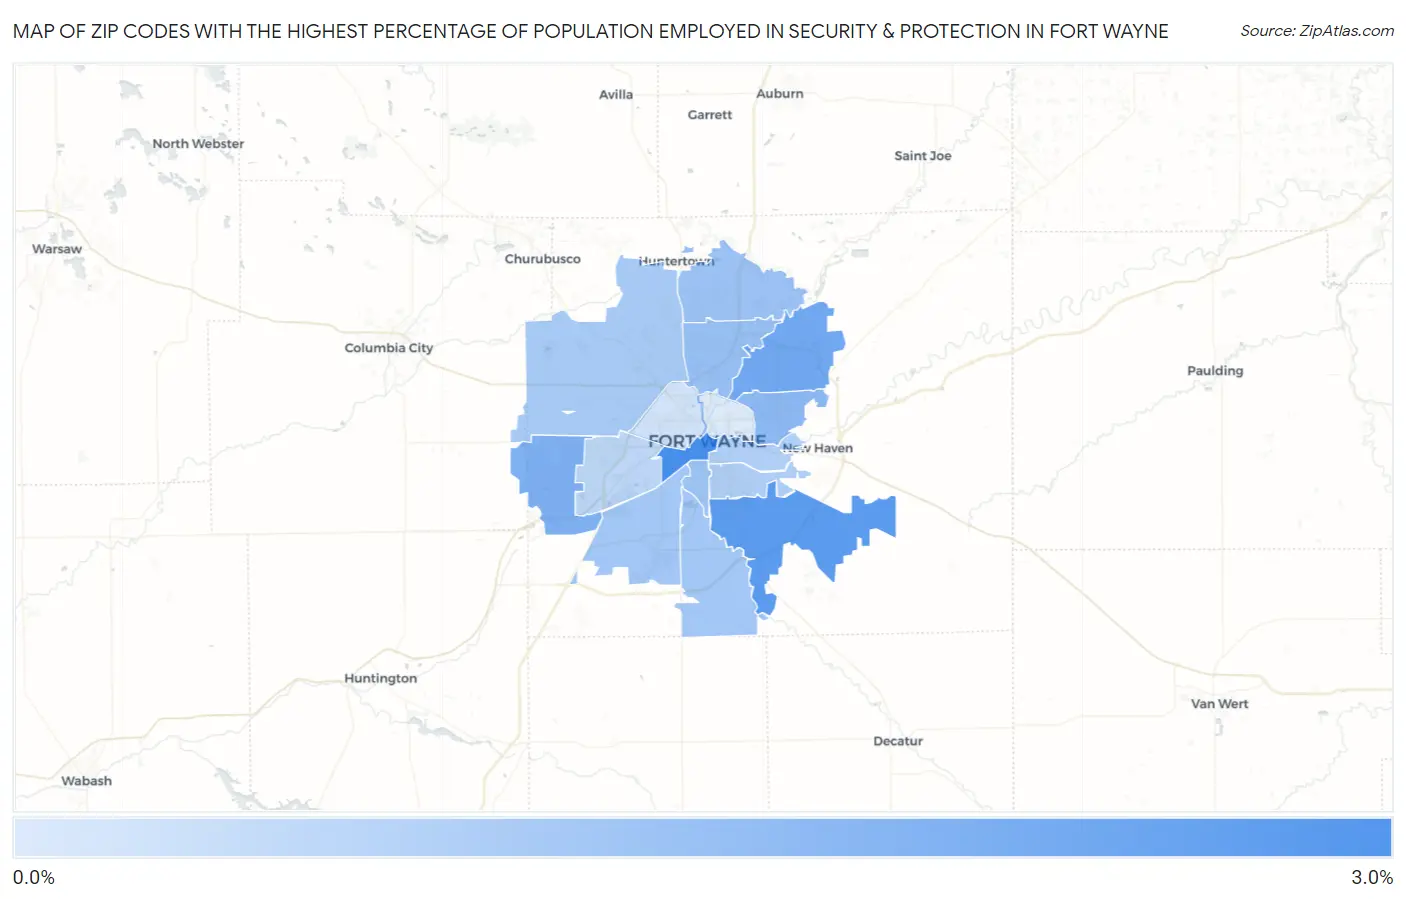
Zip Codes with the Highest Percentage of Population Employed in Security & Protection in Fort Wayne, IN
RELATED REPORTS & OPTIONS
Security & Protection
Fort Wayne
Compare Zip Codes
Map of Zip Codes with the Highest Percentage of Population Employed in Security & Protection in Fort Wayne
0.54%
2.6%
Zip Codes with the Highest Percentage of Population Employed in Security & Protection in Fort Wayne, IN
| Zip Code | % Employed | vs State | vs National | |
| 1. | 46802 | 2.6% | 1.8%(+0.776)#170 | 2.1%(+0.402)#9,247 |
| 2. | 46816 | 2.3% | 1.8%(+0.493)#204 | 2.1%(+0.119)#10,843 |
| 3. | 46835 | 2.0% | 1.8%(+0.209)#255 | 2.1%(-0.165)#12,660 |
| 4. | 46814 | 1.8% | 1.8%(+0.028)#291 | 2.1%(-0.345)#13,918 |
| 5. | 46815 | 1.6% | 1.8%(-0.170)#332 | 2.1%(-0.543)#15,378 |
| 6. | 46825 | 1.5% | 1.8%(-0.316)#364 | 2.1%(-0.690)#16,503 |
| 7. | 46845 | 1.4% | 1.8%(-0.380)#382 | 2.1%(-0.754)#16,988 |
| 8. | 46807 | 1.4% | 1.8%(-0.416)#396 | 2.1%(-0.790)#17,266 |
| 9. | 46819 | 1.3% | 1.8%(-0.454)#406 | 2.1%(-0.827)#17,570 |
| 10. | 46809 | 1.3% | 1.8%(-0.471)#411 | 2.1%(-0.844)#17,702 |
| 11. | 46818 | 1.3% | 1.8%(-0.523)#421 | 2.1%(-0.896)#18,120 |
| 12. | 46806 | 1.2% | 1.8%(-0.610)#435 | 2.1%(-0.984)#18,783 |
| 13. | 46803 | 1.1% | 1.8%(-0.663)#443 | 2.1%(-1.04)#19,197 |
| 14. | 46804 | 0.97% | 1.8%(-0.806)#477 | 2.1%(-1.18)#20,308 |
| 15. | 46808 | 0.70% | 1.8%(-1.07)#533 | 2.1%(-1.45)#22,085 |
| 16. | 46805 | 0.54% | 1.8%(-1.23)#562 | 2.1%(-1.61)#23,001 |
1
Common Questions
What are the Top 10 Zip Codes with the Highest Percentage of Population Employed in Security & Protection in Fort Wayne, IN?
Top 10 Zip Codes with the Highest Percentage of Population Employed in Security & Protection in Fort Wayne, IN are:
What zip code has the Highest Percentage of Population Employed in Security & Protection in Fort Wayne, IN?
46802 has the Highest Percentage of Population Employed in Security & Protection in Fort Wayne, IN with 2.6%.
What is the Percentage of Population Employed in Security & Protection in Fort Wayne, IN?
Percentage of Population Employed in Security & Protection in Fort Wayne is 1.3%.
What is the Percentage of Population Employed in Security & Protection in Indiana?
Percentage of Population Employed in Security & Protection in Indiana is 1.8%.
What is the Percentage of Population Employed in Security & Protection in the United States?
Percentage of Population Employed in Security & Protection in the United States is 2.1%.