Zip Codes with the Highest Percentage of Population Employed in Community & Social Service in Champaign, IL
RELATED REPORTS & OPTIONS
Community & Social Service
Champaign
Compare Zip Codes
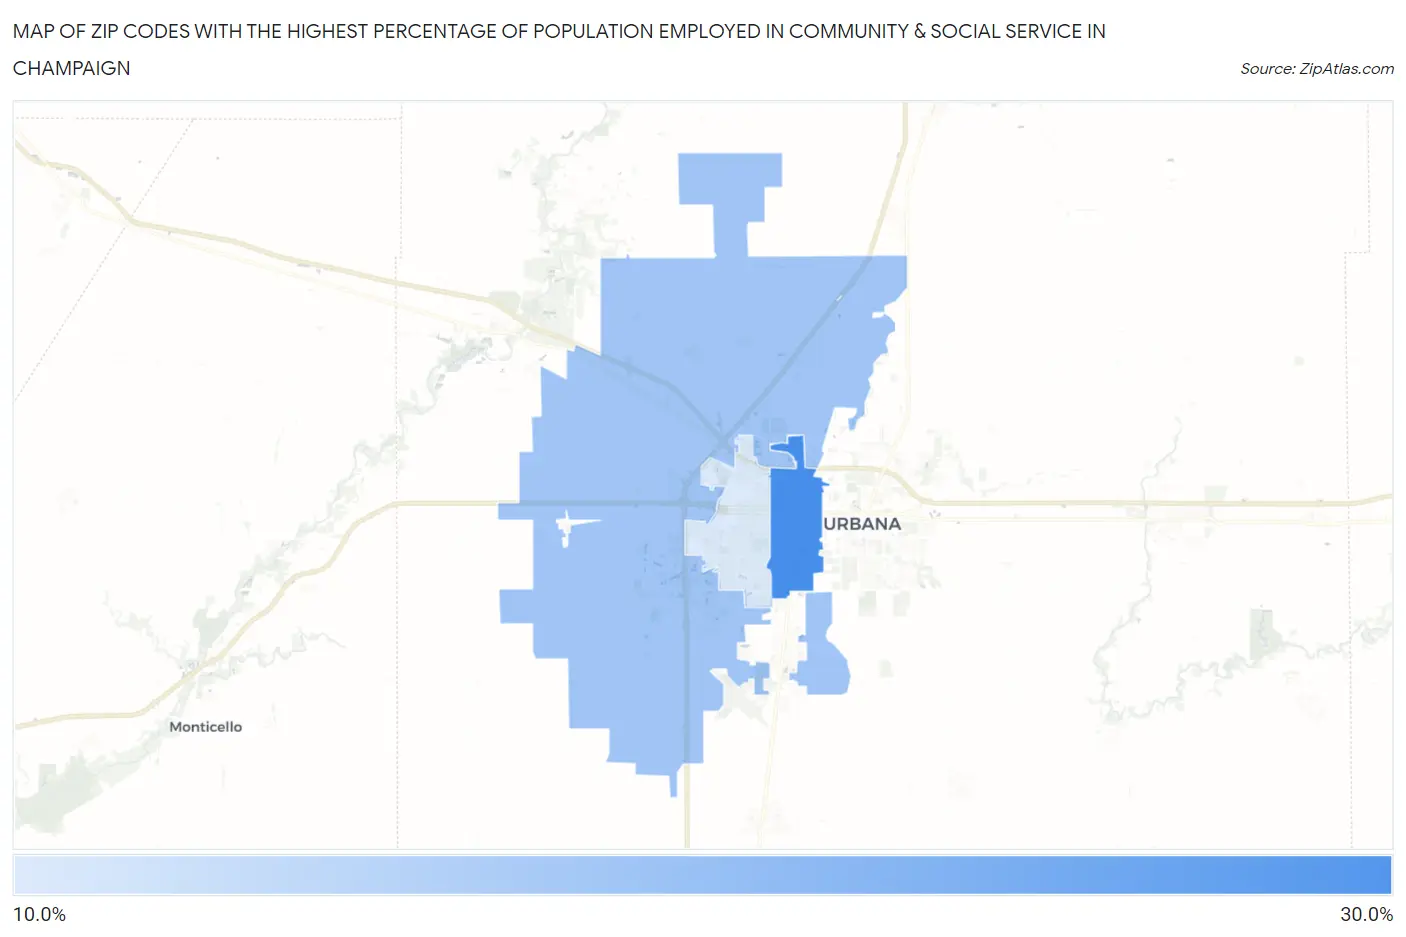
Map of Zip Codes with the Highest Percentage of Population Employed in Community & Social Service in Champaign
15.9%
26.7%
Zip Codes with the Highest Percentage of Population Employed in Community & Social Service in Champaign, IL
| Zip Code | % Employed | vs State | vs National | |
| 1. | 61820 | 26.7% | 11.3%(+15.4)#14 | 11.2%(+15.5)#805 |
| 2. | 61822 | 20.1% | 11.3%(+8.79)#44 | 11.2%(+8.85)#1,994 |
| 3. | 61821 | 15.9% | 11.3%(+4.60)#122 | 11.2%(+4.66)#4,165 |
1
Common Questions
What are the Top Zip Codes with the Highest Percentage of Population Employed in Community & Social Service in Champaign, IL?
Top Zip Codes with the Highest Percentage of Population Employed in Community & Social Service in Champaign, IL are:
What zip code has the Highest Percentage of Population Employed in Community & Social Service in Champaign, IL?
61820 has the Highest Percentage of Population Employed in Community & Social Service in Champaign, IL with 26.7%.
What is the Percentage of Population Employed in Community & Social Service in Champaign, IL?
Percentage of Population Employed in Community & Social Service in Champaign is 21.4%.
What is the Percentage of Population Employed in Community & Social Service in Illinois?
Percentage of Population Employed in Community & Social Service in Illinois is 11.3%.
What is the Percentage of Population Employed in Community & Social Service in the United States?
Percentage of Population Employed in Community & Social Service in the United States is 11.2%.