Zip Codes with the Highest Percentage of Population Employed in Accommodation & Food Services in Belleville, IL
RELATED REPORTS & OPTIONS
Accommodation & Food Services
Belleville
Compare Zip Codes
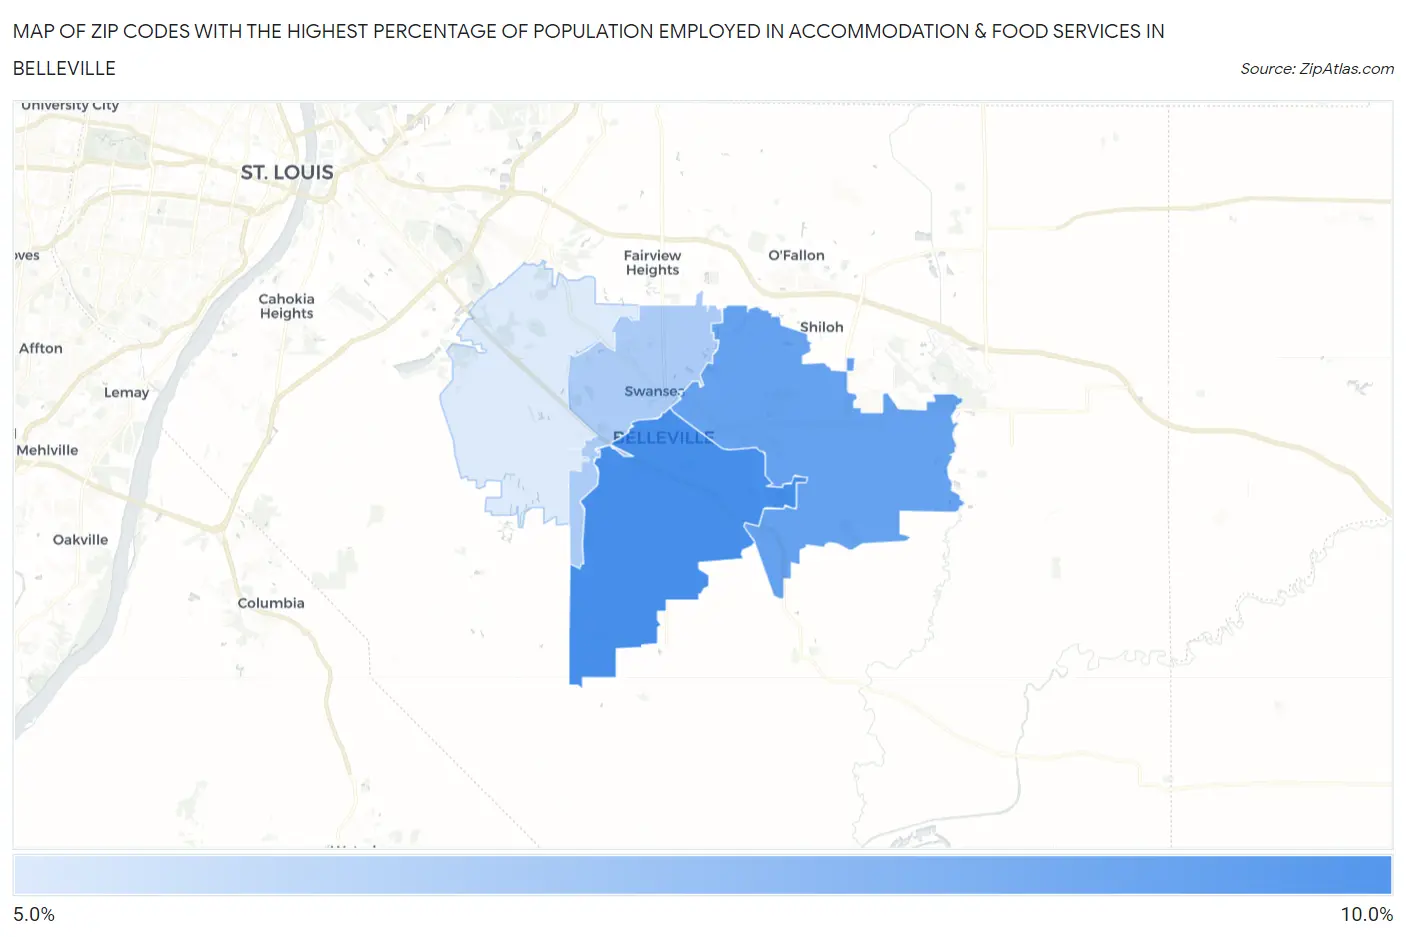
Map of Zip Codes with the Highest Percentage of Population Employed in Accommodation & Food Services in Belleville
5.7%
8.3%
Zip Codes with the Highest Percentage of Population Employed in Accommodation & Food Services in Belleville, IL
| Zip Code | % Employed | vs State | vs National | |
| 1. | 62220 | 8.3% | 6.5%(+1.88)#238 | 6.9%(+1.47)#7,105 |
| 2. | 62221 | 7.8% | 6.5%(+1.35)#290 | 6.9%(+0.939)#8,211 |
| 3. | 62226 | 6.6% | 6.5%(+0.145)#424 | 6.9%(-0.267)#11,476 |
| 4. | 62223 | 5.7% | 6.5%(-0.759)#538 | 6.9%(-1.17)#14,359 |
1
Common Questions
What are the Top 3 Zip Codes with the Highest Percentage of Population Employed in Accommodation & Food Services in Belleville, IL?
Top 3 Zip Codes with the Highest Percentage of Population Employed in Accommodation & Food Services in Belleville, IL are:
What zip code has the Highest Percentage of Population Employed in Accommodation & Food Services in Belleville, IL?
62220 has the Highest Percentage of Population Employed in Accommodation & Food Services in Belleville, IL with 8.3%.
What is the Percentage of Population Employed in Accommodation & Food Services in Belleville, IL?
Percentage of Population Employed in Accommodation & Food Services in Belleville is 6.7%.
What is the Percentage of Population Employed in Accommodation & Food Services in Illinois?
Percentage of Population Employed in Accommodation & Food Services in Illinois is 6.5%.
What is the Percentage of Population Employed in Accommodation & Food Services in the United States?
Percentage of Population Employed in Accommodation & Food Services in the United States is 6.9%.