Zip Codes with the Highest Percentage of Population Employed in Administrative & Support Services in Evanston, IL
RELATED REPORTS & OPTIONS
Administrative & Support Services
Evanston
Compare Zip Codes
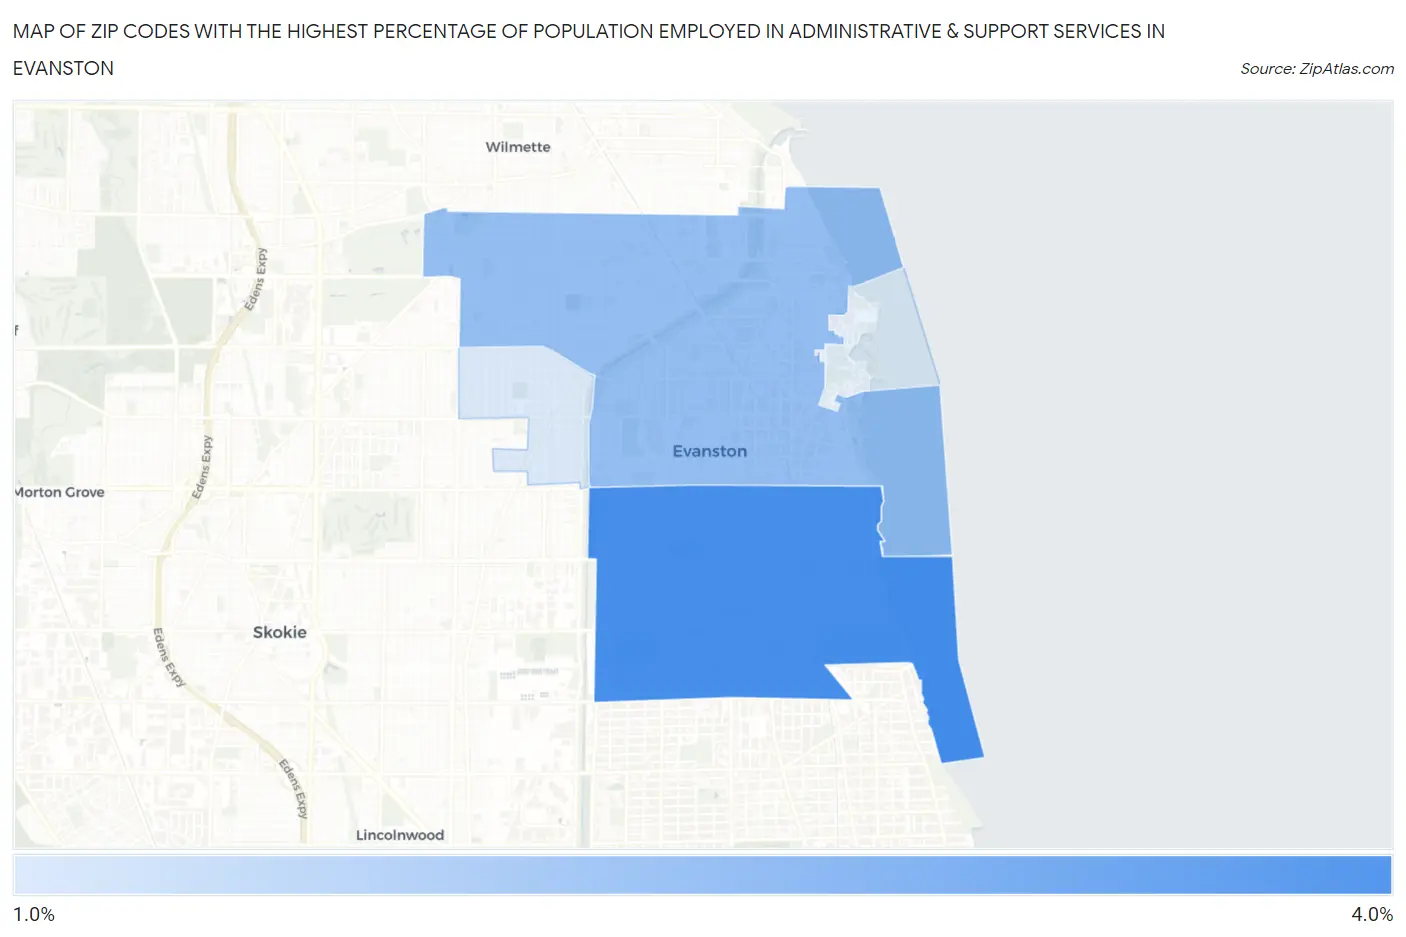
Map of Zip Codes with the Highest Percentage of Population Employed in Administrative & Support Services in Evanston
1.2%
3.8%
Zip Codes with the Highest Percentage of Population Employed in Administrative & Support Services in Evanston, IL
| Zip Code | % Employed | vs State | vs National | |
| 1. | 60202 | 3.8% | 4.0%(-0.177)#420 | 4.1%(-0.310)#11,367 |
| 2. | 60201 | 2.4% | 4.0%(-1.58)#757 | 4.1%(-1.71)#18,467 |
| 3. | 60203 | 1.2% | 4.0%(-2.85)#1,040 | 4.1%(-2.98)#23,950 |
1
Common Questions
What are the Top 3 Zip Codes with the Highest Percentage of Population Employed in Administrative & Support Services in Evanston, IL?
Top 3 Zip Codes with the Highest Percentage of Population Employed in Administrative & Support Services in Evanston, IL are:
What zip code has the Highest Percentage of Population Employed in Administrative & Support Services in Evanston, IL?
60202 has the Highest Percentage of Population Employed in Administrative & Support Services in Evanston, IL with 3.8%.
What is the Percentage of Population Employed in Administrative & Support Services in Evanston, IL?
Percentage of Population Employed in Administrative & Support Services in Evanston is 3.1%.
What is the Percentage of Population Employed in Administrative & Support Services in Illinois?
Percentage of Population Employed in Administrative & Support Services in Illinois is 4.0%.
What is the Percentage of Population Employed in Administrative & Support Services in the United States?
Percentage of Population Employed in Administrative & Support Services in the United States is 4.1%.