Zip Codes with the Highest Percentage of Population with a Degree in Arts and Humanities in Evanston, IL

RELATED REPORTS & OPTIONS

Arts and Humanities
Population
Families and Households
Female Fertility
Race (Community Size)
Race (Percentage)
Ancestry (Community Size)
AfricanAlbanianAmericanArabArgentineanArmenianAssyrian / Chaldean / SyriacAustralianAustrianBasqueBelgianBelizeanBhutaneseBolivianBrazilianBritishBulgarianBurmeseCanadianCentral AmericanCentral American IndianCherokeeChileanColombianCosta RicanCroatianCubanCzechCzechoslovakianDanishDominicanDutchEastern EuropeanEcuadorianEnglishEthiopianEuropeanFilipinoFinnishFrenchFrench CanadianGermanGhanaianGreekGuatemalanHaitianHungarianIndian (Asian)IranianIrishIsraeliItalianJamaicanJapaneseKenyanKoreanLatvianLebaneseLithuanianLuxembourgerMexicanMexican American IndianNigerianNorthern EuropeanNorwegianPakistaniPalestinianPennsylvania GermanPeruvianPolishPortuguesePuerto RicanRomanianRussianSalvadoranScandinavianScotch-IrishScottishSerbianSlavicSlovakSloveneSouth AmericanSpaniardSpanishSri LankanSubsaharan AfricanSwedishSwissSyrianThaiTurkishUkrainianUruguayanVenezuelanVietnameseWelshYugoslavian
Ancestry (Percentage)
AfricanAlbanianAmericanArabArgentineanArmenianAssyrian / Chaldean / SyriacAustralianAustrianBasqueBelgianBelizeanBhutaneseBolivianBrazilianBritishBulgarianBurmeseCanadianCentral AmericanCentral American IndianCherokeeChileanColombianCosta RicanCroatianCubanCzechCzechoslovakianDanishDominicanDutchEastern EuropeanEcuadorianEnglishEthiopianEuropeanFilipinoFinnishFrenchFrench CanadianGermanGhanaianGreekGuatemalanHaitianHungarianIndian (Asian)IranianIrishIsraeliItalianJamaicanJapaneseKenyanKoreanLatvianLebaneseLithuanianLuxembourgerMexicanMexican American IndianNigerianNorthern EuropeanNorwegianPakistaniPalestinianPennsylvania GermanPeruvianPolishPortuguesePuerto RicanRomanianRussianSalvadoranScandinavianScotch-IrishScottishSerbianSlavicSlovakSloveneSouth AmericanSpaniardSpanishSri LankanSubsaharan AfricanSwedishSwissSyrianThaiTurkishUkrainianUruguayanVenezuelanVietnameseWelshYugoslavian
Immigrant Origin (Total)
Immigrant Origin (Percentage)
Income
Income (Families)
Income (Households)
Poverty
Poverty (Families)
Unemployment
Employment Occupations
Employment Industries
Employer Class
Commute Time
Commute Means
School Enrollment
Education by Degree Field
Occupancy
Finances
Physical Characteristics
Evanston
Compare Zip Codes
Comparison Subject

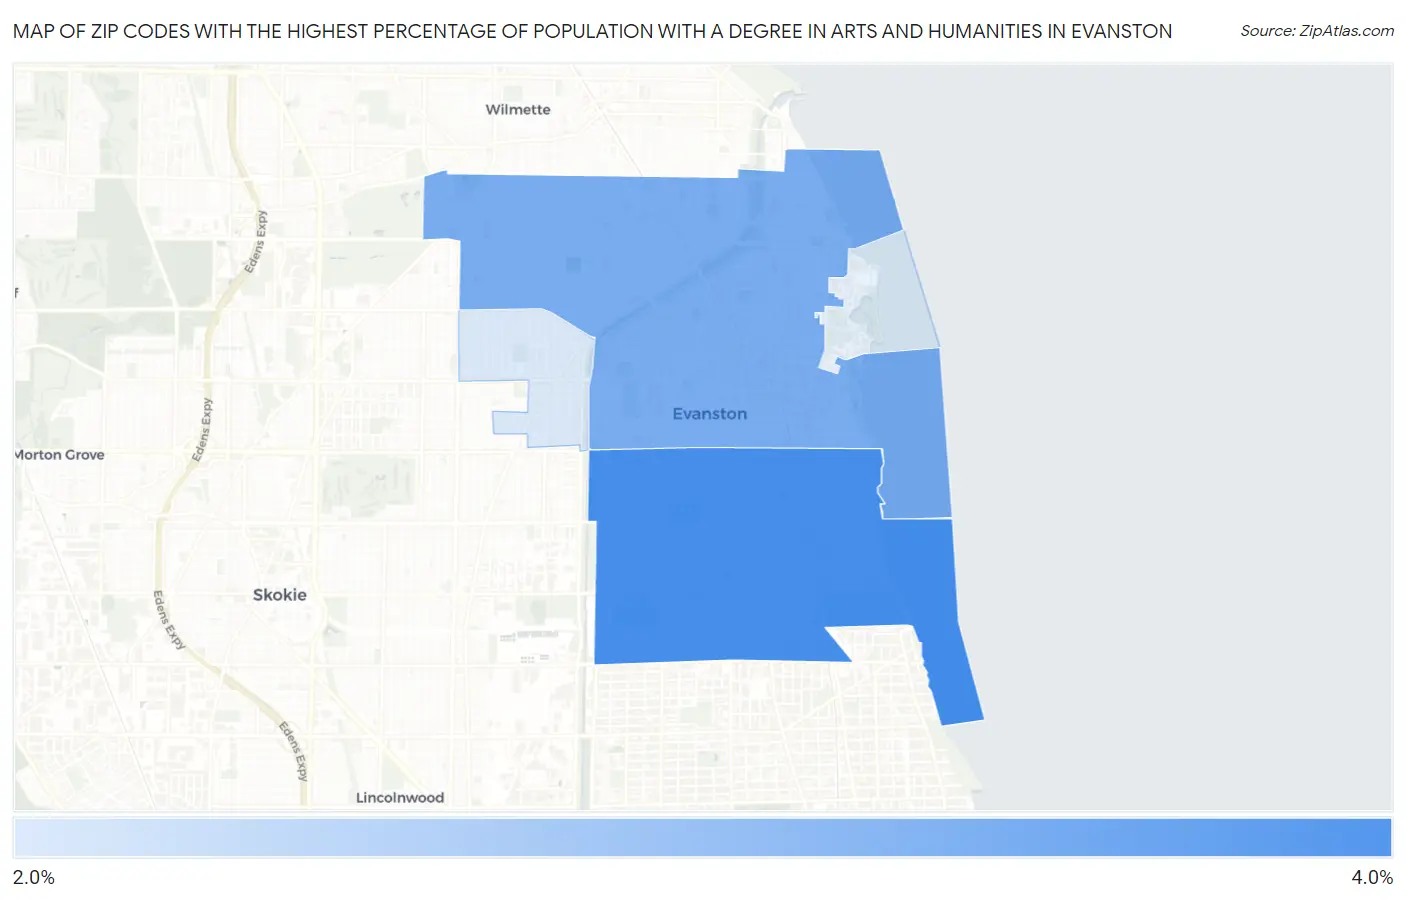
Map of Zip Codes with the Highest Percentage of Population with a Degree in Arts and Humanities in Evanston

0.0%
4.0%
Zip Codes with the Highest Percentage of Population with a Degree in Arts and Humanities in Evanston Map

Zip Codes with the Highest Percentage of Population with a Degree in Arts and Humanities in Evanston, IL

Zip Code % Graduates vs State vs National
1.602023.2%5.5%(-2.33)#9586.0%(-2.84)#22,350
2.602013.0%5.5%(-2.48)#9726.0%(-2.99)#22,653
3.602032.7%5.5%(-2.79)#9956.0%(-3.29)#23,206

Common Questions

What are the Top 3 Zip Codes with the Highest Percentage of Population with a Degree in Arts and Humanities in Evanston, IL?
Top 3 Zip Codes with the Highest Percentage of Population with a Degree in Arts and Humanities in Evanston, IL are:
#1
3.2%
#2
3.0%
#3
2.7%
What zip code has the Highest Percentage of Population with a Degree in Arts and Humanities in Evanston, IL?
60202 has the Highest Percentage of Population with a Degree in Arts and Humanities in Evanston, IL with 3.2%.
What is the Percentage of Population with a Degree in Arts and Humanities in Evanston, IL?
Percentage of Population with a Degree in Arts and Humanities in Evanston is 3.1%.
What is the Percentage of Population with a Degree in Arts and Humanities in Illinois?
Percentage of Population with a Degree in Arts and Humanities in Illinois is 5.5%.
What is the Percentage of Population with a Degree in Arts and Humanities in the United States?
Percentage of Population with a Degree in Arts and Humanities in the United States is 6.0%.