Zip Codes with the Highest Percentage of Population Employed in Food Preparation & Serving in Crystal Lake, IL
RELATED REPORTS & OPTIONS
Food Preparation & Serving
Crystal Lake
Compare Zip Codes
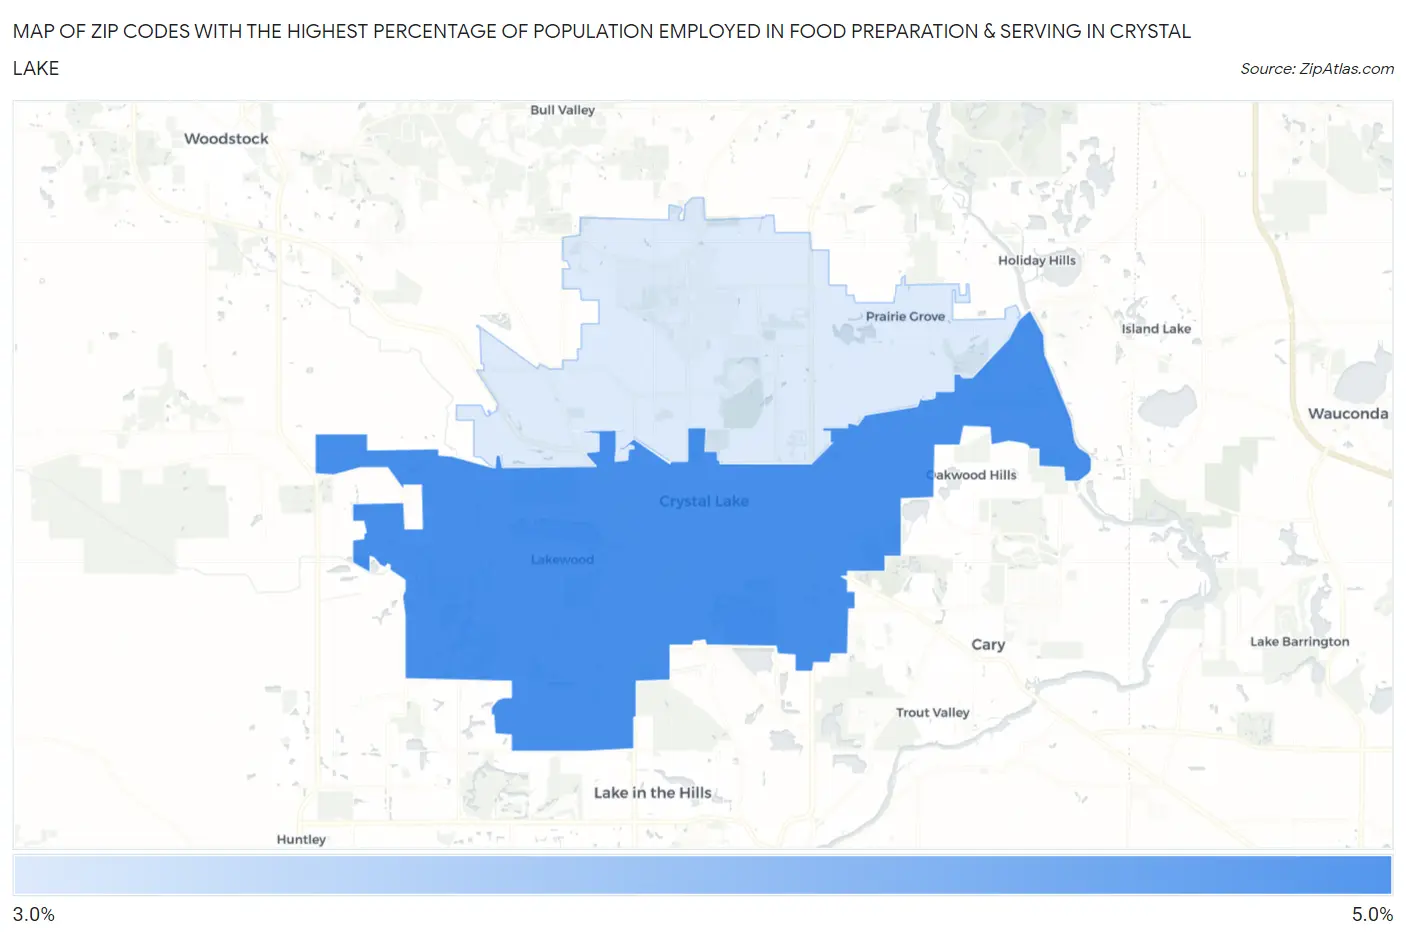
Map of Zip Codes with the Highest Percentage of Population Employed in Food Preparation & Serving in Crystal Lake
3.3%
4.0%
Zip Codes with the Highest Percentage of Population Employed in Food Preparation & Serving in Crystal Lake, IL
| Zip Code | % Employed | vs State | vs National | |
| 1. | 60014 | 4.0% | 5.0%(-0.991)#727 | 5.3%(-1.24)#16,958 |
| 2. | 60012 | 3.3% | 5.0%(-1.71)#860 | 5.3%(-1.96)#19,950 |
1
Common Questions
What are the Top Zip Codes with the Highest Percentage of Population Employed in Food Preparation & Serving in Crystal Lake, IL?
Top Zip Codes with the Highest Percentage of Population Employed in Food Preparation & Serving in Crystal Lake, IL are:
What zip code has the Highest Percentage of Population Employed in Food Preparation & Serving in Crystal Lake, IL?
60014 has the Highest Percentage of Population Employed in Food Preparation & Serving in Crystal Lake, IL with 4.0%.
What is the Percentage of Population Employed in Food Preparation & Serving in Crystal Lake, IL?
Percentage of Population Employed in Food Preparation & Serving in Crystal Lake is 4.0%.
What is the Percentage of Population Employed in Food Preparation & Serving in Illinois?
Percentage of Population Employed in Food Preparation & Serving in Illinois is 5.0%.
What is the Percentage of Population Employed in Food Preparation & Serving in the United States?
Percentage of Population Employed in Food Preparation & Serving in the United States is 5.3%.