Zip Codes with the Highest Percentage of Population Employed in Food Preparation & Serving in West Des Moines, IA
RELATED REPORTS & OPTIONS
Food Preparation & Serving
West Des Moines
Compare Zip Codes
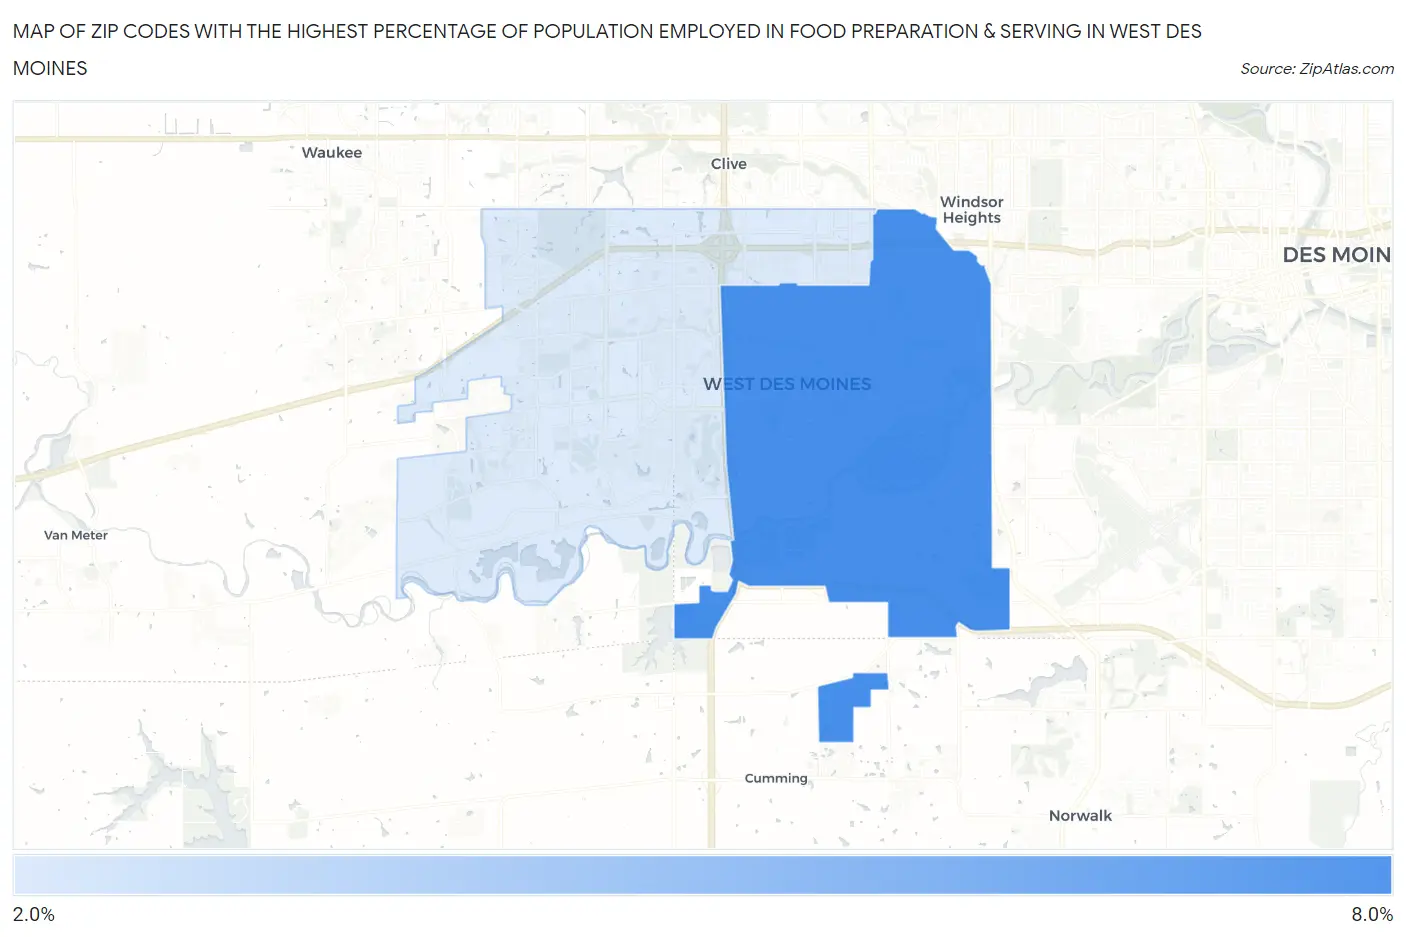
Map of Zip Codes with the Highest Percentage of Population Employed in Food Preparation & Serving in West Des Moines
2.9%
6.0%
Zip Codes with the Highest Percentage of Population Employed in Food Preparation & Serving in West Des Moines, IA
| Zip Code | % Employed | vs State | vs National | |
| 1. | 50265 | 6.0% | 5.1%(+0.893)#196 | 5.3%(+0.721)#9,323 |
| 2. | 50266 | 2.9% | 5.1%(-2.17)#544 | 5.3%(-2.34)#21,451 |
1
Common Questions
What are the Top Zip Codes with the Highest Percentage of Population Employed in Food Preparation & Serving in West Des Moines, IA?
Top Zip Codes with the Highest Percentage of Population Employed in Food Preparation & Serving in West Des Moines, IA are:
What zip code has the Highest Percentage of Population Employed in Food Preparation & Serving in West Des Moines, IA?
50265 has the Highest Percentage of Population Employed in Food Preparation & Serving in West Des Moines, IA with 6.0%.
What is the Percentage of Population Employed in Food Preparation & Serving in West Des Moines, IA?
Percentage of Population Employed in Food Preparation & Serving in West Des Moines is 4.3%.
What is the Percentage of Population Employed in Food Preparation & Serving in Iowa?
Percentage of Population Employed in Food Preparation & Serving in Iowa is 5.1%.
What is the Percentage of Population Employed in Food Preparation & Serving in the United States?
Percentage of Population Employed in Food Preparation & Serving in the United States is 5.3%.